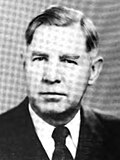
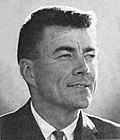
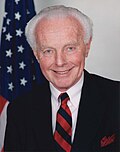
![]() | This article needs to be updated.(January 2023) |
California's 11th congressional district | |
---|---|
Interactive map of district boundaries since 2023 (Used in the 2022 elections) | |
Representative | |
Distribution |
|
Population (2023) | 701,735 |
Median household income | $129,584 [1] |
Ethnicity |
|
Cook PVI | D+37 [2] |
California's 11th congressional district is a congressional district in the U.S. state of California represented by former Speaker of the House Nancy Pelosi.
Before redistricting, the 11th district consisted of most of Contra Costa County. Mark DeSaulnier, a Democrat, represented the district from January 2015 to January 2023. Cities and CDPs in the district included Alamo, Bay Point, Blackhawk, Clayton, Concord, Diablo, El Cerrito, El Sobrante, Kensington, Lafayette, Moraga, Orinda, Pinole, Pittsburg, Pleasant Hill, San Pablo, Richmond, and Walnut Creek; most of Danville; and parts of Antioch and Martinez. [3]
Following redistricting in 2023 by the California Citizens Redistricting Commission, the 11th district is entirely in San Francisco, and includes most of the city with the exception of the Excelsior District, Visitacion Valley, Portola, and Ocean View on the city's southern edge. [4]
Year | Office | Results [5] [6] [7] [8] |
---|---|---|
2008 | President | Obama 86% - 13% |
2012 | President | Obama 87% - 13% |
2016 | President | Clinton 86% - 9% |
2018 | Governor | Newsom 87% - 13% |
Attorney General | Becerra 87% - 13% | |
2020 | President | Biden 86% - 12% |
2022 | Senate (Reg.) | Padilla 86% - 14% |
Governor | Newsom 86% - 14% | |
Lt. Governor | Kounalakis 85% - 15% | |
Secretary of State | Weber 85% - 15% | |
Attorney General | Bonta 84% - 16% | |
Treasurer | Ma 84% - 16% | |
Controller | Cohen 77% - 23% | |
2024 | President | Harris 82% - 14% |
Senate (Reg.) | Schiff 84% - 16% |
# | County | Seat | Population |
---|---|---|---|
75 | San Francisco | San Francisco | 808,988 |
Due to the 2020 redistricting, California's 11th district has effectively been shifted to the former geography of the 12th district. The district encompasses the city of San Francisco almost entirely, except for the neighborhoods of Crocker Amazon, Excelsior, Little Hollywood, Mission Terrace, Oceanview, Outer Mission, Portola, and Visitacion Valley.
Party | Candidate | Votes | % | |||
---|---|---|---|---|---|---|
Democratic | William Kettner | 24,822 | 42.7 | |||
Republican | Samuel C. Evans | 21,426 | 36.8 | |||
Socialist | Noble A. Richardson | 7,059 | 12.1 | |||
Prohibition | Helen M. Stoddard | 4,842 | 8.3 | |||
Total votes | 46,248 | 100.0 | ||||
Turnout | ||||||
Democratic gain from Republican |
Party | Candidate | Votes | % | |
---|---|---|---|---|
Democratic | William Kettner (Incumbent) | 47,165 | 52.7 | |
Republican | James Carson Needham | 25,001 | 27.9 | |
Prohibition | James S. Edwards | 11,278 | 12.7 | |
Socialist | Casper Bauer | 6,033 | 6.7 | |
Total votes | 89,477 | 100.0 | ||
Turnout | ||||
Democratic hold |
Party | Candidate | Votes | % | |
---|---|---|---|---|
Democratic | William Kettner (Incumbent) | 42,051 | 44.5 | |
Republican | Robert C. Harbison | 33,765 | 35.7 | |
Prohibition | James S. Edwards | 14,759 | 15.6 | |
Socialist | Marcus W. Robbins | 3,913 | 4.1 | |
Total votes | 94,488 | 100.0 | ||
Turnout | ||||
Democratic hold |
Party | Candidate | Votes | % | |
---|---|---|---|---|
Democratic | William Kettner (Incumbent) | 45,915 | 72.2 | |
Prohibition | Stella B. Irvine | 17,642 | 27.8 | |
Total votes | 63,557 | 100.0 | ||
Turnout | ||||
Democratic hold |
Party | Candidate | Votes | % | |||
---|---|---|---|---|---|---|
Republican | Phil Swing | 59,425 | 72.9 | |||
Democratic | Hugh L. Dickson | 22,144 | 27.1 | |||
Total votes | 81,569 | 100.0 | ||||
Turnout | ||||||
Republican gain from Democratic |
Party | Candidate | Votes | % | |
---|---|---|---|---|
Republican | Phil Swing (Incumbent) | 79,039 | 91.4 | |
Prohibition | Charles H. Randall | 7,466 | 8.6 | |
Total votes | 86,505 | 100.0 | ||
Turnout | ||||
Republican hold |
Party | Candidate | Votes | % | |
---|---|---|---|---|
Republican | Phil Swing (Incumbent) | 93,811 | 100.0 | |
Turnout | ||||
Republican hold |
Party | Candidate | Votes | % | |
---|---|---|---|---|
Republican | Phil Swing (Incumbent) | 89,726 | 100.0 | |
Turnout | ||||
Republican hold |
Party | Candidate | Votes | % | |
---|---|---|---|---|
Republican | Phil Swing (Incumbent) | 127,115 | 100.0 | |
Turnout | ||||
Republican hold |
Party | Candidate | Votes | % | |
---|---|---|---|---|
Republican | Phil Swing (Incumbent) | 124,092 | 100.0 | |
Turnout | ||||
Republican hold |
Party | Candidate | Votes | % | |
---|---|---|---|---|
Republican | William E. Evans (Incumbent) | 57,739 | 51.8 | |
Democratic | Albert D. Hadley | 38,240 | 34.3 | |
Liberty | Marshall V. Hartranft | 15,520 | 13.9 | |
Total votes | 111,499 | 100.0 | ||
Turnout | ||||
Republican hold |
Party | Candidate | Votes | % | |||
---|---|---|---|---|---|---|
Democratic | John S. McGroarty | 66,999 | 53.5 | |||
Republican | William E. Evans (Incumbent) | 56,350 | 45.0 | |||
Socialist | William E. Stephenson | 1,814 | 1.5 | |||
Total votes | 125,163 | 100.0 | ||||
Turnout | ||||||
Democratic gain from Republican |
Party | Candidate | Votes | % | |
---|---|---|---|---|
Democratic | John S. McGroarty (Incumbent) | 69,679 | 50.5 | |
Republican | John Carl Hinshaw | 54,914 | 39.8 | |
Progressive | Robert S. Funk | 12,340 | 8.9 | |
Communist | William Ingham | 1,041 | 0.8 | |
Total votes | 137,974 | 100.0 | ||
Turnout | ||||
Democratic hold |
Party | Candidate | Votes | % | |||
---|---|---|---|---|---|---|
Republican | John Carl Hinshaw | 68,712 | 47.0 | |||
Democratic | Carl Stuart Hamblen | 59,993 | 41.1 | |||
Townsend | Ralph D. Horton | 12,713 | 8.7 | |||
Progressive | John R. Grey | 3,821 | 2.6 | |||
Communist | Orla E. Lair | 817 | 0.6 | |||
Total votes | 146,056 | 100.0 | ||||
Turnout | ||||||
Republican gain from Democratic |
Party | Candidate | Votes | % | |
---|---|---|---|---|
Republican | John Carl Hinshaw (Incumbent) | 170,504 | 96.6 | |
Communist | Orla E. Lair | 6,003 | 3.4 | |
Total votes | 176,507 | 100.0 | ||
Turnout | ||||
Republican hold |
Party | Candidate | Votes | % | ||
---|---|---|---|---|---|
Democratic | George E. Outland | 31,611 | 50.7 | ||
Republican | A. J. Dingeman | 30,781 | 49.3 | ||
Total votes | 62,392 | 100.0 | |||
Turnout | |||||
Democratic win (new seat) |
Party | Candidate | Votes | % | |
---|---|---|---|---|
Democratic | George E. Outland (Incumbent) | 52,218 | 56 | |
Republican | A. J. Dingeman | 41,005 | 44 | |
Total votes | 93,223 | 100 | ||
Turnout | ||||
Democratic hold |
Party | Candidate | Votes | % | |||
---|---|---|---|---|---|---|
Republican | Ernest K. Bramblett | 41,902 | 53.1 | |||
Democratic | George E. Outland (Incumbent) | 36,996 | 46.9 | |||
Total votes | 78,898 | 100.0 | ||||
Turnout | ||||||
Republican gain from Democratic |
Party | Candidate | Votes | % | |
---|---|---|---|---|
Republican | Ernest K. Bramblett (Incumbent) | 87,143 | 80.8 | |
Progressive | Cole Weston | 14,582 | 13.5 | |
Democratic | George E. Outland (write-in) | 6,157 | 5.7 | |
Total votes | 107,882 | 100.0 | ||
Turnout | ||||
Republican hold |
Party | Candidate | Votes | % | |
---|---|---|---|---|
Republican | Ernest K. Bramblett (Incumbent) | 59,780 | 52.1 | |
Democratic | Ardis M. Walker | 55,020 | 47.9 | |
Total votes | 114,800 | 100.0 | ||
Turnout | ||||
Republican hold |
Party | Candidate | Votes | % | |
---|---|---|---|---|
Republican | Justin L. Johnson (Incumbent) | 101,052 | 87.1 | |
Progressive | Leslie B. Schilingheyde | 14,999 | 12.9 | |
Total votes | 116,051 | 100.0 | ||
Turnout | ||||
Republican hold |
Party | Candidate | Votes | % | |
---|---|---|---|---|
Republican | Justin L. Johnson (Incumbent) | 54,716 | 52.6 | |
Democratic | Carl Sugar | 49,388 | 47.4 | |
Total votes | 104,104 | 100.0 | ||
Turnout | ||||
Republican hold |
Party | Candidate | Votes | % | |||
---|---|---|---|---|---|---|
Democratic | John J. McFall | 70,630 | 53.1 | |||
Republican | Justin L. Johnson (Incumbent) | 62,448 | 46.9 | |||
Total votes | 133,078 | 100.0 | ||||
Turnout | ||||||
Democratic gain from Republican |
Party | Candidate | Votes | % | |
---|---|---|---|---|
Democratic | John J. McFall (Incumbent) | 86,924 | 69.3 | |
Republican | Frederick S. Van Dyke | 38,427 | 30.7 | |
Total votes | 125,351 | 100.0 | ||
Turnout | ||||
Democratic hold |
Party | Candidate | Votes | % | |
---|---|---|---|---|
Democratic | John J. McFall (Incumbent) | 97,368 | 65.4 | |
Republican | Clifford B. Bull | 51,473 | 34.6 | |
Total votes | 148,841 | 100.0 | ||
Turnout | ||||
Democratic hold |
Party | Candidate | Votes | % | |
---|---|---|---|---|
Republican | J. Arthur Younger (Incumbent) | 101,963 | 62.3 | |
Democratic | John D. Kaster | 61,623 | 37.7 | |
Total votes | 163,586 | 100.0 | ||
Turnout | ||||
Republican hold |
Party | Candidate | Votes | % | |
---|---|---|---|---|
Republican | J. Arthur Younger (Incumbent) | 116,022 | 54.8 | |
Democratic | W. Mark Sullivan | 95,747 | 45.2 | |
Total votes | 211,769 | 100.0 | ||
Turnout | ||||
Republican hold |
Party | Candidate | Votes | % | |
---|---|---|---|---|
Republican | J. Arthur Younger (Incumbent) | 113,679 | 59.4 | |
Democratic | W. Mark Sullivan | 77,605 | 40.6 | |
Total votes | 191,284 | 100.0 | ||
Turnout | ||||
Republican hold |
Party | Candidate | Votes | % | |
---|---|---|---|---|
Republican | Pete McCloskey | 63,850 | 57.2 | |
Democratic | Roy A. Archibald | 43,759 | 39.2 | |
Independent | Shirley Temple | 3,938 | 3.5 | |
Total votes | 111,547 | 100.0 | ||
Turnout | ||||
Republican hold |
Party | Candidate | Votes | % | |
---|---|---|---|---|
Republican | Pete McCloskey (Incumbent) | 165,482 | 79.3 | |
Democratic | Urban G. Whitaker Jr. | 40,979 | 19.6 | |
Peace and Freedom | David Demorest Ransom | 2,157 | 1.0 | |
Total votes | 208,618 | 100.0 | ||
Turnout | ||||
Republican hold |
Party | Candidate | Votes | % | |
---|---|---|---|---|
Republican | Pete McCloskey (Incumbent) | 144,500 | 77.5 | |
Democratic | Robert E. Gomperts | 39,188 | 21.0 | |
Independent | Scattering | 2,786 | 1.5 | |
Total votes | 186,474 | 100.0 | ||
Turnout | ||||
Republican hold |
Party | Candidate | Votes | % | ||
---|---|---|---|---|---|
Democratic | Leo Ryan | 113,580 | 60.4 | ||
Republican | Charles E. Chase | 69,655 | 37.0 | ||
American Independent | Nicholas Waeil Kudrovzeff | 4,852 | 2.6 | ||
Total votes | 188,087 | 100.0 | |||
Turnout | |||||
Democratic win (new seat) |
Party | Candidate | Votes | % | |
---|---|---|---|---|
Democratic | Leo Ryan (Incumbent) | 106,075 | 75.8 | |
Republican | Bob Jones | 29,783 | 21.3 | |
American Independent | Nicholas Waeil Kudrovzeff | 4,293 | 2.9 | |
Total votes | 140,151 | 100.0 | ||
Turnout | ||||
Democratic hold |
Party | Candidate | Votes | % | |
---|---|---|---|---|
Democratic | Leo Ryan (Incumbent) | 107,618 | 61.1 | |
Republican | Bob Jones | 62,435 | 35.4 | |
American Independent | Nicholas Waeil Kudrovzeff | 6,141 | 3.5 | |
Total votes | 176,194 | 100.0 | ||
Turnout | ||||
Democratic hold |
Party | Candidate | Votes | % | |
---|---|---|---|---|
Democratic | Leo Ryan (Incumbent) | 92,882 | 60.5 | |
Republican | Dave Welch | 54,621 | 35.6 | |
American Independent | Nicholas Waeil Kudrovzeff | 5,961 | 3.9 | |
Total votes | 153,464 | 100.0 | ||
Turnout | ||||
Democratic hold |
Party | Candidate | Votes | % | |||
---|---|---|---|---|---|---|
Republican | William Royer | 52,585 | 57.3 | |||
Democratic | G.W. "Joe" Holsinger | 37,685 | 41.1 | |||
American Independent | Nicholas W. Kudrovzeff | 770 | 0.8 | |||
Peace and Freedom | Wilson G. Branch | 731 | 0.8 | |||
Total votes | 91,771 | 100.0 | ||||
Turnout | ||||||
Republican gain from Democratic |
Party | Candidate | Votes | % | |||
---|---|---|---|---|---|---|
Democratic | Tom Lantos | 85,823 | 46.4 | |||
Republican | William Royer (Incumbent) | 80,100 | 43.3 | |||
Peace and Freedom | Wilson G. Branch | 13,723 | 7.4 | |||
Libertarian | William S. Wade Jr. | 3,816 | 2.1 | |||
American Independent | Nicholas W. Kudrovzeff | 1,550 | 0.8 | |||
Total votes | 185,012 | 100.0 | ||||
Turnout | ||||||
Democratic gain from Republican |
Party | Candidate | Votes | % | |
---|---|---|---|---|
Democratic | Tom Lantos (Incumbent) | 109,812 | 57.1 | |
Republican | William Royer | 76,462 | 39.7 | |
Libertarian | Chuck Olson | 2,920 | 1.5 | |
Peace and Freedom | Wilson G. Branch | 1,928 | 1.0 | |
American Independent | Nicholas W. Kudrovzeff | 1,250 | 0.6 | |
Total votes | 192,372 | 100.0 | ||
Turnout | ||||
Democratic hold |
Party | Candidate | Votes | % | |
---|---|---|---|---|
Democratic | Tom Lantos (Incumbent) | 147,607 | 69.9 | |
Republican | John J. "Jack" Hickey | 59,625 | 28.2 | |
American Independent | Nicholas W. Kudrovzeff | 3,883 | 1.8 | |
Total votes | 211,115 | 100.0 | ||
Turnout | ||||
Democratic hold |
Party | Candidate | Votes | % | |
---|---|---|---|---|
Democratic | Tom Lantos (Incumbent) | 112,380 | 74.1 | |
Republican | Bill Quarishi | 39,315 | 25.9 | |
Total votes | 151,695 | 100.0 | ||
Turnout | ||||
Democratic hold |
Party | Candidate | Votes | % | |
---|---|---|---|---|
Democratic | Tom Lantos (Incumbent) | 145,484 | 71.0 | |
Republican | Bill Quarishi | 50,050 | 24.4 | |
Libertarian | Bill Wade | 4,683 | 2.3 | |
Peace and Freedom | Victor Martinez | 2,906 | 1.4 | |
American Independent | Nicholas W. Kudrovzeff | 1,893 | 0.9 | |
Total votes | 205,016 | 100.0 | ||
Turnout | ||||
Democratic hold |
Party | Candidate | Votes | % | |
---|---|---|---|---|
Democratic | Tom Lantos (Incumbent) | 105,029 | 65.9 | |
Republican | Bill Quarishi | 45,818 | 28.8 | |
Libertarian | June R. Genis | 8,518 | 5.3 | |
Total votes | 159,365 | 100.0 | ||
Turnout | ||||
Democratic hold |
Party | Candidate | Votes | % | ||
---|---|---|---|---|---|
Republican | Richard Pombo | 94,453 | 47.6 | ||
Democratic | Patti Garamendi | 90,539 | 45.6 | ||
Libertarian | Christine Roberts | 13,498 | 6.8 | ||
Total votes | 198,490 | 100.0 | |||
Turnout | |||||
Republican win (new seat) |
Party | Candidate | Votes | % | |
---|---|---|---|---|
Republican | Richard Pombo (Incumbent) | 99,302 | 62.14 | |
Democratic | Randy A. Perry | 55,794 | 34.91 | |
Libertarian | Joseph B. Miller | 4,718 | 2.95 | |
Total votes | 159,814 | 100.0 | ||
Turnout | ||||
Republican hold |
Party | Candidate | Votes | % | |
---|---|---|---|---|
Republican | Richard Pombo (Incumbent) | 107,477 | 59.4 | |
Democratic | Jason Silva | 65,536 | 36.2 | |
Libertarian | Kelly Rego | 5,077 | 2.8 | |
Natural Law | Selene Bush | 3,006 | 1.6 | |
Total votes | 181,096 | 100.0 | ||
Turnout | ||||
Republican hold |
Party | Candidate | Votes | % | |
---|---|---|---|---|
Republican | Richard Pombo (Incumbent) | 95,496 | 61.43 | |
Democratic | Robert L. Figueroa | 56,345 | 36.25 | |
Libertarian | Jesse Baird | 3,608 | 2.32 | |
Total votes | 155,449 | 100.0 | ||
Turnout | ||||
Republican hold |
Party | Candidate | Votes | % | |
---|---|---|---|---|
Republican | Richard Pombo (Incumbent) | 120,635 | 57.9 | |
Democratic | Tom Y. Santos | 79,539 | 38.1 | |
Libertarian | Kathryn A. Russow | 5,036 | 2.4 | |
Natural Law | Jon A. Kurey | 3,397 | 1.6 | |
Total votes | 208,607 | 100.0 | ||
Turnout | ||||
Republican hold |
Party | Candidate | Votes | % | |
---|---|---|---|---|
Republican | Richard Pombo (Incumbent) | 104,921 | 60.4 | |
Democratic | Elaine Shaw | 69,035 | 39.6 | |
Total votes | 173,956 | 100.0 | ||
Turnout | ||||
Republican hold |
Party | Candidate | Votes | % | |
---|---|---|---|---|
Republican | Richard Pombo (Incumbent) | 163,582 | 61.3 | |
Democratic | Jerry McNerney | 103,587 | 38.7 | |
Total votes | 267,169 | 100.0 | ||
Turnout | ||||
Republican hold |
Party | Candidate | Votes | % | |||
---|---|---|---|---|---|---|
Democratic | Jerry McNerney | 109,868 | 53.3 | |||
Republican | Richard Pombo (Incumbent) | 96,396 | 46.7 | |||
Total votes | 206,264 | 100.0 | ||||
Turnout | ||||||
Democratic gain from Republican |
Party | Candidate | Votes | % | |
---|---|---|---|---|
Democratic | Jerry McNerney (Incumbent) | 164,500 | 55.3 | |
Republican | Dean Andal | 133,104 | 44.7 | |
Total votes | 297,616 | 100.0 | ||
Turnout | ||||
Democratic hold |
Party | Candidate | Votes | % | |
---|---|---|---|---|
Democratic | Jerry McNerney (Incumbent) | 115,361 | 47.97 | |
Republican | David Harmer | 112,703 | 46.86 | |
American Independent | David Christensen | 12,439 | 5.17 | |
Total votes | 240,503 | 100.00 | ||
Democratic hold |
Party | Candidate | Votes | % | |
---|---|---|---|---|
Democratic | George Miller (Incumbent) | 200,743 | 69.7 | |
Republican | Virginia Fuller | 87,136 | 30.3 | |
Total votes | 287,879 | 100.0 | ||
Democratic hold |
Party | Candidate | Votes | % | |
---|---|---|---|---|
Democratic | Mark DeSaulnier | 117,502 | 67% | |
Republican | Tue Phan | 57,160 | 33% | |
Total votes | 174,662 | 100.0% | ||
Democratic hold |
Party | Candidate | Votes | % | |
---|---|---|---|---|
Democratic | Mark DeSaulnier (Incumbent) | 214,868 | 72% | |
Republican | Roger A. Petersen | 83,341 | 28% | |
Total votes | 298,209 | 100.0% | ||
Democratic hold |
Party | Candidate | Votes | % | |
---|---|---|---|---|
Democratic | Mark DeSaulnier (Incumbent) | 204,369 | 74% | |
Republican | John Fitzgerald | 71,312 | 25% | |
Total votes | 275,681 | 100.0% | ||
Democratic hold |
Party | Candidate | Votes | % | |
---|---|---|---|---|
Democratic | Mark DeSaulnier (incumbent) | 271,063 | 73.0 | |
Republican | Nisha Sharma | 100,293 | 27.0 | |
Total votes | 371,356 | 100.0 | ||
Democratic hold |
Party | Candidate | Votes | % | |
---|---|---|---|---|
Democratic | Nancy Pelosi (incumbent) | 220,848 | 84.0 | |
Republican | John Dennis | 42,217 | 16.0 | |
Total votes | 263,065 | 100.0 | ||
Democratic hold |
Party | Candidate | Votes | % | |
---|---|---|---|---|
Democratic | Nancy Pelosi (incumbent) | 274,796 | 81.0 | |
Republican | Bruce Lou | 64,315 | 19.0 | |
Total votes | 339,111 | 100.0 | ||
Democratic hold |