Demography of Australia

Last updated

Demographics of Australia
Australia Population Pyramid in 2022.svg
Population pyramid of Australia in 2022
Population26,141,369
Growth rate1.25% (2022 est.)
Birth rate12.3 births/1,000 population
Death rate6.77 deaths/1,000 population
Life expectancy83.09 years
  male80.93 years
  female85.36 years
Fertility rate1.73 children
Infant mortality rate3.01 deaths/1,000 live births
Net migration rate6.93 migrant(s)/1,000 population
Sex ratio
Total0.99 male(s)/female (2022 est.)
At birth1.06 male(s)/female
Nationality
Nationality Australian

The population of Australia is estimated to be 25,937,500 as of 18August2022. [1] Australia is the 55th [2] most populous country in the world and the most populous Oceanian country. Its population is concentrated mainly in urban areas and is expected to exceed 28 million by 2030. [3]

Contents

Australia's population has grown from an estimated population of between 300,000 and 1,000,000 Indigenous Australians at the time of British colonisation in 1788 due to numerous waves of immigration during the period since. Also due to immigration, the European component's share of the population rose sharply in the late 18th and 19th centuries, but is now declining as a percentage. [4]

Australia has an average population density of 3.4 persons per square kilometre of total land area, which makes it one of the most sparsely populated countries in the world. This is generally attributed to the semi-arid and desert geography of much of the interior of the country. Another factor is urbanisation, with 89% of its population living in a handful of urban areas, Australia is one of the world's most urbanised countries. [5] The life expectancy of Australia in 2015–2017 was 83.2 years, among the highest in the world. [6]

Cities

Australia contains five cities that consist of over one million people. Most of Australia's population live close to coastlines. [7]

 
Largest populated areas in Australia
Rank Name State Pop. Rank Name State Pop.
1 Sydney NSW 5,312,16311 Geelong Vic 275,794
2 Melbourne Vic 5,078,19312 Hobart Tas 236,136
3 Brisbane Qld 2,514,18413 Townsville Qld 181,668
4 Perth WA 2,085,97314 Cairns Qld 153,951
5 Adelaide SA 1,359,76015 Darwin NT 147,255
6 Gold CoastTweed Heads Qld/NSW 693,67116 Toowoomba Qld 138,223
7 NewcastleMaitland NSW 491,47417 Ballarat Vic 107,652
8 CanberraQueanbeyan ACT/NSW 462,13618 Bendigo Vic 100,991
9 Sunshine Coast Qld 341,06919 Albury-Wodonga NSW/Vic 93,603
10 Wollongong NSW 306,03420 Launceston Tas 87,382

Ancestry

The earliest accepted timeline for the first arrivals of indigenous Australians to the continent of Australia places this human migration to at least 65,000 years ago, [9] most probably from the islands of Indonesia and New Guinea. [10]

Captain James Cook claimed the east coast for Great Britain in 1770; the west coast was later settled by Britain also. At that time, the indigenous population was estimated to have been between 315,000 and 750,000, [11] divided into as many as 500 tribes speaking many different languages.

Between 1788 and the Second World War, the vast majority of settlers and immigrants came from the British Isles (principally England, Ireland and Scotland), although there was significant immigration from China and Germany during the 19th century. In the decades immediately following the Second World War, Australia received a large wave of immigration from across Europe, with many more immigrants arriving from Southern and Eastern Europe than in previous decades. Since the end of the White Australia policy in 1973, Australia has pursued an official policy of multiculturalism, [12] and there has been a large and continuing wave of immigration from across the world, with Asia being the largest source of immigrants in the 21st century. [13]

The Australian Bureau of Statistics does not collect data on race, but asks each Australian resident to nominate up to two ancestries each census. [14] These ancestry responses are classified into broad standardised ancesty groups. [15] At the 2021 census, the number of ancestry responses within each standardised group as a proportion of the total population was as follows: [16] 57.2% European (including 46% North-West European and 11.2% Southern and Eastern European), 33.8% Oceanian [N 1] , 17.4% Asian (including 6.5% Southern and Central Asian, 6.4% North-East Asian, and 4.5% South-East Asian), 3.2% North African and Middle Eastern, 1.4% Peoples of the Americas, and 1.3% Sub-Saharan African. At the 2021 census, the most commonly nominated individual ancestries as a proportion of the total population were: [18]

At the 2021 census, 3.2% of the Australian population identified as being IndigenousAboriginal Australians and Torres Strait Islanders. [N 4] [19] In 2020, 7.5% of births were Aboriginal and Torres Strait Islander persons up from 5.7% in 2010; Aboriginal and Torres Strait Islander fertility rates have stayed above replacement levels even as the nation's has declined rapidly. [20]

Immigration and country of birth

In 2019, 30% of the Australian resident population, or 7,529,570 people, were born overseas. [21]

Australia's population has quadrupled since the end of World War I, [22] much of this increase from immigration. Australia has the world's eighth-largest immigrant population, with immigrants accounting for 30% of the population, a higher proportion than in any other nation with a population of over 10 million. [21] [23] Most immigrants are skilled, [24] but the immigration quota includes categories for family members and refugees. [24]

The following table shows Australia's population by country of birth as estimated by the Australian Bureau of Statistics in 2021. It shows only countries or regions or birth with a population of over 100,000 residing in Australia.

Source: Australian Bureau of Statistics (2021) [25]
Place of birthEstimated resident population [upper-alpha 1]
Total Australian-born 18,235,690
Total foreign-born 7,502,450
Flag of England.svg England [upper-alpha 2] 967,390
Flag of India.svg India 710,380
Flag of the People's Republic of China.svg China [upper-alpha 3] 595,630
Flag of New Zealand.svg New Zealand 559,980
Flag of the Philippines.svg Philippines 310,620
Flag of Vietnam.svg Vietnam 268,170
Flag of South Africa.svg South Africa 201,930
Flag of Malaysia.svg Malaysia 172,250
Flag of Italy.svg Italy 171,520
Flag of Sri Lanka.svg Sri Lanka 145,790
Flag of Scotland.svg Scotland [upper-alpha 2] 130,060
Flag of Nepal.svg Nepal 129,870
Flag of the United States.svg United States 109,450
Flag of Germany.svg Germany 107,940
Flag of South Korea.svg South Korea 106,560
Flag of Hong Kong.svg Hong Kong [upper-alpha 3] 104,990
Flag of Greece.svg Greece 100,650
  1. Only countries with 100,000 or more are listed here.
  2. 1 2 The Australian Bureau of Statistics source lists England, Scotland, Wales and Northern Ireland separately although they are all part of the United Kingdom. These should not be combined as they are not combined in the source.
  3. 1 2 In accordance with the Australian Bureau of Statistics source, Mainland China, Taiwan and the Special Administrative Regions of Hong Kong and Macau are listed separately.

For more information about immigration see Immigration to Australia and Foreign-born population of Australia.

Religion

Religion in Australia as declared in the 2021 census [26]

   No religion (38.9%)
   Catholicism (20.0%)
   Protestantism (18.1%)
   Orthodoxy (2.1%)
  Other Christian (3.7%)
   Islam (3.2%)
   Hinduism (2.7%)
   Buddhism (2.4%)
  Other religions (1.7%)
  Not stated or unclear (7.2%)

At the 2021 Census, 38.9% of the population identified as having "no religion", [27] up from 15.5% in 2001. [28] The largest religion is Christianity (43.9% of the population). [29] The largest Christian denominations are the Roman Catholic Church (20% of the population) and the Anglican Church of Australia (9.8%). Multicultural immigration since the Second World War has led to the growth of non-Christian religions, the largest of which are Islam (3.2%), Hinduism (2.7%), Buddhism (2.4%), Sikhism (0.8%), and Judaism (0.4%). [30]

The Australian Bureau of Statistics 2001 Census Dictionary statement on religious affiliation states the purpose for gathering such information:

Data on religious affiliation are used for such purposes as planning educational facilities, aged persons' care and other social services provided by religion-based organisations; the location of church buildings; the assigning of chaplains to hospitals, prisons, armed services and universities; the allocation of time on public radio and other media; and sociological research.

Historically, Australian Aboriginal religion and mythology was the prevalent belief system in Australia until around 1840, when European Australians first outnumbered indigenous Australians. For a period, in the 19th and 20th centuries, Australia was majority Protestant with a large Catholic minority. [31] [32] Catholics first outnumbered Anglicans in the 1986 census. [33] As a result of this history, while Australia has no official religion and "no religion" constitutes the largest group by religious identification, the various governments of Australia refer to the Christian God in their ceremonies, as do the various Australian Courts. [34]

As in many Western countries, the level of active participation in religious services is lower than would be indicated by the proportion of the population identifying themselves as affiliated with a religion; weekly attendance at Christian church services is about 1.5 million, or about 7.5% of the population. [35] Christian charitable organisations, hospitals and schools play a prominent role in welfare and education services. The Catholic education system is the second biggest sector after government schools, with more than 650,000 students (and around 21 per cent of all secondary school enrolments).

Language

Percentage of people who speak the English language at home in 2016 Rate in which the English language is spoken at home in Australia - 2016.png
Percentage of people who speak the English language at home in 2016

Although Australia has no official language, English has always been entrenched as the de facto national language. [36] Australian English is a major variety of the language with a distinctive accent and lexicon, [37] and differs slightly from other varieties of English in grammar and spelling. [38] General Australian serves as the standard dialect.

At the 2021 census, English was the only language spoken in the home for 72% of the population. The next most common languages spoken at home are Mandarin (2.7%), Arabic (1.4%), Vietnamese (1.3%), Cantonese (1.2%) and Punjabi (0.9%). [39] A considerable proportion of first- and second-generation migrants are bilingual.

Over 250 Indigenous Australian languages are thought to have existed at the time of first European contact, of which less than 20 are still in daily use by all age groups. [40] [41] About 110 others are spoken exclusively by older people. [41] At the time of the 2006 census, 52,000 Indigenous Australians, representing 12% of the Indigenous population, reported that they spoke an Indigenous language at home. [42] Australia has a sign language known as Auslan, which is the main language of about 5,500 deaf people. [43]

Indigenous population

Indigenous Australians as a percentage of the population as of the 2011 census Australian Census 2011 demographic map - Australia by SLA - BCP field 0054 Indigenous Persons Total Persons.svg
Indigenous Australians as a percentage of the population as of the 2011 census

The earliest accepted timeline for the first arrivals of indigenous Australians to the continent of Australia places this human migration to at least 40,000 years ago. [10]

These first inhabitants of Australia were generalised as hunter-gatherers, who over the course of many succeeding generations diversified widely throughout the continent and its nearby islands in over 500 different nations. Although their technical culture remained static—depending on wood, bone, and stone tools and weapons— they developed intricate agricultural systems and carefully managed their environment to ensure ongoing sustainability. In addition to this their spiritual lore (system of law) and social life was highly complex. Most spoke several languages, and nation groups sometimes linked widely scattered tribal groups. Aboriginal population density ranged from approximately one person per 3 km2 (1 sq mi) along the coasts to one person per 90 km2 (35 sq mi) in the arid interior. Food procurement was usually a matter for the nuclear family, requiring an estimated 3 days of work per week.[ citation needed ]

Dutch navigators landed on the coasts of modern Western Australia and Queensland several times during the 17th century. Captain James Cook wrote that he claimed the east coast for Great Britain in 1770 while standing on Possession Island off the west coast of Cape York Peninsula. The west coast was later settled by Britain also. At that time, the indigenous population was estimated to have been between 315,000 and 750,000, [11] divided into many tribes speaking many different languages. In the 2011 census, 495,757 respondents declared they were Aboriginal, 31,407 declared they were Torres Strait Islander, and a further 21,206 declared they were both Aboriginal and Torres Strait Islanders. [44]

Since the end of World War II, efforts have been made both by the government and by the public to be more responsive to Aboriginal rights and needs.[ citation needed ]

Today, most of Australia's Indigenous population live on the east coast of Australia, where almost 60% of Indigenous Australians live in New South Wales (208,476) and Queensland (188,954) which roughly represents 2–5% of those state's populations. The Northern Territory has an Indigenous population of almost 70,000 and represents about 30% of the total Northern Territory population.[ citation needed ]

States and territories

State/territoryPopulation
(Sept 2020 estimate) [45]
Land areaPopulation density% of total

national

population

 % of
population
living in capital
Notes
km² mi² per km²per mi²
Flag of New South Wales.svg  New South Wales 8,166,400800,642309,1308.642232%63% [46]
Flag of Victoria (Australia).svg  Victoria 6,680,600227,41687,80623.546126%71% [47]
Flag of Queensland.svg  Queensland 5,184,8001,730,648668,2072.50620%46% [48]
Flag of Western Australia.svg  Western Australia 2,667,1002,239,170864,5480.89210%73.4% [49]
Flag of South Australia.svg  South Australia 1,770,600983,482379,7251.6247%73.5% [50]
Flag of Tasmania.svg  Tasmania 541,10068,40126,4107.24192%41% [51]
Flag of the Australian Capital Territory.svg  Australian Capital Territory 431,2002,358910151.493922%100% [52]
Flag of the Northern Territory.svg  Northern Territory 246,5001,349,129520,9020.160.41%54% [53]

Historical population

European Australians from 1947 to 1966 when racial data was collected in the country European Australians from 1947 to 1966.gif
European Australians from 1947 to 1966 when racial data was collected in the country

Note that population estimates in the table below do not include the Aboriginal population before 1961. Estimates of Aboriginal population prior to European settlement range from 300,000 to one million, with archaeological finds indicating a sustainable maximum population of around 750,000. [54] Where available, actual population figures from census years are included.

Historic population (estimated)
Pre-1788
YearIndigenous population±%
pre 1788300,000 to 1,000,000    
Source: [55]
Settlement   Federation
YearNon-indigenous population±% p.a.
1788 859    
1798 4,588+18.24%
1808 10,263+8.38%
1818 25,859+9.68%
1828 58,197+8.45%
1838 151,868+10.07%
1848 332,328+8.15%
1858 1,050,828+12.20%
1868 1,539,552+3.89%
1878 2,092,164+3.11%
1888 2,981,677+3.61%
1898 3,664,715+2.08%
Source: [56]
Post-Federation
YearTotal population±%
1901 3,788,123    
1906 4,059,083+7.2%
1911 4,489,545+10.6%
1916 4,943,173+10.1%
1921 5,455,136+10.4%
1926 6,056,360+11.0%
1931 6,526,485+7.8%
1936 6,778,372+3.9%
1941 7,109,898+4.9%
1946 7,465,157+5.0%
1951 8,421,775+12.8%
1956 9,425,563+11.9%
1961 10,548,267+11.9%
1966 11,599,498+10.0%
1971 13,067,265+12.7%
1976 14,033,083+7.4%
1981 14,923,260+6.3%
1986 16,018,350+7.3%
1991 17,284,036+7.9%
1996 18,224,767+5.4%
2001 18,769,249+3.0%
2006 19,855,288+5.8%
2011 21,507,717+8.3%
2016 23,401,892+8.8%
2021 25,417,978+8.6%
Note: Estimated populations prior to 1961 do not include the Indigenous population.
Source: [57] [58] [59] [60] [61]
Historical population of Australia Historical population of Australia.svg
Historical population of Australia

Total fertility rate from 1850 to 1899

The total fertility rate is the number of children born per woman. It is based on fairly good data for the entire period. Sources: Our World In Data and Gapminder Foundation. [62]

The following figures show the total fertility rates since the first years of British colonisation.

Total fertility rate in Australia [62]
1850s
1850185118521853185418551856185718581859
4.945.014.075.034.865.325.195.635.715.75
1860s
1860186118621863186418651866186718681869
5.715.675.85.595.755.645.335.415.435.19
1870s
1870187118721873187418751876187718781879
5.195.094.975.014.934.814.814.694.744.8
1880s
1880188118821883188418851886188718881889
4.734.734.624.664.774.784.744.774.764.65
1890s
1890189118921893189418951896189718981899
4.694.624.524.44.134.073.813.783.643.66

Crude birth rates from 1860 to 1899

The crude birth rate is the total number of live births per 1,000 population in a year. Source: Australian Bureau of Statistics. [63]

Crude birth rate in Australia [63]
1860s
1860186118621863186418651866186718681869
42.642.343.341.742.942.139.840.440.538.7
1870s
1870187118721873187418751876187718781879
38.738.037.137.436.835.935.935.035.435.8
1880s
1880188118821883188418851886188718881889
35.335.334.534.835.635.735.435.635.534.7
1890s
1890189118921893189418951896189718981899
35.034.533.732.830.830.428.428.227.227.3

Historical distribution of the total population by age

Source: Australian Bureau of Statistics. [64] [65] [66] [67]

Ages1901191119211931194119511961197119811991200120072016
0–14 years35.131.631.828.524.227.230.328.725.021.920.519.418.6
15–24 years19.420.116.918.117.514.114.317.417.416.013.714.012.8
25–44 years29.428.830.029.330.029.427.727.428.428.630.029.227.9
45–64 years12.014.817.018.020.920.419.920.019.219.323.125.025.1
65 years and over4.04.34.56.17.48.18.58.39.811.312.613.215.8
Total (%)10099.6100100100100100100100100100100100

Historical median age of the population

Median age of the Australia population through history. Source: Australian Bureau of Statistics. [65] [66] [68] [69]

Years19011911192119511961197119811991200120152017
Median age of the total population22.524.025.830.329.327.729.632.435.737.438.7
Median age of males23.624.626.129.928.727.029.031.734.937.9
Median age of females21.523.425.530.830.228.330.233.036.439.5

Vital statistics since 1900

Source: [70]

Average populationLive birthsDeathsNatural changeCrude birth rate (per 1,000)Crude death rate (per 1,000)Natural change (per 1,000) Total fertility rates [upper-alpha 1] [62] Net overseas migration [71] [72] [73]
19003,715,000102,22144,06027.315.53.66
19013,765,000102,94546,33056,61527.112.214.93.64
19023,824,000102,77648,07854,69826.712.514.23.39
19033,875,00098,44347,29351,15025.312.113.23.58
19043,916,000104,11343,57260,54126.411.015.43.54
19053,974,000104,94143,51461,42726.210.915.33.51
19064,032,000107,89044,33363,55726.610.915.73.35
19074,091,000110,34745,30555,04226.711.015.73.35
19084,161,000111,54546,42655,11926.611.115.53.35
19094,232,000114,07144,17259,89926.710.316.43.35
19104,323,000116,80145,59061,21126.710.416.33.35
19114,425,000122,19347,86974,32427.210.616.63.51
19124,573,000133,08852,17780,91128.611.217.43.51
19134,820,172135,71451,78983,92528.210.717.53.51
19144,893,000137,98351,72086,26328.010.517.53.51
19154,971,000134,87152,78282,08927.110.616.53.51
19164,969,000131,42654,19777,21926.611.015.63.07
19174,917,000129,96548,02981,93626.39.716.63.35
19184,982,000125,73950,24975,49025.010.015.03.07
19195,080,000122,29065,93056,36023.612.710.93.07
19205,303,000136,40656,28980,11725.510.515.53.07
19215,411,000136,19854,07682,12224.99.915.03.12
19225,510,000137,49651,31186,18524.79.215.53.11
19235,637,000135,22256,23678,98623.79.913.83.02
19245,755,000134,92754,98079,95323.29.413.82.97
19255,882,000135,79254,65881,13422.99.213.72.95
19266,000,000133,16256,95276,21022.09.412.62.85
19276,124,000133,69858,28275,71621.69.412.22.80
19286,251,000134,07859,37874,70021.39.411.92.77
19296,355,000129,48060,85768,62320.29.510.72.64
19306,436,000128,39955,33173,06819.88.611.22.58
19316,500,000118,50956,56061,94918.28.79.52.36
19326,552,000110,93356,75754,17616.98.68.32.19
19336,603,000111,26959,11752,15216.88.97.92.17
19346,656,000109,47562,22947,24616.49.37.12.11
19356,707,000111,32563,59947,72616.59.47.12.12
19366,755,000116,07363,93252,14117.19.47.72.18
19376,810,000119,13164,49654,63517.49.48.02.21
19386,871,000120,41566,45153,96417.49.67.82.21
19396,935,000122,89169,14753,74417.69.97.72.22
19407,004,000126,34768,38457,96317.99.78.22.26
19417,077,000134,52571,17663,34918.910.08.92.36
19427,143,000136,70875,19161,51719.110.58.62.38
19437,201,000149,29574,48674,80920.610.310.32.57
19447,269,000153,34469,59683,74821.09.511.52.63
19457,347,000160,56070,23190,22921.79.512.22.74
19467,430,000176,37974,661101,71823.610.013.62.99
19477,517,000182,38473,468108,91624.19.714.43.08
19487,637,000177,97676,839101,13723.110.013.12.98
19497,792,000181,26175,260106,00122.99.513.42.99
19508,045,000190,59178,187112,40423.39.613.73.01
19518,307,000193,29881,788111,51023.09.713.33.06
19528,527,000201,65081,597120,05323.49.513.93.15
19538,739,000202,23580,188122,04722.99.113.83.23
19548,902,000202,25681,805120,45122.59.113.43.3
19559,089,000207,67782,036125,64122.68.913.73.35
19569,311,000212,63386,088126,54522.59.113.43.39
19579,530,000220,35884,953135,40522.98.814.13.41
19589,744,000222,50483,723138,48122.68.514.13.42
19599,947,000226,97689,212137,76522.68.913.73.41
196010,160,000230,32688,464141,86222.48.613.83.39
196110,391,000239,98688,961151,02522.88.514.33.35
196210,642,000237,08193,163143,91822.18.713.43.3
196310,846,000235,68994,894140,79521.58.712.83.24
196411,055,000229,149100,594128,55520.58.711.83.17
196511,280,000222,85499,715123,13919.68.810.82.97
196611,505,000223,731103,929119,80219.39.010.32.89
196711,704,000229,796102,703127,09319.48.710.72.85
196811,912,000240,906109,547131,35920.09.110.92.89
196912,145,000250,175106,496143,68120.48.711.72.93
197012,407,000257,516113,048144,46820.59.010.52.94
197112,663,000276,361110,650165,71121.58.612.92.98
197213,067,000271,960110,191161,76920.68.412.22.74
197313,303,000255,848111,336144,51219.18.310.82.49
197413,504,000243,658110,179133,47917.98.19.82.32
197513,722,000239,794114,501125,29317.48.39.12.15
197613,892,000231,135110,610120,52516.67.98.72.06
197714,033,000226,954111,490115,46416.17.98.22.01
197814,192,000226,359108,059118,30015.97.68.31.95
197914,359,000223,370108,315115,05515.57.58.01.91
198014,515,000223,664106,654117,01015.37.38.01.89
198114,695,000230,920109,429121,49115.67.48.21.94
198214,923,000237,076110,990116,08615.77.48.31.93128,100
198315,184,000241,764112,918128,84615.87.48.41.9273,300
198415,393,000240,544110,887129,65715.57.28.31.8449,100
198515,579,000241,814114,197127,61715.47.38.11.9273,800
198615,788,000239,115116,069123,04615.07.37.71.87100,500
198716,018,000242,977116,139126,83815.07.27.81.85125,800
198816,263,000246,200120,463125,73715.07.37.71.83149,400
198916,532,000250,155118,767131,38815.17.18.01.84157,500
199016,814,000257,521125,112132,40915.37.47.91.90124,700
199117,065,000261,158119,572141,58615.27.08.21.8586,500
199217,284,000259,186120,836138,35014.96.98.01.8968,600
199317,494,000259,959121,338138,62114.86.97.91.8630,100
199417,667,000258,314123,496134,81814.57.07.51.8446,600
199517,854,000258,210126,232131,97814.47.07.41.8280,200
199618,071,000250,438126,400124,03813.86.96.91.80104,000
199718,310,000253,660127,298126,36213.76.96.81.7887,200
199818,517,000249,105129,255119,85013.46.96.51.7579,100
199918,711,000249,965128,278121,48713.36.86.51.7596,500
200018,925,000249,310128,392120,91813.16.76.41.75107,200
200119,153,000247,500128,913118,58712.86.76.11.73135,700
200219,413,000250,988133,707117,28112.96.96.01.77110,600
200319,651,000246,663132,239114,42412.56.75.81.75116,500
200419,895,000249,082133,231115,85112.46.75.71.76100,000
200520,127,000255,934131,354124,58012.66.56.11.79123,800
200620,394,000263,540134,041129,49912.86.56.31.82146,700
200720,697,000274,330134,785139,54513.26.46.81.87232,700
200821,015,000302,272143,946158,32614.46.87.62.02277,400
200921,262,000295,700140,760154,94013.96.67.31.90299,800
201022,183,000297,900143,473154,42713.46.47.01.89172,038
201122,340,000301,617146,932156,05013.56.66.91.92205,679
201222,723,000309,582147,098161,78213.66.57.11.91241,151
201323,162,000308,065147,708160,35713.36.46.91.88235,797
201423,413,000299,697153,400146,30012.86.56.31.8179,000
201523,858,000305,377159,052146,32512.86.76.11.81181,000
2016 [74] 24,385,600311,104158,504152,60012.96.56.41.789243,800
201724,770,700 [75] 309,142160,909148,23312.66.56.11.741241,700
201825,180,200 [76] 315,147 [77] 158,493156,65412.66.56.11.740248,400
201925,522,100305,832169,301136,53112.16.75.41.657210,700
202025,694,393294,369161,300133,06911.56.35.21.5813,300
202125,417,978(c)310,000171,500138,50012.26.75.5

(c) = census results.

In 2012, the total fertility rate of Australian-born women was 1.94, while for overseas-born women, it was 1.81, [78] while in 2013, it was 1.91 and 1.79 respectively. [79] In 2017, TFR was 1.68 for overseas women (overseas father 1.73) and 1.78 for native women (native father 1.69).

Life expectancy development in Australia Life expectancy development in Australia.svg
Life expectancy development in Australia

Life expectancy at birth from 1921 to 2015

Sources: Our World In Data and the United Nations.

1921–1949
1920s
192119221923192419251926192719281929
61.062.961.762.563.262.962.862.963.1
1930s
1930193119321933193419351936193719381939
64.965.365.665.464.865.165.265.865.865.8
1940s
1940194119421943194419451946194719481949
66.266.165.966.468.068.568.068.668.569.1

Source: Our World in Data [80]

1950–2015
PeriodLife expectancy in
Years
PeriodLife expectancy in
Years
1950–195569.41985–199076.2
1955–196070.41990–199577.7
1960–196570.91995–200078.8
1965–197070.82000–200580.3
1970–197571.82005–201081.5
1975–198073.62010–201582.3
1980–198575.1

Source: UN World Population Prospects [81]

Other general demographic statistics

As of February 2018, the population growth rate was 0.9%. [82] This rate was based on estimates of (April 2019): [1]

Much of the data that follows has been derived from the CIA World Factbook [73] and the Australian Bureau of Statistics, through censuses.

Population

Estimated resident population of Australia since 1981 ABS-3101.0-AustralianDemographicStatistics-EstimatedResidentPopulationStatesTerritories-EstimatedResidentPopulation-Persons-Australia-A2060842F.svg
Estimated resident population of Australia since 1981

The following figures are ABS estimates for the resident population of Australia, based on the 2001 and 2006 Censuses and other data.

25,937,500 (as of 18August2022) [1]
23,470,145 (July 2018 est.)
23,232,413 (July 2017 est.)
21,262,641 (July 2009 – CIA World Factbook)
Population pyramid of Australia from 1950 to 2020 Population pyramid of Australia from 1950 to 2020.gif
Population pyramid of Australia from 1950 to 2020

Age structure

Australian babies: 0 year olds as a fraction of total persons, in Australia, according to the 2011 census results. Australian Census 2011 demographic map - Australia by SLA - BCP field 0259 Age years 0 Persons.svg
Australian babies: 0 year olds as a fraction of total persons, in Australia, according to the 2011 census results.
Australian babies: 0-4 year olds as a fraction of total persons, in Australia, according to the 2011 census results Australian Census 2011 demographic map - Australia by SLA - BCP field 0274 Age years 0 4 years Persons.svg
Australian babies: 0-4 year olds as a fraction of total persons, in Australia, according to the 2011 census results
0-14 years: 17.75% (male 2,138,080 /female 2,027,583)
15-24 years: 12.62% (male 1,520,528 /female 1,442,461)
25-54 years: 41.35% (male 4,944,587 /female 4,760,752)
55-64 years: 11.84% (male 1,379,681 /female 1,398,177)
65 years and over: 16.44% (male 1,786,595 /female 2,071,701) (2018 est.)
0–14 years: 17.8% (male 2,122,139/female 2,012,670)
15–24 years: 12.79% (male 1,524,368/female 1,446,663)
25–54 years: 41.45% (male 4,903,130/female 4,725,976)
55–64 years: 11.83% (male 1,363,331/female 1,384,036)
65 years and over: 16.14% (male 1,736,951/female 2,013,149) (2017 est.)

Median age

Map of the median age of Australians by Statistical Local Area in the 2011 census Australian Census 2011 demographic map - Australia by SLA - BCP field 0109 Median age of persons.svg
Map of the median age of Australians by Statistical Local Area in the 2011 census
total: 38.8 years. Country comparison to the world: 58th
male: 38.1 years
female: 39.7 years (2018 est.)
Total: 36.9 years [83]
Male: 36.6 years
Female: 38.1 years (2009 est.)

Birth rate

12 births/1,000 population (2018 est.) Country comparison to the world: 165th
12.1 births/1,000 population (2017 est.)
12.47 births/1,000 population (2009 est.) (Rank 164)

Death rate

7.3 deaths/1,000 population (2018 est.) Country comparison to the world: 118th
6.68 deaths/1,000 population (2009 est.) (Rank 146)

Total fertility rate

1.77 children born/woman (2018 est.) Country comparison to the world: 155th

Net migration rate

5.4 migrant(s)/1,000 population (2018 est.) Country comparison to the world: 22nd
5.5 migrant(s)/1,000 population (2017 est.) (Rank 21)
6.23 migrant(s)/1,000 population. (2009 est.) (Rank 15)

Population growth rate

1.01% (2018 est.) Country comparison to the world: 107th
1.03% (2017 est.)

Mother's mean age at first birth

28.7 years (2014 est.)

Life expectancy at birth

total population: 82.4 years (2018 estimate)
male: 79.9 years (2018 estimate)
female: 85 years (2018 estimate)

At the time of Australian Federation in 1901, the rate of natural increase was 14.9 persons per 1,000 population. The rate increased to a peak of 17.4 per thousand population in the years 1912, 1913 and 1914. During the Great Depression, the rate declined to a low of 7.1 per thousand population in 1934 and 1935. Immediately after World War II, the rate increased sharply as a result of the start of the post–World War II baby boom and the immigration of many young people who then had children in Australia. A rate plateau of over 13.0 persons per 1,000 population occurred for every year from 1946 to 1962.

There has been a fall in the rate of natural increase since 1962 due to falling fertility. In 1971, the rate of natural increase was 12.7 persons per 1,000 population; a decade later it had fallen to 8.5. In 1996 the rate of natural increase fell below seven for the first time, with the downward trend continuing in the late 1990s. Population projections by the Australian Bureau of Statistics indicate that continued low fertility, combined with the increase in deaths from an ageing population, will result in natural increase falling below zero sometime in the mid-2030s. However, in 2006 the fertility rate rose to 1.81, one of the highest rates in the OECD.

Since 1901, the crude death rate has fallen from about 12.2 deaths per 1,000 population, to 6.4 deaths per 1,000 population in 2006. [84]

Urbanisation

urban population: 86% of total population (2018)
rate of urbanization: 1.43% annual rate of change (2015-20 est.)
Urbanisation population: 89% of total population (2008)
Rate of urbanisation: 1.2% annual rate of change (2005–2010)

Sex ratio

Birth: 1.06 male(s)/female
Under 15 years: 1.05 male(s)/female
15–64 years: 1.03 male(s)/female
65 years and over: 0.84 male(s)/female
Total population: 1 male(s)/female (2009)

Dependency ratios

total dependency ratio: 51.1
youth dependency ratio: 28.5
elderly dependency ratio: 22.6
potential support ratio: 4.4 (2015 est.)

HIV/AIDS

Adult prevalence rate: 0.1% (2017 est.)
People living with HIV/AIDS: 26,000 (2017 est.)
Deaths: fewer than 200 (2017 est.) [85]

School life expectancy (primary to tertiary education)

total: 23 years
male: 23 years
female: 23 years (2016)

Unemployment, youth ages 15-24

total: 12.6%. Country comparison to the world: 105th
male: 13.7%
female: 11.5% (2017 est.)

Incarceration and punishment

In March 2019, there were 43,320 adults imprisoned in Australia, which was an incarceration rate of 221 prisoners per 100,000 adult population., [86] or 169 per 100,000 total population. [87] Additionally, there was 75,544 people in community corrections (various non-custodial punishments such as parole, bail, probation and community service). [88]

In June 2018, there was about 980 minors imprisoned in Australia on an average night. [89]

Literacy

Definition: aged 15 years and over can read and write
Total population: 99%
Male: 99%
Female: 99% (2003 est.)

As of 2016, Indian Australians were the highest educated migrant group in Australia with 54.6% of Indians in Australia having a bachelor's or higher degree, more than three times Australia's national average of 17.2% in 2011. [90]

Education expenditure

4.9% of GDP (2013)
country comparison to the world: 55

Population density

As of June 2016, the population density of Australia was reported as 3.1/km2 (8.0/sq mi). [91] This makes Australia the 3rd least densely populated country in the world, after Namibia and Mongolia. [92]

See also

Notes

  1. In fertility rates, 2.1 and above is a stable population and has been marked blue, 2 and below leads to an aging population and the result is that the population decreases.
  1. Includes those who nominate “Australian” as their ancestry. The Australian Bureau of Statistics has stated that most who nominate "Australian" as their ancestry have at least partial Anglo-Celtic European ancestry. [17]
  2. The Australian Bureau of Statistics has stated that most who nominate "Australian" as their ancestry have at least partial Anglo-Celtic ancestry. [17]
  3. Those who nominated their ancestry as "Australian Aboriginal". Does not include Torres Strait Islanders. This relates to nomination of ancestry and is distinct from persons who identify as Indigenous (Aboriginal or Torres Strait Islander) which is a separate question.
  4. Indigenous identification is separate to the ancestry question on the Australian Census and persons identifying as Aboriginal or Torres Strait Islander may identify any ancestry.

Related Research Articles

Demographics of American Samoa Demographics of the territory

This article is about the demographics of American Samoa, including population density, ethnicity, education level, health of the populace, economic status, religious affiliations and other aspects of the population. American Samoa is an unincorporated territory of the United States located in the South Pacific Ocean.

Demographics of Canada

Statistics Canada conducts a country-wide census that collects demographic data every five years on the first and sixth year of each decade. The 2021 Canadian Census enumerated a total population of 36,991,981, an increase of around 5.2 percent over the 2016 figure. Between 2011 and May 2016, Canada's population grew by 1.7 million people, with immigrants accounting for two-thirds of the increase. Between 1990 and 2008, the population increased by 5.6 million, equivalent to 20.4 percent overall growth. The main driver of population growth is immigration and, to a lesser extent, natural growth.

Demographics of Cambodia Population analysis

This is a demography of the population of Cambodia including population density, ethnicity, education level, health of the populace, economic status, religious affiliations and other aspects of the population.

Demographics of Costa Rica

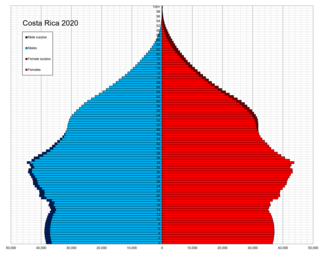
This is a demography of the population of Costa Rica including population density, ethnicity, education level, health of the populace, economic status, religious affiliations and other aspects of the population.

This article is about the demographic features of the population of the Cook Islands, including population density, ethnicity, education level, health of the populace, economic status, religious affiliations and other aspects of the population.

Demographics of the Dominican Republic

This is a demography of the population of the Dominican Republic including population density, ethnicity, education level, health of the populace, economic status, religious affiliations and other aspects of the population.

Demographics of Guatemala

This is a demography of the population of Guatemala including population density, ethnicity, education level, health of the populace, economic status, religious affiliations and other aspects of the population.

Demographics of Nepal

The current population of Nepal is 29,192,480 as per the 2021 census. The population growth rate is 0.93% per year. In the 2011 census, Nepal's population was approximately 26 million people with a population growth rate of 1.35% and a median age of 21.6 years. In 2016, the female median age was approximately 25 years old and the male median age was approximately 22 years old. Only 4.4% of the population is estimated to be more than 65 years old, comprising 681,252 females and 597,628 males. 61% of the population is between 15 and 64 years old, and 34.6% is younger than 14 years. In 2011, the birth rate is estimated to be 22.17 births per 1,000 people with an infant mortality rate of 46 deaths per 1,000 live births. Compared to the infant mortality rate in 2006 of 48 deaths per 1000 live births, the 2011 IMR is a slight decrease within that 5-year period. Infant mortality rate in Nepal is higher in rural regions at 44 deaths per 1000 live births, whereas in urban regions the IMR is lower at 40 deaths per 1000 live births. This difference is due to a lack of delivery assistance services in rural communities compared to their urban counterparts who have better access to hospitals and neonatal clinics. Life expectancy at birth is estimated to be 67.44 years for females and 64.94 years for males. The mortality rate is estimated to be 681 deaths per 100,000 people. Net migration rate is estimated to be 61 migrants per 100,000 people. According to the 2011 census, 65.9% of the total population is literate.

Demographics of Paraguay Demographic overview

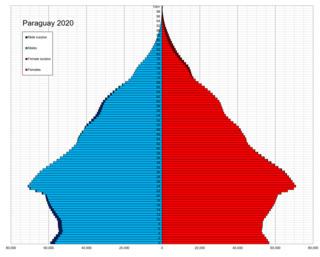
This is a demography of the population of Paraguay including population density, ethnicity, education level, health of the populace, economic status, religious affiliations and other aspects of the population.

Demographics of Venezuela

The Demographics of Venezuela are the condition and overview of Venezuela's peoples. Demographic topics include basic education, health, and population statistics as well as identified racial and religious affiliations

Demographics of Fiji

The demographic characteristics of the population of Fiji are known through censuses, usually conducted in ten-year intervals, and has been analysed by statistical bureaus since the 1880s. The Fijian Bureau of Statistics (FBOS) has performed this task since 1996, the first enumerated Fiji census when an independent country. The 2017 census found that the permanent population of Fiji was 884,887, compared to 837,271 in the 2007 census. The population density at the time in 2007 was 45.8 inhabitants per square kilometre, and the overall life expectancy in Fiji was 67 years. Since the 1930s the population of Fiji has increased at a rate of 1.1% per year. Since the 1950s, Fiji's birth rate has continuously exceeded its death rate. The population is dominated by the 15–64 age segment. The median age of the population was 27.9, and the gender ratio of the total population was 1.03 males per 1 female.

Demographics of South Africa

The population of South Africa is about 58.8 million people of diverse origins, cultures, languages, and religions. The South African National Census of 2011 was the most recent census held; the next will be in 2022.

Demographics of Argentina

This is a demography of Argentina including population density, ethnicity, economic status and other aspects of the population.

Census in Australia National census of Australia, held every five years

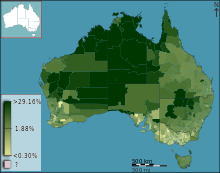
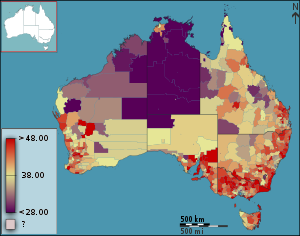
The Census in Australia, officially the Census of Population and Housing, is the national census in Australia that occurs every five years. The census collects key demographic, social and economic data from all people in Australia on census night, including overseas visitors and residents of Australian external territories, only excluding foreign diplomats. The census is the largest and most significant statistical event in Australia and is run by the Australian Bureau of Statistics (ABS). Every person must complete the census, although some personal questions are not compulsory. The penalty for failing to complete the census after being directed to by the Australian Statistician is one federal penalty unit, or A$220. The Australian Bureau of Statistics Act 1975 and Census and Statistics Act 1905 authorise the ABS to collect, store, and share anonymised data.

Demographics of Sydney

Sydney is Australia's most populous city, and is also the most populous city in Oceania. In the 2021 census, 5,231,147 persons declared themselves as residents of the Sydney Statistical Division–about one-fifth (20.58%) of Australia's total population. With a population density of 2037 people per square kilometre, the urban core has population density five times that of the greater region.

Australians Citizens of Australia

Australians, colloquially known as Aussies, are the citizens, nationals and individuals associated with the country of Australia. This connection may be residential, legal, historical or ethno-cultural. For most Australians, several of these connections exist and are collectively the source of their being Australian. Australian law does not provide for a racial or ethnic component of nationality, instead relying on citizenship as a legal status.

Canberra is Australia's capital and its largest inland city. At the 2016 census, it had 395,790 residents. This amounted to only 1.7% of Australia's population. The population density for Canberra is 443.5 people per sq kilometre.

Brisbane is the capital of and most populous city in the Australian state of Queensland, and the third most populous city in Australia. The Australian Bureau of Statistics estimates that the population of Greater Brisbane is 2,462,637 as of June 2018, and the South East Queensland region, centred on Brisbane, encompasses a population of more than 3.6 million. The Brisbane central business district stands on the original European settlement and is situated inside a bend of the Brisbane River, about 15 kilometres from its mouth at Moreton Bay. The metropolitan area extends in all directions along the floodplain of the Brisbane River Valley between Moreton Bay and the Great Dividing Range, sprawling across several of Australia's most populous local government areas (LGAs), most centrally the City of Brisbane, which is by far the most populous LGA in the nation. The demonym of Brisbane is Brisbanite. Brisbane will be the host of the 2032 Olympics

Section 127 of the Constitution of Australia was the final section within Chapter VII of the Australian Constitution, and excluded Indigenous Australians from population counts for constitutional purposes. It came into effect on 1 January 1901 when the founding states federated into the Commonwealth of Australia, and was repealed effective 10 August 1967 following the 1967 referendum.

The 2016 Australian census was the seventeenth national population census held in Australia. The census was officially conducted with effect on Tuesday, 9 August 2016. The total population of the Commonwealth of Australia was counted as 23,401,892 – an increase of 8.8 per cent or 1,894,175 people over the 2011 census. Norfolk Island joined the census for the first time in 2016, adding 1,748 to the population.

References

Citations

  1. 1 2 3 "Population clock". Australian Bureau of Statistics website. Commonwealth of Australia. Retrieved 23 July 2020. The population estimate shown is automatically calculated daily at 00:00 UTC and is based on data obtained from the population clock on the date shown in the citation.
  2. "Population Figures for all Countries of the World (latest) - Nations Online Project".
  3. Xinhua (14 December 2010). "Australia's population to hit 28 million by 2031: report". People's Daily Online. Archived from the original on 3 June 2012. Retrieved 24 April 2013.
  4. Phillips, Janet; Simon-Davies, Joanne. "Migration—Australian migration flows and population". Australian Parliamentary Library. Retrieved 21 April 2019.
  5. "Data – Australia". The World Bank. The World Bank Group. 2013. Retrieved 24 April 2013.
  6. "3302.0.55.001 – Life Tables, States, Territories and Australia, 2015–2017". Australian Bureau of Statistics. Retrieved 21 April 2019.
  7. "The Beach". Australian Government: Culture Portal. Department of the Environment, Water, Heritage and the Arts, Commonwealth of Australia. 17 March 2008. Archived from the original on 26 February 2010.
  8. "3218.0 - Regional Population Growth, Australia, 2018-19". Australian Bureau of Statistics .{{cite web}}: CS1 maint: url-status (link)
  9. Weule, Genelle; Felicity James (20 July 2017). "Indigenous rock shelter in Top End pushes Australia's human history back to 65,000 years". Nature. Abc.net.au. 547 (7663): 306–310. doi:10.1038/nature22968. hdl: 2440/107043 . PMID   28726833. S2CID   205257212 . Retrieved 27 September 2017.
  10. 1 2 "When did Australia's earliest inhabitants arrive?". University of Wollongong. 17 September 2004. Archived from the original on 21 June 2009. Retrieved 3 January 2009.
  11. 1 2 "Aboriginal and Torres Strait Islander Population". 1301.0 – Year Book Australia, 2008. Australian Bureau of Statistics. 7 February 2008. Retrieved 3 January 2009.
  12. "The Evolution of Australia's Multicultural Policy". Department of Immigration and Multicultural and Indigenous Affairs. 2005. Archived from the original on 19 February 2006. Retrieved 18 September 2007.
  13. https://www.homeaffairs.gov.au/research-and-stats/files/report-migration-program-2018-19.pdf [ bare URL PDF ]
  14. "Understanding and using Ancestry data | Australian Bureau of Statistics". 28 June 2022.
  15. "Australian Standard Classification of Cultural and Ethnic Groups (ASCCEG), 2019 | Australian Bureau of Statistics". 18 December 2019.
  16. https://www.abs.gov.au/statistics/people/people-and-communities/cultural-diversity-census/2021/Cultural%20diversity%20data%20summary.xlsx [ bare URL spreadsheet file ]
  17. 1 2 "Feature Article – Ethnic and Cultural Diversity in Australia (Feature Article)". 1301.0 – Year Book Australia, 1995. Commonwealth of Australia. Australian Bureau of Statistics.
  18. "2021 Census Community Profiles: Australia".
  19. "2021 Australia, Census All persons QuickStats | Australian Bureau of Statistics".
  20. "Births, Australia". 12 August 2021. Retrieved 3 January 2022.
  21. 1 2 "Table 5.1 Estimated resident population, by country of birth(a), Australia, as at 30 June, 1996 to 2019(b)(c)". Australian Bureau of Statistics. Retrieved 4 May 2020.
  22. "3105.0.65.001—Australian Historical Population Statistics, 2006" (XLS). Australian Bureau of Statistics. 23 May 2006. Archived from the original on 8 September 2007. Retrieved 18 September 2007. Australian population: (1919) 5,080,912; (2006) 20,209,993
  23. United Nations, Department of Economic and Social Affairs, Population Division, (2015). 'International Migration' in International migrant stock 2015. Accessed from International migrant stock 2015: maps on 24 May 2017
  24. 1 2 "Fact Sheet 20 – Migration Program Planning Levels". Department of Immigration and Citizenship. 11 August 2009. Archived from the original on 7 May 2010. Retrieved 17 June 2010.
  25. "Table 5.1 Estimated resident population, by country of birth(a), Australia, as at 30 June, 1996 to 2021(b)(c)". Australian Bureau of Statistics. Retrieved 26 April 2022.
  26. "Australian Bureau of Statistics : 2021 Census of Population and Housing : General Community Profile" (XLSX). Abs.gov.au. Retrieved 2 July 2022.
  27. "2021 Census Community Profiles: Australia".
  28. "2001 Australia, Census All persons QuickStats | Australian Bureau of Statistics".
  29. "2021 Census Community Profiles: Australia".
  30. "2021 Census Community Profiles: Australia".
  31. Pettersson, Thorleif; Esmer, Yilmaz R. (2008). Changing Values, Persisting Cultures: Case Studies in Value Change. Brill. p. 21. ISBN   978-9004162341.
  32. Australian Political Facts. Longman Chesire. 1990. p. 122. ISBN   9780582712584.
  33. Australian Bureau of Statistics, "Special Feature: Trends in religious affiliation", 4102.0 - Australian Social Trends, 1994
  34. "Religion in Australia, 2016". Australian Bureau of Statistics. 28 June 2017. Retrieved 31 January 2018.
  35. "NCLS releases latest estimates of church attendance" (Media release). NCLS Research. NCLS Research. 28 February 2012. Retrieved 24 April 2013.
  36. "Pluralist Nations: Pluralist Language Policies?". 1995 Global Cultural Diversity Conference Proceedings, Sydney. Department of Immigration and Citizenship. Archived from the original on 20 December 2008. Retrieved 11 January 2009. English has no de jure status but it is so entrenched as the common language that it is de facto the official language as well as the national language.
  37. Moore, Bruce. "The Vocabulary Of Australian English" (PDF). National Museum of Australia. Archived from the original (PDF) on 20 March 2011. Retrieved 5 April 2010.
  38. "The Macquarie Dictionary", Fourth Edition. The Macquarie Library Pty Ltd, 2005.
  39. "2021 Australia, Census All persons QuickStats | Australian Bureau of Statistics".
  40. "A mission to save indigenous languages". Australian Geographic. 19 August 2011. Archived from the original on 24 December 2013. Retrieved 18 March 2016.
  41. 1 2 "National Indigenous Languages Survey Report 2005". Department of Communications, Information Technology and the Arts. Archived from the original (PDF) on 9 July 2009. Retrieved 5 September 2009.
  42. "4713.0 – Population Characteristics, Aboriginal and Torres Strait Islander Australians, 2006". Australian Bureau of Statistics. Canberra: Australian Bureau of Statistics. 4 May 2010. Retrieved 7 December 2010.
  43. Australian Bureau of Statistics (27 June 2007). "20680-Language Spoken at Home (full classification list) by Sex – Australia". 2006 Census Tables : Australia. Canberra: Australian Bureau of Statistics. Archived from the original on 3 July 2009. Retrieved 7 December 2010.
  44. Australian Bureau of Statistics (31 October 2012). "2011 Community Profiles: Aboriginal and Torres Strait Islander Peoples (Indigenous) Profile". 2011 Census of Population and Housing. Retrieved 9 October 2013. OOjs UI icon edit-ltr-progressive.svg
  45. "National, state and territory population, September 2020 | Australian Bureau of Statistics". 18 March 2021.
  46. Australian Bureau of Statistics (27 June 2017). "New South Wales". 2016 Census QuickStats. Retrieved 2 July 2017. OOjs UI icon edit-ltr-progressive.svg
  47. Australian Bureau of Statistics (27 June 2017). "Victoria". 2016 Census QuickStats. Retrieved 2 July 2017. OOjs UI icon edit-ltr-progressive.svg
  48. Australian Bureau of Statistics (27 June 2017). "Queensland". 2016 Census QuickStats. Retrieved 2 July 2017. OOjs UI icon edit-ltr-progressive.svg
  49. Australian Bureau of Statistics (31 October 2012). "Western Australia". 2011 Census QuickStats. Retrieved 12 February 2013. OOjs UI icon edit-ltr-progressive.svg
  50. Australian Bureau of Statistics (27 June 2017). "South Australia". 2016 Census QuickStats. Retrieved 2 July 2017. OOjs UI icon edit-ltr-progressive.svg
  51. Australian Bureau of Statistics (27 June 2017). "Tasmania". 2016 Census QuickStats. Retrieved 2 July 2017. OOjs UI icon edit-ltr-progressive.svg
  52. Australian Bureau of Statistics (27 June 2017). "Australian Capital Territory". 2016 Census QuickStats. Retrieved 2 July 2017. OOjs UI icon edit-ltr-progressive.svg
  53. Australian Bureau of Statistics (27 June 2017). "Northern Territory". 2016 Census QuickStats. Retrieved 2 July 2017. OOjs UI icon edit-ltr-progressive.svg
  54. "Aboriginal and Torres Strait Islander population". 1301.0 – Year Book Australia, 2002. Australian Bureau of Statistics. 20 August 2007. Retrieved 21 October 2009.
  55. Briscoe, Gordon; Smith, Len (2002). The Aboriginal Population Revisited: 70,000 years to the present. Canberra, Australia: Aboriginal History Inc. p. 12. ISBN   978-0-9585637-6-5.
  56. "TABLE 1.1. Population by sex, states and territories, 31 December 1788 onwards". 23 May 2014. Retrieved 8 July 2019.
  57. "TABLE 1.2. Population by sex, states and territories, 30 June 1901 onwards". Australian Bureau of Statistics. 23 May 2014. Retrieved 8 July 2019.
  58. Australian Bureau of Statistics (9 March 2006). "Australia". 2001 Census QuickStats. Retrieved 24 January 2016.
  59. Australian Bureau of Statistics (25 October 2007). "Australia". 2006 Census QuickStats. Retrieved 24 January 2016.
  60. Australian Bureau of Statistics (31 October 2012). "Australia". 2011 Census QuickStats. Retrieved 24 January 2016. OOjs UI icon edit-ltr-progressive.svg
  61. Australian Bureau of Statistics (27 June 2017). "Australia". 2016 Census QuickStats. Retrieved 13 July 2017. OOjs UI icon edit-ltr-progressive.svg
  62. 1 2 3 Max Roser (2014), "Total Fertility Rate around the world over the last centuries", Our World In Data, Gapminder Foundation
  63. 1 2 Australian Bureau of Statistics (23 May 2006). "3105.0.65.001 - Australian Historical Population Statistics, 2006.Table 42. Crude birth rates, states and territories, 1860 onwards".
  64. Australian Bureau of Statistics (5 August 2008). "3105.0.65.001 - Australian Historical Population Statistics, 2008 - 4. Population Age-Sex Structure - 4.1 Population, age and sex, Australia 30 June, 1901 onwards".
  65. 1 2 Australian Bureau of Statistics (6 April 2006). "Population Characteristics: 20th century: beginning and end".
  66. 1 2 Australian Bureau of Statistics (15 February 2016). "3101.0 - Australian Demographic Statistics, Jun 2015".
  67. .idcommunity. "Australia. Five year age groups".
  68. Australian Bureau of Statistics (15 March 2006). "4102.0 - Australian Social Trends, 1996".
  69. Australian Bureau of Statistics (5 August 2008). "3105.0.65.001 - Australian Historical Population Statistics, 2008. 4. Population Age-Sex Structure - 4.18. Median age by sex, states and territories, 30 June, 1971 onwards".
  70. "Developed countries database". ined.fr. Retrieved 10 July 2012.
  71. "Historical Migration Statistics". 25 July 2014. Archived from the original on 9 August 2014. Retrieved 27 July 2014.
  72. "3101.0 - Australian Demographic Statistics, Mar 2017". Abs.gov.au. Retrieved 27 September 2017.
  73. 1 2 "World Factbook EUROPE : AUSTRALIA", The World Factbook , 12 July 2018
  74. "Population". Australian Bureau of Statistics. Retrieved 13 December 2017.
  75. "3101.0 - Australian Demographic Statistics, Dec 2017", Australian Bureau of Statistics, 16 September 2021
  76. "3101.0 - Australian Demographic Statistics, Dec 2018", Australian Bureau of Statistics, December 2018
  77. "3302.0 - Deaths, 2018", Australian Bureau of Statistics, December 2018
  78. "3301.0 Births, Australia, 2012" (XL file). Australian Bureau of Statistics. 11 July 2014. Retrieved 19 December 2014.
  79. "3301.0 Births, Australia, 2013" (XL file). Australian Bureau of Statistics. 23 October 2014. Retrieved 19 December 2014.
  80. "Life expectancy". Our World in Data. Retrieved 28 August 2018.
  81. "World Population Prospects – Population Division – United Nations". United Nations, Population Division. 2019. Retrieved 10 July 2019.
  82. "3101.0 – Australian Demographic Statistics, Dec 2017". Australian Bureau of Statistics. 21 June 2016. Retrieved 22 July 2018.
  83. "3201.0 – Population by Age and Sex, Australian States and Territories, Jun 2010". Australian Bureau of Statistics. 21 December 2010. Retrieved 5 June 2016.
  84. "Population Size and Growth". 1301.0 – Year Book Australia, 2008. Australian Bureau of Statistics. 7 February 2008. Retrieved 3 January 2009.
  85. "AUSTRALIA-OCEANIA :: AUSTRALIA". CIA – The World Factbook. Central Intelligence Agency. 2 July 2019. Retrieved 8 July 2019.
  86. "4512.0 - Corrective Services, Australia, March quarter 2019". www.abs.gov.au. Australian Bureau of Statistics. Retrieved 8 July 2019.
  87. "Highest to Lowest - Prison Incarceration Rate". World Prison Brief. Retrieved 8 July 2019.
  88. "4512.0 - Corrective Services, Australia, March quarter 2019 - Summary of findings". www.abs.gov.au. Australian Bureau of Statistics. Retrieved 8 July 2019.
  89. Youth detention population in Australia 2018. www.aihw.gov.au (Report). Australian Institute of Health and Welfare. 19 December 2018. p. 24. ISBN   978-1-76054-470-6. ISSN   2205-5010 . Retrieved 8 July 2019.
  90. "Indians found to be Australia's most highly educated migrants - Interstaff Migration". 19 August 2016.
  91. "3218.0 – Regional Population Growth, Australia, 2016". Australian Bureau of Statistics. Retrieved 21 April 2019.
  92. "Population density (people per sq. km of land area)". World Bank Open Data. The World Bank. Retrieved 21 April 2019.

Sources

General references

Further reading