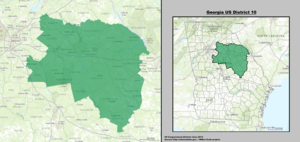
Name Party Years Cong Electoral history District location District created March 4, 1885 George Barnes (Augusta ) Democratic March 4, 1885 – 49th 50th 51st Elected in 1884 .Re-elected in 1886 .Re-elected in 1888 .[ data missing ] 1885–1893 Burke , Columbia , Glascock , Jefferson , Johnson , Lincoln , McDuffie , Richmond , Taliaferro , Warren , and Washington . Thomas E. Watson (Thomson ) Populist March 4, 1891 – 52nd Elected in 1890 . James C. C. Black (Augusta ) Democratic March 4, 1893 – 53rd Elected in 1892 .contested election . 1893–1909 [ data missing ] Vacant March 4, 1895 – 54th James C. C. Black (Augusta ) Democratic October 2, 1895 – 54th Elected to finish his own term . William Henry Fleming (Augusta ) Democratic March 4, 1897 – 55th 56th 57th Elected in 1896 .Re-elected in 1898 .Re-elected in 1900 . Thomas W. Hardwick (Sandersville ) Democratic March 4, 1903 – 58th 59th 60th 61st 62nd 63rd Elected in 1902 .Re-elected in 1904 .Re-elected in 1906 .Re-elected in 1908 .Re-elected in 1910 .Re-elected in 1912 .elected U.S. senator . 1909–1913 [ data missing ] 1913–1917 [ data missing ] Vacant November 2, 1914 – 63rd Carl Vinson (Milledgeville ) Democratic November 3, 1914 – 63rd 64th 65th 66th 67th 68th 69th 70th 71st 72nd Elected to finish Hardwick's term .Re-elected in 1914 .Re-elected in 1916 .Re-elected in 1918 .Re-elected in 1920 .Re-elected in 1922 .Re-elected in 1924 .Re-elected in 1926 .Re-elected in 1928 .Re-elected in 1930 .Redistricted to the 6th district . 1917–1927 [ data missing ] 1927–1933 [ data missing ] Charles Hillyer Brand (Athens ) Democratic March 4, 1933 – 73rd Elected in 1932 . 1933–1965 [ data missing ] Vacant May 17, 1933 – 73rd Paul Brown (Elberton ) Democratic July 5, 1933 – 73rd 74th 75th 76th 77th 78th 79th 80th 81st 82nd 83rd 84th 85th 86th Elected to finish Brand's term .Re-elected in 1934 .Re-elected in 1936 .Re-elected in 1938 .Re-elected in 1940 .Re-elected in 1942 .Re-elected in 1944 .Re-elected in 1946 .Re-elected in 1948 .Re-elected in 1950 .Re-elected in 1952 .Re-elected in 1954 .Re-elected in 1956 .Re-elected in 1958 . Robert Grier Stephens Jr. (Athens ) Democratic January 3, 1961 – 87th 88th 89th 90th 91st 92nd 93rd 94th Elected in 1960 .Re-elected in 1962 .Re-elected in 1964 .Re-elected in 1966 .Re-elected in 1968 .Re-elected in 1970 .Re-elected in 1972 .Re-elected in 1974 . 1965–1973 Baldwin , Clarke , Columbia , Glascock , Greene , Hancock , Jasper , Jefferson , Lincoln , McDuffie , Morgan , Newton , Oconee , Oglethorpe , Putnam , Richmond , Taliaferro , Walton , Warren , Washington , and Wilkes .1973–1983 [ data missing ] Doug Barnard Jr. (Augusta ) Democratic January 3, 1977 – 95th 96th 97th 98th 99th 100th 101st 102nd Elected in 1976 .Re-elected in 1978 .Re-elected in 1980 .Re-elected in 1982 .Re-elected in 1984 .Re-elected in 1986 .Re-elected in 1988 .Re-elected in 1990 . 1983–1993 Barrow , Clarke , Columbia , Elbert , Lincoln , Madison , McDuffie , Morgan , Oconee , Oglethorpe , Richmond , Walton , Warren , and Wilkes ; part of Gwinnett . Don Johnson Jr. (Royston ) Democratic January 3, 1993 – 103rd Elected in 1992 . 1993–1997 Banks , Barrow , Clarke , Columbia , Elbert , Franklin , Hart , Jackson , Lincoln , Madison , McDuffie , Morgan , Newton , Oconee , Oglethorpe , and Walton ; parts of Gwinnett , Richmond , and Wilkes . Charlie Norwood (Evans ) Republican January 3, 1995 – 104th 105th 106th 107th Elected in 1994 .Re-elected in 1996 .Re-elected in 1998 .Re-elected in 2000 .Redistricted to the 9th district . 1997–2003 Baldwin , Burke , Butts , Columbia , Elbert , Emanuel , Glascock , Greene , Hancock , Jasper , Jefferson , Johnson , Jones , Laurens , Lincoln , McDuffie , Oglethorpe , Putnam , Richmond , Taliaferro , Warren , Washington , Wilkes , and Wilkinson . Nathan Deal (Clermont ) Republican January 3, 2003 – 108th 109th Redistricted from the 9th district and re-elected in 2002 .Re-elected in 2004 .Redistricted to the 9th district . 2003–2007 Catoosa , Dade , Dawson , Fannin , Gilmer , Gordon , Hall , Murray , Pickens , Walker , and Whitfield ; parts of Forsyth , Gwinnett , Rockdale , and Walton . Charlie Norwood (Evans ) Republican January 3, 2007 – 110th Redistricted from the 9th district and re-elected in 2006 . 2007–2013 Banks , Clarke , Columbia , Elbert , Franklin , Greene , Habersham , Hart , Jackson , Lincoln , Madison , McDuffie , Morgan , Oconee , Oglethorpe , Putnam , Rabun , Stephens , Towns , and Wilkes ; part of Richmond .Vacant February 13, 2007 – 110th Paul Broun (Athens ) Republican July 17, 2007 – 110th 111th 112th 113th Elected to finish Norwood's term .Re-elected in 2008 .Re-elected in 2010 .Re-elected in 2012 .run for U.S. senator . 2013–2023 Baldwin , Barrow , Butts , Glascock , Greene , Hancock , Jasper , Jefferson , Johnson , Lincoln , McDuffie , Morgan , Oconee , Oglethorpe , Putnam , Taliaferro , Walton , Warren , Washington , and Wilkes ; parts of Clarke , Columbia , Gwinnett , Henry , and Newton . Jody Hice (Greensboro ) Republican January 3, 2015 – 114th 115th 116th 117th Elected in 2014 .Re-elected in 2016 .Re-elected in 2018 .Re-elected in 2020 .run for Georgia Secretary of State . Mike Collins (Jackson ) Republican January 3, 2023 – 118th 119th Elected in 2022 .Re-elected in 2024 .U.S Senate . 2023–2025
2025–present 


