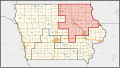
Iowa's 2nd congressional district | |||
---|---|---|---|
Representative |
| ||
Distribution |
| ||
Population (2022) | 793,421 | ||
Median household income | $67,862 [1] | ||
Ethnicity |
| ||
Cook PVI | R+4 [2] |
Iowa's 2nd congressional district is a congressional district in the U.S. state of Iowa that covers most of its northeastern part. It includes Cedar Rapids, Dubuque, Waterloo, and Grinnell.
The district is represented by Republican Ashley Hinson.
Election results from statewide races:
Office | Year | District result | Winner | |
---|---|---|---|---|
Statewide | Nationwide | |||
President | 2000 | Al Gore 53% – George W. Bush 43% | Gore | Bush |
2004 | John Kerry 55% – George W. Bush 44% | Bush | ||
2008 | Barack Obama 60% – John McCain 38% | Obama | Obama | |
2012 | Barack Obama 56% – Mitt Romney 43% | |||
2016 | Donald Trump 49% – Hillary Clinton 44% | Trump | Trump | |
2020 | Donald Trump 51% – Joe Biden 47% | Biden | ||
U.S. Senator | 2014 | Joni Ernst 49% – Bruce Braley 47% | Ernst | n/a |
2016 | Chuck Grassley 56.2% – Patty Judge 39.4% | Grassley | ||
2020 | Joni Ernst 49.2% – Theresa Greenfield 47.7% | Ernst | ||
2022 | Chuck Grassley 54.6% – Michael Franken 45.3% | Grassley | ||
Governor | 2014 | Terry Branstad 57% – Jack Hatch 40% | Branstad | |
2018 | Fred Hubbell 50.7% – Kim Reynolds 47.3% | Reynolds |
Year | Winner | Loser | Percentage | ||||
---|---|---|---|---|---|---|---|
Party affiliation | Candidate | Votes | Party affiliation | Candidate | Votes | ||
1920 | Republican | Harry E. Hull | 50,160 | Farmer–Labor | F. B. Althouse | 6,058 | 89% – 11% |
1922 | 27,450 | Democratic | Wayne G. Cook | 25,620 | 51% – 48% | ||
1924 | Fred Dickinson Letts | 49,117 | Ralph U. Thompson | 32,893 | 60% – 40% | ||
1926 | 29,200 | J. P. Gallagher | 19,612 | 60% – 40% | |||
1928 | 49,690 | Frank Z. Titzell | 37,344 | 57% – 43% | |||
1930 | Democratic | Bernhard M. Jacobsen | 30,008 | Republican | F. D. Letts | 24,113 | 55% – 45% |
1932 | 71,914 | Frank W. Elliott | 50,636 | 59% – 41% | |||
1934 | 60,654 | Martin B. Andelfinger | 39,047 | 63% – 35% | |||
1936 | William S. Jacobsen | 70,923 | Charles Penningroth | 55,255 | 53% – 41% | ||
1938 | 48,155 | Alfred C. Mueller | 47,535 | 50% – 49% | |||
1940 | 75,774 | W. A. McCullough | 69,298 | 52% – 48% | |||
1942 | Republican | Henry O. Talle | 62,290 | Democratic | William S. Jacobsen | 46,310 | 57% – 43% |
1944 | 86,903 | George C. Classen | 68,489 | 56% – 44% | |||
1946 | 60,111 | Richard V. Bernhart | 41,544 | 59% – 41% | |||
1948 | 82,139 | T. W. Mullaney | 60,272 | 57% – 42% | |||
1950 | 79,066 | Eugene J. Kean | 55,359 | 59% – 41% | |||
1952 | 114,553 | T. W. Mullaney | 69,421 | 62% – 38% | |||
1954 | 72,231 | Ruben V. Austin | 58,092 | 55% – 46% | |||
1956 | 95,999 | Leonard G. Wolf | 90,843 | 51% – 49% | |||
1958 | Democratic | Leonard G. Wolf | 67,022 | Republican | Henry O. Talle | 64,073 | 51% – 49% |
1960 | Republican | James E. Bromwell | 108,137 | Democratic | Leonard G. Wolf | 97,608 | 53% – 47% |
1962 | 67,475 | Frank W. Less | 60,296 | 53% – 47% | |||
1964 | Democratic | John C. Culver | 97,470 | Republican | James E. Bromwell | 89,299 | 52% – 48% |
1966 | 76,281 | Robert M. L. Johnson | 65,079 | 54% – 46% | |||
1968 | 103,651 | Tom Riley | 84,634 | 55% – 45% | |||
1970 | 84,049 | Cole McMartin | 54,934 | 60% – 40% | |||
1972 | 115,489 | Theodore R. Ellsworth | 79,667 | 59% – 41% | |||
1974 | Michael T. Blouin | 73,416 | Tom Riley | 69,088 | 51% – 48% | ||
1976 | 102,980 | 100,344 | 50% – 49% | ||||
1978 | Republican | Thomas J. Tauke | 72,644 | Democratic | Michael T. Blouin | 65,450 | 52% – 47% |
1980 | 111,587 | Steve Sovern | 93,175 | 54% – 45% | |||
1982 | 99,478 | Brent Appel | 69,539 | 59% – 41% | |||
1984 | 136,839 | Joe Welsh | 77,335 | 64% – 36% | |||
1986 | 88,708 | Eric Tabor | 55,903 | 61% – 39% | |||
1988 | 113,543 | 86,438 | 58% – 43% | ||||
1990 | Jim Nussle | 82,650 | 81,008 | 50% – 49% | |||
1992 | 134,536 | David R. Nagle | 131,570 | 50% – 49% | |||
1994 | 111,076 | 86,087 | 56% – 43% | ||||
1996 | 127,827 | Donna L. Smith | 109,731 | 53% – 46% | |||
1998 | 104,613 | Rob Tully | 83,405 | 55% – 44% | |||
2000 | 139,906 | Donna L. Smith | 110,327 | 55% – 44% | |||
2002 | Jim Leach | 108,130 | Julie Thomas | 94,767 | 52% – 46% | ||
2004 | 176,684 | Dave Franker | 117,405 | 59% – 39% | |||
2006 | Democratic | Dave Loebsack | 107,097 | Republican | Jim Leach | 101,386 | 51% – 49% |
2008 | 173,639 | Mariannette Miller-Meeks | 118,040 | 57% – 38% | |||
2010 | 115,839 | 104,319 | 50% – 45% | ||||
2012 | 211,863 | John Archer | 161,977 | 55% – 42% | |||
2014 | 143,431 | Mariannette Miller-Meeks | 129,455 | 52% – 47% | |||
2016 | 198,571 | Christopher Peters | 170,933 | 53% – 46% | |||
2018 | 171,120 | 133,051 | 54% – 42% | ||||
2020 | Republican | Mariannette Miller-Meeks | 196,864 | Democratic | Rita Hart | 196,858 | 49.910% – 49.908% |
Party | Candidate | Votes | % | |
---|---|---|---|---|
Republican | Jim Leach | 108,130 | 52.19% | |
Democratic | Julie Thomas | 94,767 | 45.74% | |
Libertarian | Kevin Litten | 4,178 | 2.02% | |
No party | Others | 96 | 0.05% | |
Total votes | 207,171 | 100.00% | ||
Republican hold | ||||
Party | Candidate | Votes | % | |
---|---|---|---|---|
Republican | Jim Leach (incumbent) | 176,684 | 58.92% | |
Democratic | Dave Franker | 117,405 | 39.15% | |
Libertarian | Kevin Litten | 5,586 | 1.86% | |
No party | Others | 206 | 0.07% | |
Total votes | 299,881 | 100.00% | ||
Republican hold | ||||
Party | Candidate | Votes | % | |||
---|---|---|---|---|---|---|
Democratic | Dave Loebsack | 107,683 | 51.38% | |||
Republican | Jim Leach (incumbent) | 101,707 | 48.53% | |||
No party | Others | 196 | 0.09% | |||
Total votes | 209,586 | 100.00% | ||||
Democratic gain from Republican | ||||||
Party | Candidate | Votes | % | |
---|---|---|---|---|
Democratic | Dave Loebsack (incumbent) | 175,218 | 57.19% | |
Republican | Mariannette Miller-Meeks | 118,778 | 38.77% | |
Green | Wendy Barth | 6,664 | 2.18% | |
Independent | Brian White | 5,437 | 1.78% | |
No party | Others | 261 | 0.09% | |
Total votes | 306,358 | 100.00% | ||
Democratic hold | ||||
Party | Candidate | Votes | % | |
---|---|---|---|---|
Democratic | Dave Loebsack (incumbent) | 115,839 | 50.99% | |
Republican | Mariannette Miller-Meeks | 104,319 | 45.92% | |
Libertarian | Gary Joseph Sicard | 4,356 | 1.92% | |
Constitution | Jon Tack | 2,463 | 1.08% | |
No party | Others | 198 | 0.09% | |
Total votes | 227,175 | 100.00% | ||
Democratic hold | ||||
Party | Candidate | Votes | % | |
---|---|---|---|---|
Democratic | Dave Loebsack (incumbent) | 211,863 | 55.57% | |
Republican | John Archer | 161,977 | 42.48% | |
Independent | Alan Aversa | 7,112 | 1.87% | |
No party | Others | 323 | 0.08% | |
Total votes | 381,275 | 100.00% | ||
Democratic hold | ||||
Party | Candidate | Votes | % | |
---|---|---|---|---|
Democratic | Dave Loebsack (incumbent) | 143,431 | 52.5% | |
Republican | Mariannette Miller-Meeks | 129,455 | 47.4% | |
Write-ins | 443 | 0.2% | ||
Total votes | 273,329 | 100% | ||
Democratic hold | ||||
Party | Candidate | Votes | % | |
---|---|---|---|---|
Democratic | Dave Loebsack (incumbent) | 198,571 | 53.7% | |
Republican | Christopher Peters | 170,933 | 46.2% | |
Write-ins | 528 | 0.1% | ||
Total votes | 370,032 | 100.00% | ||
Democratic hold | ||||
Party | Candidate | Votes | % | ±% | |
---|---|---|---|---|---|
Democratic | Dave Loebsack (incumbent) | 171,120 | 54.8% | +1.1 | |
Republican | Christopher Peters | 133,051 | 42.6% | −3.6 | |
Libertarian | Mark David Strauss | 6,176 | 1.98% | +1.98 | |
Independent | Daniel Clark | 1,839 | 0.59% | +0.59 | |
Write-ins | 171 | 0.05% | −0.05 | ||
Majority | 38,069 | 12.2% | |||
Turnout | 312,357 | 100% | |||
Democratic hold | Swing | +4.7 | |||
Party | Candidate | Votes | % | |
---|---|---|---|---|
Republican | Mariannette Miller-Meeks | 196,864 | 49.912% | |
Democratic | Rita Hart | 196,858 | 49.910% | |
Total votes | 394,439 | 100.0 | ||
Republican gain from Democratic | ||||
Rita Hart announced on March 31, 2021, that she was dropping her challenge before the House Administration Committee but maintained that her attempt to contest — which she lost by six votes —was valid. [4]
Texas's 6th congressional district of the United States House of Representatives is in an area that includes Ellis and Navarro counties to the south and southeast of the Dallas/Fort Worth area plus the southeast corner of Tarrant County. As of the 2010 census, the 6th district represented 698,498 people. The district is currently represented by Republican Jake Ellzey.
Texas's 12th congressional district in the United States House of Representatives is in the north portion of the state of Texas. As of 2017, the 12th district contained 806,551 people and had a median income of $67,703. It consists of the western half of Tarrant County, as well as most of Parker County. The district also contains Texas Christian University. Fragments of the Dallas–Fort Worth metroplex are included in the district. The district is currently represented by Republican Kay Granger, who was first elected in 1996.
Texas's 20th congressional district of the United States House of Representatives includes the western half of San Antonio and Bexar County in Texas. The district is heavily Latino/Hispanic, as is the surrounding area. Charlie Gonzalez, who represented the district from 1999 to 2013 after succeeding his father, Henry B. González, did not seek re-election in the 2012 United States House of Representatives elections. State representative Joaquin Castro, the Democratic nominee to replace Gonzalez, defeated David Rosa, the Republican nominee, in the race for Texas's 20th district on November 6, 2012. His term began on January 3, 2013.
Ohio's 2nd congressional district is a district in southern Ohio. It is currently represented by Republican Brad Wenstrup.
Iowa's 1st congressional district is a congressional district in the U.S. state of Iowa that covers its southeastern part, bordering the states of Illinois and Missouri, and the Mississippi River. The district includes the cities of Davenport, Iowa City, Burlington, and Indianola. Republican Mariannette Miller-Meeks is the current U.S. representative. With a Cook Partisan Voting Index rating of R+3, it is one of the least Republican districts in Iowa, a state with an all-Republican congressional delegation.
Iowa's 3rd congressional district is a congressional district in the U.S. state of Iowa that covers its southwestern quadrant, which roughly consists of an area stretching from Des Moines to the borders with Missouri.
Alabama's 4th congressional district is a U.S. congressional district in Alabama, which elects a representative to the United States House of Representatives. It encompasses the counties of Franklin, Colbert, Marion, Lamar, Fayette, Walker, Winston, Cullman, Lawrence, Marshall, Etowah, and DeKalb. It also includes parts of Jackson and Tuscaloosa counties, as well as parts of the Decatur Metropolitan Area and the Huntsville-Decatur Combined Statistical Area.
Georgia's 8th congressional district is a congressional district in the U.S. state of Georgia. The district is currently represented by Republican Austin Scott.
Georgia's 10th congressional district is a congressional district in the U.S. state of Georgia. The district is currently represented by Republican Mike Collins, and includes a large swath of urban and rural territory between Atlanta and Augusta.
Kentucky's 6th congressional district is a congressional district in the U.S. state of Kentucky. Based in Central Kentucky, the district contains the cities of Lexington, Richmond, and Georgetown. The district is currently represented by Republican Andy Barr.
Ohio's 5th congressional district is in northwestern and north central Ohio and borders Indiana. The district is currently represented by Republican Bob Latta.
Ohio's 8th congressional district sits on the west side of Ohio, bordering Indiana. The cities of Hamilton, Fairfield, Middletown, Springfield, Eaton, Greenville, Piqua, and Troy are part of the district. The district was represented by Republican John Boehner, the 53rd Speaker of the United States House of Representatives. On September 25, 2015, Boehner announced his resignation from the speakership and retirement from Congress, which became effective on October 31, 2015.
The 13th congressional district of Ohio is represented by Representative Emilia Sykes. Due to reapportionment following the 2010 United States census, Ohio lost its 17th and 18th congressional districts, necessitating redrawing of district lines. Following the 2012 elections, the 13th district changed to take in much of the territory in the former 17th district, including the city of Youngstown and areas east of Akron.
The 14th congressional district of Ohio is in the far northeast corner of the state, bordering Lake Erie and Pennsylvania. It is currently represented in the United States House of Representatives by Republican Dave Joyce.
The 15th congressional district of Ohio is currently represented by Republican Mike Carey. It was represented by Republican Steve Stivers from 2011 until May 16, 2021, when he resigned to become president and CEO of the Ohio Chamber of Commerce. The district includes all of Franklin County that is not in the 3rd district, including Grove City, Hilliard, and Dublin. It then fans out to grab suburban and exurban territory between the state capital Columbus and Dayton, along with more rural territory south of Columbus.
The 5th congressional district of Illinois covers parts of Cook and Lake counties, as of the 2023 redistricting which followed the 2010 census. All or parts of Chicago, Inverness, Arlington Heights, Barrington Hills, Des Plaines, Palatine, Mount Prospect, Deer Park, Kildeer, Lake Zurich, Long Grove, and North Barrington are included.
Arkansas's 2nd congressional district is a congressional district located in the central part of the U.S. state of Arkansas and includes the state capital of Little Rock, its suburbs, and surrounding areas. The district leans Republican, with a Cook Partisan Voting Index rating of R+9. However, due to the influence of heavily Democratic Little Rock, it is still considered the least Republican congressional district in Arkansas, which has an all-Republican congressional delegation.
Oregon's 2nd congressional district is the largest of Oregon's six districts, and is the seventh largest district in the nation. It is the second-largest congressional district in the nation that does not cover an entire state, and has been represented by Republican Cliff Bentz of Ontario since 2021.
Indiana's 2nd congressional district is an electoral district for the U.S. Congress in Northern Indiana. It includes South Bend, Elkhart, and Warsaw.
Connecticut's 4th congressional district is a congressional district in the U.S. state of Connecticut. Located in the southwestern part of the state, the district is largely suburban and extends from Bridgeport, the largest city in the state, to Greenwich – an area largely coextensive with the Connecticut side of the New York metropolitan area. The district also extends inland, toward Danbury and toward the Lower Naugatuck Valley.