This is a list of countries and some dependent territories and subnational areas by incarceration rate. [1]
The World Prison Brief (WPB) may or may not incorporate juvenile incarceration numbers into the totals for each country, dependent territory, or subnational area. The date for each item below is the latest available to WPB at the time the data was copied here. See the individual WPB country and subnational area pages for more info on dates, juvenile numbers, and much more. [1] N/A below means that the data is not available (NA) in the info provided by WPB.
* indicates "Incarceration in LOCATION" or "Crime in LOCATION" links.
Note: For the UK as a whole see #United Kingdom in notes section.
Location | Region | Count [2] | Rate per 100,000 [3] | Male (%) [lower-alpha 1] | Female (%) [4] | National (%) [lower-alpha 2] | Foreign (%) [5] | Occupancy (%) [6] | Remand (%) [7] |
---|---|---|---|---|---|---|---|---|---|
Afghanistan * | Asia | 28,240 | 77 | 97.4 | 2.6 | 99.1 | 0.9 | 179.9 | 31.3 |
Albania * | Europe | 5,112 | 183 | 98.0 | 2.0 | 98.1 | 1.9 | 84.7 | 50.7 |
Algeria | Africa | 94,749 | 217 | 98.5 | 1.5 | 96.2 | 3.8 | 89.3 | 12.0 |
American Samoa | Oceania | 301 | 538 | 95.9 | 4.1 | 37.8 | 62.2 | 166.2 | 14.9 |
Andorra | Europe | 46 | 58 | 91.1 | 8.9 | 41.1 | 58.9 | 30.3 | 57.1 |
Angola | Africa | 24,966 | 79 | 97.3 | 2.7 | — | — | 110.8 | 45.8 |
Anguilla | Americas | 55 | 367 | 100.0 | 0.0 | 70.9 | 29.1 | 91.7 | 45.5 |
Antigua and Barbuda | Americas | 238 | 243 | 95.2 | 4.8 | 69.4 | 30.6 | 191.3 | 37.0 |
Argentina * | Americas | 114,074 | 249 | 95.2 | 4.8 | 93.5 | 6.5 | 122.1 | 45.9 |
Armenia * | Asia | 2,113 | 71 | 96.8 | 3.2 | 94.8 | 5.2 | 41.1 | 41.0 |
Aruba | Americas | 170 | 165 | 96.5 | 3.5 | 51.9 | 48.1 | 68.4 | 16.6 |
Australia * [Note] | Oceania | 42,403 | 165 | 92.3 | 7.7 | 82.9 | 17.1 | 112.2 | 31.9 |
Austria * | Europe | 8,645 | 96 | 93.4 | 6.6 | 46.8 | 53.2 | 95.7 | 21.0 |
Azerbaijan | Asia | 22,334 | 220 | 97.1 | 2.9 | 97.9 | 2.1 | 82.7 | 16.9 |
Bahamas | Americas | 1,617 | 409 | 96.9 | 3.1 | — | — | 177.8 | 42.0 |
Bahrain * | Asia | 3,485 | 234 | 95.3 | 4.7 | 76.3 | 23.7 | 110.2 | 25.7 |
Bangladesh * | Asia | 81,156 | 46 | 96.1 | 3.9 | 99.4 | 0.6 | 195.8 | 81.3 |
Barbados | Americas | 769 | 267 | 97.4 | 2.6 | 86.2 | 13.8 | 70.7 | 54.7 |
Belarus | Europe | 32,556 | 345 | 89.2 | 10.8 | 96.9 | 3.1 | 83.4 | 16.6 |
Belgium * | Europe | 10,614 | 91 | 95.6 | 4.4 | 55.8 | 44.2 | 120.6 | 37.6 |
Belize * | Americas | 1,114 | 271 | 97.2 | 2.8 | 88.9 | 11.1 | 87.3 | 40.0 |
Benin * | Africa | 13,009 | 103 | 96.7 | 3.3 | — | — | 151.3 | 75.8 |
Bermuda | Americas | 124 | 200 | 97.1 | 2.9 | 88.5 | 11.5 | 59.7 | 20.2 |
Bhutan * | Asia | 1,119 | 145 | 95.7 | 4.3 | 93.2 | 6.8 | — | — |
Bolivia * | Americas | 20,864 | 175 | 92.0 | 8.0 | 96.7 | 3.3 | 363.9 | 67.2 |
Bosnia and Herzegovina | Europe | 1,813 | 83 | 96.8 | 3.2 | 96.4 | 3.6 | 102.1 | 19.8 |
Republika Srpska | Europe | 554 | 46 | 98.1 | 1.9 | 97.6 | 2.4 | 50.9 | 14.4 |
Botswana | Africa | 3,882 | 162 | 95.3 | 4.7 | 68.4 | 31.6 | 100.9 | 24.5 |
Brazil * | Americas | 835,643 | 389 | 95.1 | 4.9 | 99.7 | 0.3 | 151.9 | 30.1 |
Brunei | Asia | 841 | 186 | 88.1 | 11.9 | 70.8 | 29.2 | 143.8 | 7.1 |
Bulgaria * | Europe | 6,384 | 93 | 97.0 | 3.0 | 97.0 | 3.0 | 80.9 | 19.1 |
Burkina Faso | Africa | 7,401 | 35 | 98.0 | 2.0 | 95.9 | 4.1 | 156.6 | 40.5 |
Burundi | Africa | 12,448 | 88 | 94.2 | 5.8 | 98.8 | 1.2 | 304.3 | 39.3 |
Cambodia * | Asia | 39,000 | 229 | 91.8 | 8.2 | 96.3 | 3.7 | 206.1 | 71.9 |
Cameroon | Africa | 32,003 | 116 | 97.3 | 2.7 | 95.1 | 4.9 | 171.4 | 58.1 |
Canada * | Americas | 32,261 | 85 | 94.4 | 5.6 | — | — | 102.2 | 39.0 |
Cape Verde * | Africa | 1,549 | 296 | 97.1 | 2.9 | — | — | 109.4 | 31.7 |
Cayman Islands | Americas | 205 | 312 | 93.2 | 6.8 | 69.2 | 30.8 | 102.1 | 29.6 |
Central African Republic | Africa | 1,291 | 26 | 91.8 | 8.2 | — | — | — | 70.2 |
Chad | Africa | 8,700 | 59 | 97.6 | 2.4 | 98.7 | 1.3 | 232.3 | 63.4 |
Chile * | Americas | 45,135 | 240 | 92.9 | 7.1 | 96.6 | 3.4 | 100.4 | 35.9 |
China * [Note] | Asia | 1,690,000 | 119 | 91.6 | 8.4 | 99.6 | 0.4 | — | — |
Colombia * | Americas | 98,242 | 192 | 92.8 | 7.2 | 98.7 | 1.3 | 121.2 | 24.1 |
Comoros | Africa | 387 | 43 | 97.8 | 2.2 | 92.3 | 7.7 | 161.7 | 29.0 |
Congo | Africa | 1,388 | 27 | 96.3 | 3.7 | — | — | 616.9 | 60.0 |
Cook Islands | Oceania | 47 | 224 | 91.7 | 8.3 | 100.0 | 0.0 | 50.0 | 14.6 |
Costa Rica * | Americas | 15,516 | 301 | 94.6 | 5.4 | 86.9 | 13.1 | 129.1 | 14.4 |
Ivory Coast * | Africa | 23,000 | 85 | 97.6 | 2.4 | 70.0 | 30.0 | 196.9 | 40.7 |
Croatia | Europe | 3,955 | 99 | 94.7 | 5.3 | 94.3 | 5.7 | 87.1 | 31.0 |
Cuba * [Note] | Americas | 57,337 | 510 | — | — | — | — | — | — |
Curaçao | Americas | 429 | 261 | 96.8 | 3.2 | — | — | 63.9 | 41.0 |
Cyprus | Asia | 716 | 80 | 94.6 | 5.4 | 53.7 | 46.3 | 108.8 | 32.4 |
Czech Republic * | Europe | 19,215 | 179 | 91.8 | 8.2 | 92.0 | 8.0 | 97.0 | 8.0 |
DR Congo * | Africa | 22,820 | 24 | 97.0 | 3.0 | — | — | — | 73.0 |
Denmark * | Europe | 4,248 | 72 | 95.6 | 4.4 | 69.9 | 30.1 | 98.9 | 38.2 |
Djibouti | Africa | 662 | 71 | 95.0 | 5.0 | — | — | 171.4 | 35.8 |
Dominica | Americas | 206 | 275 | 99.5 | 0.5 | 98.1 | 1.9 | 73.0 | 23.7 |
Dominican Republic * | Americas | 26,238 | 231 | 97.2 | 2.8 | 91.9 | 8.1 | 183.2 | 61.4 |
Ecuador * | Americas | 32,325 | 178 | 93.3 | 6.7 | 91.9 | 8.1 | 133.2 | 37.0 |
Egypt * | Africa | 119,000 | 117 | 96.3 | 3.7 | 99.0 | 1.0 | — | 9.9 |
El Salvador * | Americas | 39,538 | 605 | 92.5 | 7.5 | 98.7 | 1.3 | 215.2 | 24.4 |
England and Wales * [Note] | Europe | 82,176 | 136 | 96.0 | 4.0 | 87.8 | 12.2 | 101.4 | 15.4 |
Equatorial Guinea | Africa | 500 | 63 | 95.0 | 5.0 | — | — | — | — |
Eritrea [Note] | Africa | — | — | — | — | — | — | — | — |
Estonia * | Europe | 2,057 | 155 | 96.1 | 3.9 | 64.5 | 35.5 | 76.6 | 19.2 |
Eswatini | Africa | 3,362 | 244 | 97.1 | 2.9 | 94.0 | 6.0 | 133.1 | 18.1 |
Ethiopia * | Africa | 110,000 | 99 | 95.8 | 4.2 | — | — | — | 14.9 |
Faroe Islands | Europe | 11 | 21 | 100.0 | 0.0 | — | — | 78.2 | 32.1 |
Fiji | Oceania | 2,379 | 256 | 97.5 | 2.5 | 98.8 | 1.2 | 137.9 | 24.0 |
Finland * | Europe | 2,827 | 51 | 91.7 | 8.3 | 82.9 | 17.1 | 101.1 | 23.6 |
France * | Europe | 72,350 | 106 | 96.7 | 3.3 | 77.9 | 22.1 | 103.4 | 32.4 |
French Guiana | Americas | 833 | 261 | 92.7 | 7.3 | 37.0 | 63.0 | 97.9 | 27.9 |
French Polynesia | Oceania | 595 | 208 | 95.8 | 4.2 | — | — | 102.2 | 19.0 |
Gabon | Africa | 5,226 | 228 | 97.8 | 2.2 | — | — | — | 80.2 |
Gambia | Africa | 543 | 22 | 97.5 | 2.5 | 33.3 | 66.7 | 172.5 | 22.2 |
Georgia | Asia | 9,702 | 266 | 96.4 | 3.6 | 94.1 | 5.9 | 78.3 | 20.7 |
Germany * | Europe | 56,557 | 67 | 94.4 | 5.6 | 76.0 | 24.0 | 78.7 | 20.6 |
Ghana * | Africa | 14,444 | 45 | 98.8 | 1.2 | 92.8 | 7.2 | 155.5 | 12.2 |
Gibraltar * | Europe | 92 | 273 | 92.9 | 7.1 | 66.1 | 33.9 | 57.1 | 26.8 |
Greece * | Europe | 11,131 | 105 | 95.5 | 4.5 | 45.1 | 54.9 | 113.2 | 26.6 |
Greenland | Americas | 131 | 233 | 86.2 | 13.8 | 99.1 | 0.9 | 76.8 | 31.7 |
Grenada | Americas | 365 | 323 | 98.6 | 1.4 | 96.9 | 3.1 | 233.8 | 20.4 |
Guadeloupe * | Americas | 857 | 191 | 96.8 | 3.2 | — | — | 119.6 | 27.0 |
Guam | Oceania | 700 | 408 | 92.8 | 7.2 | 69.0 | 31.0 | 126.2 | 45.1 |
Guatemala * | Americas | 24,310 | 130 | 88.8 | 11.2 | 96.8 | 3.2 | 372.0 | 49.6 |
Guernsey | Europe | 84 | 127 | 94.6 | 5.4 | 90.3 | 9.7 | 79.1 | 15.1 |
Guinea | Africa | 4,375 | 34 | 97.0 | 3.0 | 97.3 | 2.7 | 156.8 | 60.0 |
Guinea-Bissau | Africa | 596 | 31 | 97.4 | 2.6 | 92.9 | 7.1 | 102.2 | 67.9 |
Guyana * | Americas | 1,889 | 239 | 97.2 | 2.8 | 98.5 | 1.5 | 142.4 | 39.5 |
Haiti * | Americas | 11,253 | 98 | 95.8 | 4.2 | — | — | 454.4 | 75.0 |
Honduras * | Americas | 20,768 | 206 | 94.3 | 5.7 | 98.7 | 1.3 | 204.0 | 54.1 |
Hong Kong * | Asia | 7,867 | 106 | 79.9 | 20.1 | 70.1 | 29.9 | 74.0 | 29.9 |
Hungary * | Europe | 18,800 | 194 | 92.3 | 7.7 | 95.1 | 4.9 | 111.6 | 16.6 |
Iceland | Europe | 140 | 37 | 92.4 | 7.6 | 78.5 | 21.5 | 68.2 | 13.2 |
India * | Asia | 554,034 | 40 | 95.8 | 4.2 | 98.8 | 1.2 | 118.5 | 69.1 |
Indonesia * | Asia | 275,518 | 99 | 95.0 | 5.0 | 99.6 | 0.4 | 188.7 | 19.4 |
Iran * | Asia | 189,000 | 228 | 96.9 | 3.1 | 97.1 | 2.9 | 153.0 | 25.1 |
Iraq | Asia | 73,715 | 179 | 97.4 | 2.6 | — | — | 139.2 | 35.2 |
Ireland | Europe | 4,246 | 83 | 96.1 | 3.9 | 86.4 | 13.6 | 85.8 | 17.5 |
Isle of Man | Europe | 109 | 126 | 95.3 | 4.7 | 91.5 | 8.5 | 76.8 | 6.6 |
Israel * | Asia | 14,961 | 168 | 99.0 | 1.0 | 61.1 | 38.9 | 80.1 | 25.2 |
Italy * | Europe | 56,524 | 97 | 95.8 | 4.2 | 67.8 | 32.2 | 106.2 | 31.3 |
Jamaica * | Americas | 3,719 | 130 | 96.1 | 3.9 | 98.9 | 1.1 | 88.8 | 32.3 |
Japan * | Asia | 45,714 | 36 | 91.8 | 8.2 | 94.3 | 5.7 | 56.6 | 12.1 |
Jersey | Europe | 146 | 135 | 95.7 | 4.3 | 74.8 | 25.2 | 69.5 | 28.1 |
Jordan | Asia | 17,708 | 174 | 97.8 | 2.2 | 90.1 | 9.9 | 150.2 | 36.9 |
Kazakhstan | Asia | 35,228 | 184 | 92.9 | 7.1 | 94.2 | 5.8 | 62.4 | 19.7 |
Kenya * | Africa | 58,887 | 107 | 93.3 | 6.7 | 99.4 | 0.6 | 190.5 | 44.1 |
Kiribati | Oceania | 129 | 113 | 99.2 | 0.8 | 100.0 | 0.0 | 112.8 | 5.4 |
Kosovo * | Europe | 1,642 | 93 | 97.3 | 2.7 | 94.3 | 5.7 | 97.1 | 29.6 |
Kuwait * | Asia | 4,420 | 111 | 94.2 | 5.8 | 86.5 | 13.5 | 134.1 | 10.0 |
Kyrgyzstan | Asia | 10,142 | 161 | 95.8 | 4.2 | 96.8 | 3.2 | 61.7 | 16.6 |
Laos * | Asia | 11,885 | 166 | 86.3 | 13.7 | — | — | — | 67.0 |
Latvia * | Europe | 3,169 | 169 | 91.4 | 8.6 | 98.1 | 1.9 | 68.8 | 27.8 |
Lebanon | Asia | 7,401 | 110 | 96.8 | 3.2 | 64.0 | 36.0 | 286.6 | 62.9 |
Lesotho * | Africa | 2,216 | 104 | 96.4 | 3.6 | 99.1 | 0.9 | 70.6 | 19.5 |
Liberia * | Africa | 2,925 | 56 | 97.2 | 2.8 | 98.0 | 2.0 | 222.1 | 64.0 |
Libya | Africa | 12,300 | 176 | 98.8 | 1.2 | 87.2 | 12.8 | 141.6 | 90.0 |
Liechtenstein | Europe | 11 | 28 | 100.0 | 0.0 | 25.0 | 75.0 | 45.0 | 75.0 |
Lithuania | Europe | 5,089 | 182 | 95.3 | 4.7 | 97.9 | 2.1 | 83.2 | 11.8 |
Luxembourg | Europe | 685 | 106 | 95.2 | 4.8 | 25.3 | 74.7 | 73.7 | 41.0 |
Macau * | Asia | 1,401 | 209 | 87.8 | 12.2 | 29.3 | 70.7 | 82.8 | 18.9 |
Madagascar | Africa | 27,611 | 97 | 94.2 | 5.8 | 99.9 | 0.1 | 237.4 | 56.8 |
Malawi | Africa | 14,500 | 71 | 98.9 | 1.1 | 99.8 | 0.2 | 200.9 | 17.8 |
Malaysia * | Asia | 76,336 | 229 | 95.5 | 4.5 | 79.5 | 20.5 | 131.9 | 26.7 |
Maldives * | Asia | 1,700 | 314 | 95.7 | 4.3 | 98.9 | 1.1 | 127.7 | — |
Mali | Africa | 8,670 | 40 | 97.2 | 2.8 | — | — | 223.3 | 52.8 |
Malta | Europe | 821 | 159 | 92.9 | 7.1 | 44.3 | 55.7 | 88.6 | 33.9 |
Marshall Islands | Oceania | 35 | 66 | 100.0 | 0.0 | — | — | 97.2 | 11.4 |
Martinique | Americas | 919 | 239 | 97.1 | 2.9 | — | — | 96.9 | 37.0 |
Mauritania * | Africa | 2,023 | 43 | 98.2 | 1.8 | 88.8 | 11.2 | 101.8 | 38.2 |
Mauritius * | Africa | 2,386 | 184 | 93.9 | 6.1 | 93.6 | 6.4 | 116.9 | 59.4 |
Mayotte | Africa | 519 | 180 | 99.7 | 0.3 | — | — | 127.5 | 56.5 |
Mexico * | Americas | 230,000 | 174 | 94.5 | 5.5 | 98.8 | 1.2 | 98.2 | 41.7 |
Micronesia | Oceania | 132 | 127 | 100.0 | 0.0 | — | — | 88.0 | 16.7 |
Moldova * | Europe | 6,461 | 183 | 94.2 | 5.8 | 98.8 | 1.2 | 97.7 | 15.3 |
Monaco | Europe | 13 | 33 | 85.7 | 14.3 | 4.8 | 95.2 | 9.5 | 76.2 |
Mongolia | Asia | 5,832 | 183 | 95.2 | 4.8 | 99.6 | 0.4 | 124.4 | 26.6 |
Montenegro * | Europe | 929 | 150 | 97.4 | 2.6 | 84.7 | 15.3 | 80.3 | 29.2 |
Morocco | Africa | 88,941 | 240 | 97.7 | 2.3 | 98.6 | 1.4 | 136.9 | 39.1 |
Mozambique | Africa | 18,700 | 56 | 97.1 | 2.9 | 98.5 | 1.5 | 210.7 | 33.1 |
Myanmar * | Asia | 100,324 | 183 | 87.7 | 12.3 | 99.3 | 0.7 | 139.4 | 15.1 |
Namibia * | Africa | 8,900 | 318 | 97.1 | 2.9 | 94.5 | 5.5 | 72.7 | 54.0 |
Nauru * | Oceania | 14 | 140 | 92.9 | 7.1 | 93.3 | 6.7 | 14.0 | 25.0 |
Nepal * | Asia | 25,400 | 83 | 94.4 | 5.6 | 94.7 | 5.3 | 153.7 | 55.1 |
Netherlands | Europe | 11,623 | 66 | 94.5 | 5.5 | 77.1 | 22.9 | 74.4 | 29.2 |
New Caledonia | Oceania | 619 | 212 | 98.9 | 1.1 | — | — | 106.3 | 12.1 |
New Zealand * | Oceania | 7,964 | 155 | 93.4 | 6.6 | 97.0 | 3.0 | 93.8 | 36.5 |
Nicaragua | Americas | 20,918 | 332 | 94.6 | 5.4 | 97.1 | 2.9 | 177.6 | 21.4 |
Niger | Africa | 9,187 | 39 | 96.8 | 3.2 | — | — | 101.6 | 53.8 |
Nigeria * | Africa | 74,367 | 34 | 98.1 | 1.9 | 99.7 | 0.3 | 146.8 | 72.7 |
North Korea * [Note] | Asia | — | — | — | — | — | — | — | — |
North Macedonia | Europe | 2,220 | 107 | 96.7 | 3.3 | 93.3 | 6.7 | 72.0 | 13.7 |
Northern Ireland * [Note] | Europe | 1,667 | 88 | 97.3 | 2.7 | 88.4 | 11.6 | 79.9 | 34.1 |
Northern Mariana Islands | Oceania | 175 | 313 | 94.2 | 5.8 | — | — | 53.8 | — |
Norway * | Europe | 3,009 | 55 | 93.7 | 6.3 | 71.0 | 29.0 | 73.0 | 25.2 |
Oman * | Asia | 1,960 | 46 | 95.5 | 4.5 | 69.7 | 30.3 | — | 5.6 |
Pakistan * | Asia | 85,670 | 38 | 98.4 | 1.6 | 98.8 | 1.2 | 133.8 | 62.1 |
Palau | Oceania | 77 | 428 | 95.7 | 4.3 | 93.5 | 6.5 | 162.1 | 4.1 |
Panama * | Americas | 21,113 | 478 | 94.8 | 5.2 | 89.9 | 10.1 | 124.6 | 39.2 |
Papua New Guinea * | Oceania | 5,087 | 58 | 95.1 | 4.9 | 99.6 | 0.4 | 116.5 | 34.4 |
Paraguay * | Americas | 16,656 | 229 | 94.1 | 5.9 | 95.8 | 4.2 | 143.1 | 77.3 |
Peru * | Americas | 90,293 | 264 | 94.5 | 5.5 | 97.6 | 2.4 | 240.3 | 37.0 |
Philippines * | Asia | 166,912 | 152 | 89.0 | 11.0 | 99.7 | 0.3 | 463.6 | 75.1 |
Poland * | Europe | 71,866 | 191 | 95.4 | 4.6 | 98.2 | 1.8 | 84.3 | 12.8 |
Portugal * | Europe | 12,396 | 120 | 93.0 | 7.0 | 85.0 | 15.0 | 88.9 | 19.0 |
Puerto Rico * | Americas | 8,884 | 278 | 96.3 | 3.7 | — | — | 86.3 | 13.1 |
Qatar * | Asia | 1,150 | 53 | 85.3 | 14.7 | 26.7 | 73.3 | — | 44.0 |
South Korea * | Asia | 53,920 | 105 | 92.7 | 7.3 | 95.3 | 4.7 | 112.0 | 35.1 |
Réunion | Africa | 1,179 | 130 | 97.4 | 2.6 | — | — | 89.1 | 21.5 |
Romania * | Europe | 23,046 | 122 | 95.4 | 4.6 | 99.0 | 1.0 | 120.5 | 10.4 |
Russia * | Europe | 439,453 | 304 | 91.7 | 8.3 | 93.8 | 6.2 | 67.8 | 23.3 |
Rwanda | Africa | 76,099 | 580 | 92.6 | 7.4 | 99.7 | 0.3 | 101.3 | 7.5 |
Samoa | Oceania | 358 | 179 | 94.0 | 6.0 | 99.5 | 0.5 | 121.2 | 14.0 |
San Marino | Europe | 9 | 26 | 100.0 | 0.0 | 100.0 | 0.0 | 16.7 | 0.0 |
São Tomé and Príncipe | Africa | 260 | 115 | 96.0 | 4.0 | 99.2 | 0.8 | 126.5 | 32.8 |
Saudi Arabia * | Asia | 68,056 | 207 | 98.1 | 1.9 | 51.0 | 49.0 | — | 48.3 |
Scotland * [Note] | Europe | 7,328 | 134 | 96.0 | 4.0 | 96.1 | 3.9 | 86.6 | 26.5 |
Senegal | Africa | 12,430 | 67 | 97.3 | 2.7 | 89.3 | 10.7 | 129.7 | 39.7 |
Serbia * | Europe | 10,557 | 155 | 95.9 | 4.1 | 97.1 | 2.9 | 105.6 | 15.6 |
Seychelles | Africa | 317 | 317 | 93.7 | 6.3 | 98.7 | 1.3 | 53.8 | 12.5 |
Sierra Leone | Africa | 4,430 | 54 | 98.5 | 1.5 | 99.5 | 0.5 | 220.2 | 29.5 |
Singapore * | Asia | 10,262 | 169 | 88.9 | 11.1 | 89.0 | 11.0 | 79.2 | 10.6 |
Sint Maarten | Americas | 77 | 179 | 95.0 | 5.0 | 79.8 | 20.2 | 125.4 | 18.1 |
Slovakia * | Europe | 9,939 | 182 | 92.6 | 7.4 | 98.0 | 2.0 | 89.6 | 15.3 |
Slovenia * | Europe | 1,447 | 68 | 95.2 | 4.8 | 70.2 | 29.8 | 84.4 | 26.0 |
Solomon Islands | Oceania | 500 | 79 | 98.3 | 1.7 | 99.0 | 1.0 | 77.7 | 46.8 |
Somalia [Note] | Africa | — | — | — | — | — | — | — | — |
South Africa * | Africa | 144,938 | 239 | 97.4 | 2.6 | 92.5 | 7.5 | 124.8 | 35.7 |
South Sudan | Africa | 7,000 | 50 | 89.1 | 10.9 | — | — | — | 28.9 |
Spain * | Europe | 55,093 | 116 | 92.6 | 7.4 | 71.9 | 28.1 | 77.9 | 16.0 |
Sri Lanka * | Asia | 22,000 | 102 | 95.1 | 4.9 | 98.6 | 1.4 | 190.6 | 58.9 |
Saint Kitts and Nevis * | Americas | 184 | 347 | 96.4 | 3.6 | 97.9 | 2.1 | 144.0 | 30.5 |
Saint Lucia * | Americas | 484 | 263 | 97.5 | 2.5 | 97.0 | 3.0 | 105.4 | 53.5 |
Saint Vincent and the Grenadines | Americas | 385 | 347 | 96.6 | 3.4 | 96.2 | 3.8 | 79.8 | 24.3 |
Sudan * | Africa | 21,000 | 52 | 98.0 | 2.0 | 99.0 | 1.0 | 255.3 | 20.4 |
Suriname * | Americas | 1,000 | 185 | 97.2 | 2.8 | 80.7 | 19.3 | 75.2 | 50.0 |
Sweden * | Europe | 7,713 | 74 | 94.4 | 5.6 | 77.9 | 22.1 | 101.6 | 27.2 |
Switzerland * | Europe | 6,310 | 72 | 94.2 | 5.8 | 30.4 | 69.6 | 93.5 | 42.2 |
Syria | Asia | 10,599 | 60 | 92.6 | 7.4 | 92.7 | 7.3 | 65.6 | 50.5 |
Taiwan * | Asia | 55 761 | 237 | 91.0 | 9.0 | 99.3 | 0.7 | 114.8 | 4.1 |
Tajikistan | Asia | 14 000 | 141 | 98.4 | 1.6 | 95.1 | 4.9 | 61.5 | 15.0 |
Tanzania | Africa | 33,570 | 52 | 96.6 | 3.4 | 96.3 | 3.7 | 115.7 | 51.0 |
Thailand * | Asia | 285,572 | 411 | 87.8 | 12.2 | 95.6 | 4.4 | 339.1 | 19.2 |
East Timor | Asia | 763 | 55 | 95.9 | 4.1 | 96.2 | 3.8 | 185.3 | 23.2 |
Togo | Africa | 4,990 | 59 | 97.0 | 3.0 | 94.8 | 5.2 | 194.0 | 64.2 |
Tonga * | Oceania | 176 | 166 | 95.5 | 4.5 | 100.0 | 0.0 | 81.5 | 7.4 |
Trinidad and Tobago * | Americas | 3,802 | 276 | 97.1 | 2.9 | 99.2 | 0.8 | 81.8 | 59.7 |
Tunisia | Africa | 23,484 | 196 | 97.2 | 2.8 | — | — | 118.5 | 57.0 |
Turkey * | Asia | 314,502 | 374 | 96.1 | 3.9 | 96.7 | 3.3 | 125.6 | 43.1 |
Turkmenistan | Asia | 35,000 | 576 | 93.5 | 6.5 | 99.3 | 0.7 | 85.0 | 14.0 |
Tuvalu * | Oceania | 11 | 110 | 100.0 | 0.0 | 100.0 | 0.0 | — | 0.0 |
Uganda | Africa | 70,535 | 144 | 95.5 | 4.5 | 97.7 | 2.3 | 319.2 | 49.8 |
Ukraine * | Europe | 48,038 | 123 | 96.1 | 3.9 | 98.3 | 1.7 | 68.3 | 37.2 |
United Arab Emirates * | Asia | 9,826 | 104 | 88.3 | 11.7 | 12.2 | 87.8 | 158.9 | 38.2 |
United States * [Note] | Americas | 1,675,400 | 505 | 89.8 | 10.2 | 92.7 | 7.3 | 95.6 | 23.3 |
Uruguay | Americas | 14,347 | 408 | 94.6 | 5.4 | 97.2 | 2.8 | 99.3 | 22.3 |
Uzbekistan | Asia | 22,867 | 68 | — | — | — | — | 80.0 | 10.0 |
Vanuatu | Oceania | 195 | 65 | 97.5 | 2.5 | 97.5 | 2.5 | 106.7 | 15.3 |
Venezuela * | Americas | 67,200 | 199 | 94.3 | 5.7 | 97.8 | 2.2 | 167.7 | 61.3 |
Vietnam * | Asia | 125,697 | 130 | 89.3 | 10.7 | 99.6 | 0.4 | — | 12.4 |
British Virgin Islands | Americas | 143 | 447 | 95.5 | 4.5 | — | — | 90.0 | 37.0 |
U.S. Virgin Islands | Americas | 359 | 345 | 97.3 | 2.7 | 84.3 | 15.7 | 162.5 | 36.4 |
Yemen * | Asia | 9,719 | 35 | 98.4 | 1.6 | 96.8 | 3.2 | — | 70.1 |
Zambia | Africa | 23,062 | 117 | 97.0 | 3.0 | 97.9 | 2.1 | 247.8 | 17.6 |
Zimbabwe * | Africa | 20,898 | 115 | 97.6 | 2.4 | 98.1 | 1.9 | 129.4 | 18.6 |
To keep the above chart compact the country names were stripped from the territories or other subnational areas. Here is that info as provided by World Prison Brief:
In addition to the numbers referenced in the main table, [8] see info about additional detainees, and alleged detainees, at Immigration detention in Australia and Punishment in Australia.
In addition to the numbers referenced in the main table, [9] see info about additional detainees, and alleged detainees, at Re-education through labor, Laogai, and Xinjiang internment camps.
In addition to the numbers referenced in the main table, [10] see info about additional detainees, and alleged detainees, at Human rights in Cuba. Also at Law enforcement in Cuba.
World Prison Brief has limited info on Eritrea. [11]
World Prison Brief has limited info on North Korea. [12] See info about detainees, and alleged detainees, at Prisons in North Korea.
World Prison Brief has limited info on Somalia. [13]
The data source (World Prison Brief) does not list an incarceration rate for the United Kingdom as a whole, with its territories, and other subnational areas, etc.. In the main table see England and Wales, Northern Ireland, Scotland, Anguilla, Bermuda, Cayman Islands, Gibraltar, Guernsey, Isle of Man, Jersey, British Virgin Islands. A rate for the United Kingdom as a whole can be calculated by adding up their prison populations, and then dividing by their combined population.
Year | Male | Female | Total |
---|---|---|---|
1997 | 90,771 | 14,284 | 105,055 |
1999 | 92,985 | 14,508 | 107,493 |
2001 | 89,115 | 15,104 | 104,219 |
2003 | 81,975 | 14,556 | 96,531 |
2006 | 78,998 | 13,723 | 92,721 |
2007 | 75,017 | 11,797 | 86,814 |
2010 | 61,359 | 9,434 | 70,793 |
2011 | 53,079 | 8,344 | 61,423 |
2013 | 46,421 | 7,727 | 54,148 |
2015 | 40,750 | 7,293 | 48,043 |
2017 | 36,982 | 6,598 | 43,580 |
2019 | 31,064 | 5,415 | 36,479 |
The incarceration rate (per 100,000 population of all ages) is for inmates held in adult facilities in the United States. It does not include inmates in the custody of correctional facilities operated by departments of corrections in U.S. territories (American Samoa, Guam, and the U.S. Virgin Islands) and U.S. commonwealths (Northern Mariana Islands and Puerto Rico). [15] [16]
In addition, there were 36,479 juveniles in juvenile detention in 2019. [14] For more juvenile detention information and numbers, see Youth incarceration in the United States.
The incarceration rate in the U.S. varies greatly by U.S. state. See: List of U.S. states and territories by incarceration and correctional supervision rate. It also breaks it down to male and female incarceration rates by state. See also: Incarceration of women in the United States.
Incarceration in the United States is a primary form of punishment and rehabilitation for the commission of felony and other offenses. As of January 2023, the United States has the second largest prison population in the world, and the sixth highest per-capita incarceration rate. One out of every 5 people imprisoned across the world is incarcerated in the United States. In 2018, the United States had the highest incarceration rate in the world, with 698 people incarcerated per 100,000; this includes the incarceration rate for adults or people tried as adults. Prison, parole, and probation operations generate an $81 billion annual cost to U.S. taxpayers, with an additional $63 billion for policing. Court costs, bail bond fees, and prison phone fees generate another $38 billion in individual costs.
Prison rape commonly refers to the rape of inmates in prison by other inmates or prison staff. In 2001, Human Rights Watch estimated that at least 4.3 million inmates had been raped while incarcerated in the United States. A United States Department of Justice report, Sexual Victimization in Prisons and Jails Reported by Inmates, states that "In 2011–12, an estimated 4.0% of state and federal prison inmates and 3.2% of jail inmates reported experiencing one or more incidents of sexual victimization by another inmate or facility staff in the past 12 months or since admission to the facility, if less than 12 months." However, advocates dispute the accuracy of the numbers, saying they seem to under-report the real numbers of sexual assaults in prison, especially among juveniles.
Law enforcement in Japan is provided mainly by prefectural police under the oversight of the National Police Agency. The National Police Agency is administered by the National Public Safety Commission, ensuring that Japan's police are an apolitical body and free of direct central government executive control. They are checked by an independent judiciary and monitored by a free and active press.
The World Prison Brief at PrisonStudies.org is an online database providing free access to information on prison systems around the world. It is now hosted by the Institute For Crime & Justice Policy Research (ICPR), Birkbeck College, University of London.
Crime in the United States has been recorded since its founding. Crime rates have varied over time, with a sharp rise after 1900 and reaching a broad bulging peak between the 1970s and early 1990s. After 1992, crime rates began to fall year by year and have since declined significantly. This trend lasted until 2015, when crime rates began to rise slightly. This reversed in 2018 and 2019, but violent crime increased significantly again in 2020. Homicide rate in the U.S. continues to be high, with four major U.S. cities ranked among the 50 cities with the highest homicide rate in the world in 2019. Despite the increase in violent crime, particularly murders, between 2020 and 2021, the quantity of overall crime is still far below the peak of crime seen in the United States during the late 1980s and early 1990s, as other crimes such as rape, property crime and robbery continued to decline. The aggregate cost of crime in the United States remains high, with an estimated value of $4.9 trillion reported in 2021.
The penal system in China is mostly composed of an administrative detention system and a judicial incarceration system. As of 2020, it is estimated that 1.7 million people had been incarcerated in China, which is the second-highest prison population after the United States (USA). The country's per-capita incarceration rate is 121 per 100,000 of the national population. China also retained the use of death penalty with the approval of the Supreme People's Court, and there is a system of death penalty with reprieve in which the sentence is suspended unless the convict commits another major crime within two years while he or she is detained. Discussions have been held in which some people have urged the government to increase its use of community correction, and they have also urged the Ministry of Justice to oversee administrative detainees as a way to prevent the police from acquiring too much power.
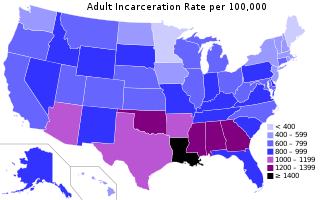
As of January 2023, the incarceration rate of the United States is the sixth highest in the world, at 505 per 100,000 people. Between 2019 and 2020, the United States saw a significant drop in the total number of incarcerations. State and federal prison and local jail incarcerations dropped by 14% from 2.1 million in 2019 to 1.8 million in mid-2020.
There are three types of prison in Turkey: closed, semi-open, and open. A further distinction is made between ordinary closed prisons and high-security prisons. Many prisons have separate blocks for women and some also for children (juveniles), but there are also some prisons which are exclusively for women or children. Prisoners in Turkey are divided, as in many other countries, into remand prisoners and convicted prisoners.
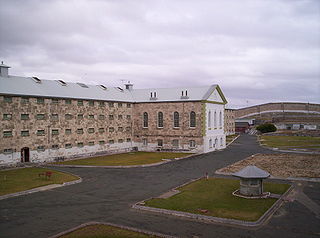
Punishment in Australia arises when an individual has been accused or convicted of breaking the law through the Australian criminal justice system. Australia uses prisons, as well as community corrections, When awaiting trial, prisoners may be kept in specialised remand centres or within other prisons.
This article discusses the incarceration of women in correctional facilities. As of 2013, across the world, 625,000 women and children were being held in penal institutions, and the female prison population was increasing in all continents. The list of countries by incarceration rate includes a main table with a column for the historical and current percentage of prisoners who are female.
The Federal Penitentiary Service is a federal agency of the Ministry of Justice of Russia responsible for correctional services.
Prison overcrowding is a social phenomenon occurring when the demand for space in prisons in a jurisdiction exceeds the capacity for prisoners. The issues associated with prison overcrowding are not new, and have been brewing for many years. During the United States' War on Drugs, the states were left responsible for solving the prison overcrowding issue with a limited amount of money. Moreover, federal prison populations may increase if states adhere to federal policies, such as mandatory minimum sentences. On the other hand, the Justice Department provides billions of dollars a year for state and local law enforcement to ensure they follow the policies set forth by the federal government concerning U.S. prisons. Prison overcrowding has affected some states more than others, but overall, the risks of overcrowding are substantial and there are solutions to this problem.
Prisons in Russia consist of four types of facilities: pre-trial institutions; educative or juvenile colonies; corrective colonies; and prisons.
Prisons, and their administration, is a state subject covered by item 4 under the State List in the Seventh Schedule of the Constitution of India. The management and administration of prisons falls exclusively in the domain of the State governments, and is governed by the Prisons Act, 1894 and the Prison manuals of the respective state governments. Thus, the states have the primary role, responsibility and authority to change the current prison laws, rules and regulations. The Central Government provides assistance to the states to improve security in prisons, for the repair and renovation of old prisons, medical facilities, development of borstal schools, facilities to women offenders, vocational training, modernization of prison industries, training to prison personnel, and for the creation of high security enclosures.
In 2016, the United States had the highest prison and jail population, and the highest incarceration rate in the world. According to the World Prison Population List there were around 10.35 million people in penal institutions worldwide in 2015. The US had 2,173,800 prisoners in adult facilities in 2015. That means the US held 21.0% of the world's prisoners in 2015, even though the US represented only around 4.4 percent of the world's population in 2015. By the end of 2020, the U.S. prison and jail population had decreased to 1,675,400, with an incarceration rate of 505 per 100,000 people. This left America with the second-largest prison population, behind China, and the sixth-highest incarceration rate.
The Department of Corrections is an agency of the Thai Ministry of Justice. Its mission is to keep prisoners in custody and rehabilitate them. Its headquarters is in Suanyai Sub-district, Mueang Nonthaburi District, Nonthaburi Province. As of 2020, Police Colonel Suchart Wongananchai is director-general of the department. Its FY2019 budget was 13,430 million baht.
Juvenile detention in the Northern Territory is administered by Territory Families, since a departmental reorganisation following the Labor victory at the August 2016 Northern Territory general election. Juvenile detention is mostly operated through two facilities - the Alice Springs Juvenile Holding Centre in Alice Springs, and the Don Dale Juvenile Detention Centre in eastern Darwin. These had previously been administered by the Department of Correctional Services. A juvenile is a child between the age of 10 and 17.
Norway's criminal justice system focuses on the principles of restorative justice and the rehabilitation of prisoners. Correctional facilities in Norway focus on maintaining custody of the offender and attempting to make them a functioning member of society. Norway's laws forbid the use of torture and other cruel, inhuman, or degrading treatment as punishment. Prison conditions typically meet international standards, and the government permits visits by any human rights observers. The system is considered to be transparent, and prisoners are represented by an ombudsman, an official appointed to investigate individuals’ complaints against public authority.
Incarceration in Oklahoma is how inmates are rehabilitated and reformed. Incarceration in Oklahoma includes state prisons and county and city jails. Oklahoma has the second highest state incarceration rate in the United States. Oklahoma is the second in women's incarceration in the United States. After becoming a state in 1907, the first prisons were opened and reform began.