Missouri's 8th congressional district

Last updated

Missouri's 8th congressional district
Missouri's 8th congressional district (since 2023).svg
Missouri's 8th congressional district
Interactive map of district boundaries since January 3, 2023
Representative
  Jason Smith
RSalem
Distribution
  • 61.71% rural
  • 38.29% urban
Population (2022)775,424
Median household
income
$53,903 [1]
Ethnicity
Cook PVI R+28 [2]

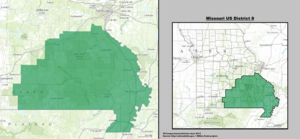
Missouri's 8th congressional district is one of 435 congressional districts in the United States and one of eight congressional districts in the state of Missouri. The district encompasses rural Southeast Missouri and South Central Missouri as well as some counties in Southwest Missouri. The district stretches from the Bootheel in the south to the St. Louis southern exurbs of Festus, Hillsboro, and surrounding areas in the Lead Belt; it ranges in the east to counties along the Mississippi River and in the west to counties along the Ozark Plateau near Branson. With a Cook Partisan Voting Index rating of R+28, it is the most Republican district in Missouri. [2]

Contents

Political history

The district's largest city is Cape Girardeau. A predominantly rural district, the district votes strongly Republican for national offices. In 2004, President George W. Bush received 63% of the vote in the district over U.S. Senator John Kerry (D-Massachusetts) who clinched 36%. In 2008, U.S. Senator John McCain (R-Arizona) carried the district with 61.92% over U.S. Senator Barack Obama (D-Illinois), who received 36.42%. The district increased the margin for Republicans in 2012 when former Governor Mitt Romney (R-Massachusetts) gained 65.88% of the vote over President Barack Obama's 31.99%. The district swung towards Republican Donald Trump in the 2016 presidential election. Trump garnered 75.4% of the vote, Democratic Nominee Hillary Clinton received just 21.0% of the vote, making it one of the most strongly Republican congressional districts in the United States.

Jason T. Smith, a Republican, has represented the district in the U.S. Congress since winning a special election on June 4, 2013. The incumbent Republican U.S. Representative Jo Ann Emerson resigned on January 22, 2013 to take a position as CEO for the National Rural Electric Cooperative Association.

Missouri lost one of its nine congressional district seats following redistricting based on population numbers from the 2010 U.S. census. The Republican-controlled state legislature decided to redefine Missouri's 3rd congressional district, which was represented by U.S. Representative Russ Carnahan (D-St. Louis). The district included all of Ste. Genevieve and Jefferson counties and southern St. Louis County and the neighborhoods making up what is known as South City of St. Louis. Missouri's 8th congressional district lost its Taney County parts (which were redistricted to the Southwestern-based 7th congressional district, and picked up all of Crawford and Ste. Genevieve counties, and most of the southern and western rural parts of Jefferson County. Parts of Jefferson County that are now included in Missouri's 8th include all of the cities of Hillsboro and De Soto, and the extreme southern portions of the Twin Cities of Festus and Crystal City (most of these two cities are now part of the 2nd congressional district).

List of members representing the district

MemberPartyYearsCong
ress
Electoral historyDistrict location
District created March 4, 1863
William A Hall.jpg
William A. Hall
(Huntsville)
Unionist March 4, 1863 –
March 3, 1865
38th Redistricted from the 3rd district and re-elected in 1862.
Retired.
JohnFBenjamin.jpg
John F. Benjamin
(Shelbyville)
Republican March 4, 1865 –
March 3, 1871
39th
40th
41st
Elected in 1864.
Re-elected in 1866.
Re-elected in 1868.
Retired.
James G. Blair
(Canton)
Liberal
Republican
March 4, 1871 –
March 3, 1873
42nd Elected in 1870.
Retired.
Abram Comingo.jpg
Abram Comingo
(Independence)
Democratic March 4, 1873 –
March 3, 1875
43rd Redistricted from the 6th district and re-elected in 1872.
Retired.
BJFranklin.jpg
Benjamin J. Franklin
(Kansas City)
Democratic March 4, 1875 –
March 3, 1879
44th
45th
Elected in 1874.
Re-elected in 1876.
Withdrew during renomination.
Samuel Locke Sawyer.jpg
Samuel L. Sawyer
(Independence)
Independent
Democratic
March 4, 1879 –
March 3, 1881
46th Elected in 1878.
Retired.
Hon. Robert T. Van Horn, Mo - NARA - 528304.jpg
Robert T. Van Horn
(Kansas City)
Republican March 4, 1881 –
March 3, 1883
47th Elected in 1880.
Lost re-election.
JohnJosephONeill.jpg
John J. O'Neill
(St. Louis)
Democratic March 4, 1883 –
March 3, 1889
48th
49th
50th
Elected in 1882.
Re-elected in 1884.
Re-elected in 1886.
Lost re-election.
Frederick G. Niedringhaus.png
Frederick G. Niedringhaus
(St. Louis)
Republican March 4, 1889 –
March 3, 1891
51st Elected in 1888.
Retired.
JohnJosephONeill.jpg
John J. O'Neill
(St. Louis)
Democratic March 4, 1891 –
March 3, 1893
52nd Elected in 1890.
Redistricted to 11th district .
Richard P. Bland - Brady-Handy.jpg
Richard P. Bland
(Lebanon)
Democratic March 4, 1893 –
March 3, 1895
53rd Redistricted from the 11th district and re-elected in 1892.
Lost re-election.
Joel D. Hubbard.jpg
Joel D. Hubbard
(Versailles)
Republican March 4, 1895 –
March 3, 1897
54th Elected in 1894.
Lost re-election.
Richard P. Bland - Brady-Handy.jpg
Richard P. Bland
(Lebanon)
Democratic March 4, 1897 –
June 15, 1899
55th
56th
Elected in 1896.
Re-elected in 1898.
Died.
VacantJune 15, 1899 –
August 29, 1899
56th
Dorsey W. Shackleford, Missouri Congressman.jpg
Dorsey W. Shackleford
(Jefferson City)
Democratic August 29, 1899 –
March 3, 1919
56th
57th
58th
59th
60th
61st
62nd
63rd
64th
65th
Elected to finish Bland's term.
Re-elected in 1900.
Re-elected in 1902.
Re-elected in 1904.
Re-elected in 1906.
Re-elected in 1908.
Re-elected in 1910.
Re-elected in 1912.
Re-elected in 1914.
Re-elected in 1916.
Lost renomination.
William Lester Nelson.jpg
William L. Nelson
(Columbia)
Democratic March 4, 1919 –
March 3, 1921
66th Elected in 1918.
Lost re-election.
Sidney C. Roach.jpg
Sidney C. Roach
(Linn Creek)
Republican March 4, 1921 –
March 3, 1925
67th
68th
Elected in 1920.
Re-elected in 1922.
Lost re-election.
William Lester Nelson.jpg
William L. Nelson
(Columbia)
Democratic March 4, 1925 –
March 3, 1933
69th
70th
71st
72nd
Elected in 1924.
Re-elected in 1926.
Re-elected in 1928.
Re-elected in 1930.
Redistricted to the at-large district and lost renomination.
District inactiveMarch 4, 1933 –
January 3, 1935
73rd All representatives elected At-large on a general ticket
Clyde Williams (Missouri Congressman).jpg
Clyde Williams
(Hillsboro)
Democratic January 3, 1935 –
January 3, 1943
74th
75th
76th
77th
Redistricted from the at-large district and re-elected in 1934.
Re-elected in 1936.
Re-elected in 1938.
Re-elected in 1940.
Lost re-election.
William P. Elmer
(Salem)
Republican January 3, 1943 –
January 3, 1945
78th Elected in 1942.
Lost re-election.
A.S.J.Carnahan1951.jpg
A. S. J. Carnahan
(Ellsinore)
Democratic January 3, 1945 –
January 3, 1947
79th Elected in 1944.
Lost re-election.
Parke M. Banta (Missouri Congressman).jpg
Parke M. Banta
(Arcadia)
Republican January 3, 1947 –
January 3, 1949
80th Elected in 1946.
Lost re-election.
A.S.J.Carnahan1951.jpg
A. S. J. Carnahan
(Ellsinore)
Democratic January 3, 1949 –
January 3, 1961
81st
82nd
83rd
84th
85th
86th
Elected in 1948.
Re-elected in 1950.
Re-elected in 1952.
Re-elected in 1954.
Re-elected in 1956.
Re-elected in 1958.
Lost renomination.
Ichord-Richard-1969.jpg
Richard H. Ichord II
(Houston)
Democratic January 3, 1961 –
January 3, 1981
87th
88th
89th
90th
91st
92nd
93rd
94th
95th
96th
Elected in 1960.
Re-elected in 1962.
Re-elected in 1964.
Re-elected in 1966.
Re-elected in 1968.
Re-elected in 1970.
Re-elected in 1972.
Re-elected in 1974.
Re-elected in 1976.
Re-elected in 1978.
Retired.
R Wendell Bailey.png
Wendell Bailey
(Willow Springs)
Republican January 3, 1981 –
January 3, 1983
97th Elected in 1980.
Redistricted to the 4th district and lost re-election.
BillEmerson.jpg
Bill Emerson
(Cape Girardeau)
Republican January 3, 1983 –
June 22, 1996
98th
99th
100th
101st
102nd
103rd
104th
Redistricted from the 10th district and re-elected in 1982.
Re-elected in 1984.
Re-elected in 1986.
Re-elected in 1988.
Re-elected in 1990.
Re-elected in 1992.
Re-elected in 1994.
Died.
1983–1993
[ data missing ]
1993–2003
[ data missing ]
VacantJune 22, 1996 –
November 5, 1996
104th
Jo Ann Emerson, Official Portrait, 111th Congress.jpg
Jo Ann Emerson
(Cape Girardeau)
Republican November 5, 1996 –
January 3, 1997
104th
105th
106th
107th
108th
109th
110th
111th
112th
113th
Elected to finish her husband's term.
Re-elected in 1996.
Re-elected in 1998.
Re-elected in 2000.
Re-elected in 2002.
Re-elected in 2004.
Re-elected in 2006.
Re-elected in 2008.
Re-elected in 2010.
Re-elected in 2012.
Resigned to become CEO of NRECA.
Independent January 3, 1997 –
January 8, 1997
Republican January 8, 1997 –
January 22, 2013
2003–2013
Missouri's 8th congressional district (since 2003).gif
VacantJanuary 22, 2013 –
June 5, 2013
113th
Jason Smith 116th Congress.jpg
Jason T. Smith
(Salem)
Republican June 5, 2013 –
present
113th
114th
115th
116th
117th
118th
Elected to finish Emerson's term.
Re-elected in 2014.
Re-elected in 2016.
Re-elected in 2018.
Re-elected in 2020.
Re-elected in 2022.
2013–2023
Missouri US Congressional District 8 (since 2013).tif
2023–present
Missouri's 8th congressional district (since 2023).svg

Election results from statewide races

YearOfficeResults
2000President George W. Bush 59 - Al Gore 39%
2004President George W. Bush 64 - John Kerry 36%
2008President John McCain 62 - Barack Obama 36%
2012President Mitt Romney 66 - Barack Obama 32%
2016President Donald Trump 75 - Hillary Clinton 21%
2020President Donald Trump 77 - Joe Biden 21%

Recent election results

2012

Missouri's 8th congressional district, 2012 [3]
PartyCandidateVotes%
Republican Jo Ann Emerson (incumbent) 216,083 71.93
Democratic Jack Rushin73,75524.55
Libertarian Rob Vandeven10,5533.51
Total votes300,391 100.00
Republican hold

2013 special

2013 Missouri 8th congressional district special election [4]
PartyCandidateVotes%
Republican Jason Smith 42,141 67.1
Democratic Steve Hodges17,20727.4
Constitution Doug Enyart2,2653.6
Libertarian Bill Slantz9681.5
Write-in 1850.3
Total votes62,766 100
Republican hold

2014

Missouri's 8th congressional district, 2014 [5]
PartyCandidateVotes%
Republican Jason Smith (incumbent) 106,124 66.6
Democratic Barbara Stocker38,72124.3
Independent Terry Hampton6,8214.3
Constitution Doug Enyart3,7992.4
Libertarian Rick Vandeven3,7592.4
Total votes159,224 100.0
Republican hold

2016

Missouri's 8th congressional district, 2016 [6]
PartyCandidateVotes%
Republican Jason Smith (incumbent) 229,792 74.4
Democratic Dave Cowell70,00922.7
Libertarian Jonathan Shell9,0702.9
Total votes308,871 100.0
Republican hold

2018

Missouri's 8th congressional district, 2018 [7]
PartyCandidateVotes%
Republican Jason Smith (incumbent) 194,042 73.4
Democratic Kathy Ellis66,15125.0
Libertarian Jonathan Shell4,2061.6
Total votes264,399 100.0
Republican hold

2020

Missouri's 8th congressional district, 2020 [8]
PartyCandidateVotes%
Republican Jason Smith (incumbent) 253,811 76.9
Democratic Kathy Ellis70,56121.4
Libertarian Tom Schmitz5,8541.8
Total votes330,226 100.0
Republican hold

Characteristics

Missouri's 8th is a relatively diverse congressional district. Although it is quite conservative and Republican-leaning at the federal level, Democrats formerly performed well here in local and state elections. Bill Clinton, a Democrat from neighboring Arkansas, carried the previous 8th district both times in 1992 and 1996; since then, however, voters in the district have solidly supported the past three Republican presidential nominees.

At the local level, Republicans control a majority of elected county offices in Southeast Missouri. In presidential elections, Democratic candidates formerly performed best in the Bootheel, an agricultural area that is the most impoverished region in the district (and the state, for that matter). It has a wide majority of whites and a significant minority of African Americans. Democrats also used to do well in the Lead Belt region, which contains a core constituency of voters who belong to labor unions, particularly in the mining industry.

The district takes in a large swath of the Bible Belt with evangelical Protestantism being the dominant religion in most counties in the district. This influence is demonstrated in conservative voters' positions on social issues such as abortion, gay rights and gun control. Racially, this district is predominantly white. Many voters here maintain a rural lifestyle where agriculture and farming are the backbone of the economy and are important issues of concern. Socioeconomically, it is the poorest district in Missouri (when measured by the median household income adjusted by inflation).

Counties

There are 28 counties included in the district.

Largest cities

The 10 largest cities in the district are as follows.

RankCityCountyPopulation (2010)Population (2015)Population (2020)
1 Cape Girardeau Cape Girardeau and Scott 37,94139,46239,540
2 Arnold Jefferson 20,87521,21320,858
3 Rolla Phelps 19,55920,01919,943
4 Farmington St. Francois 16,24018,18118,217
5 Sikeston Scott and New Madrid 16,31816,43616,291
6 Poplar Bluff Butler 17,02317,26616,225
7 Jackson Cape Girardeau 13,75814,86915,481
8 West Plains Howell 11,98612,28512,184
9 Festus Jefferson 11,59911,93812,722
10 Kennett Dunklin 10,93210,66210,515

Median household incomes

RankCountyIncome (2008)
1 Cape Girardeau $45,862
2 Perry $44,264
3 Taney $39,771
4 Scott $39,735
5 St. Francois $39,551
6 Phelps $37,243
7 Bollinger $36,744
8 Butler $34,422
9 Stoddard $33,120
10 Dent $32,991
11 New Madrid $32,758
12 Washington $32,001
13 Howell $31,761
14 Reynolds $31,546
15 Ozark $31,508
16 Douglas $31,335
17 Iron $31,276
18 Madison $31,137
19 Dunklin $30,927
20 Wright $30,685
21 Texas $29,260
22 Wayne $29,166
23 Mississippi $28,837
24 Carter $27,608
25 Ripley $27,285
26 Pemiscot $26,992
27 Oregon $26,119
28 Shannon $24,835

Median Family Incomes

RankCountyIncome (2008)
1 Cape Girardeau $58,037
2 Perry $53,034
3 Phelps $49,343
4 Scott $48,847
5 St. Francois $47,923
6 Taney $47,664
7 Bollinger $42,948
8 Butler $42,713
9 Stoddard $41,072
10 Dent $40,258
11 New Madrid $39,411
12 Dunklin $38,439
13 Washington $38,193
14 Madison $38,067
15 Howell $38,047
16 Iron $38,037
17 Reynolds $37,891
18 Wright $37,139
19 Douglas $36,648
20 Ozark $36,622
21 Mississippi $35,554
22 Wayne $34,727
23 Texas $34,503
24 Pemiscot $33,945
25 Carter $33,349
26 Ripley $33,101
27 Oregon $31,637
28 Shannon $30,102

Public school districts

School DistrictAddressCounty
Poplar Bluff R-I School District 1110 N. Westwood Blvd, Poplar Bluff Butler
Jackson R-II School District 614 E. Adams St., Jackson Cape Girardeau
Rolla Public School District No. 31 500a Forum Dr., Rolla Phelps
Cape Girardeau Public School District No. 63 301 N. Clark St., Cape Girardeau Cape Girardeau
Farmington R-VII School District 1022 Ste. Genevieve, Farmington St. Francois
Sikeston R-VI School District 1002 Virginia, Sikeston Scott
North St. Francois County R-I School District 300 Berry Road, Bonne Terre St. Francois
West Plains R-VII School District 613 W. First St., West Plains Howell
Potosi R-III School District 400 N. Mine, Potosi Washington
Perry County School District No. 32 326 College St., Perryville Perry
Dexter R-XI School District 1031 Brown Pilot Lane, Dexter Stoddard
Kennett Public School District No. 39 510 College Ave., Kennett Dunklin
St. Francois County Central R-III School District 200 High St., Park Hills St. Francois
Fredericktown R-I School District 704 E. State Highway 72, Fredericktown Madison
St. James R-I School District 122 E. Scioto St., St. James Phelps
New Madrid County Central R-I School District 310 U.S. Highway 61, New Madrid New Madrid
Doniphan R-I School District 309 Pine St., Doniphan Ripley
Mountain Grove R-III School District 207 E. Fifth (P.O. Box 806), Mountain Grove Wright
Salem R-80 School District 1409 W. Rolla Road, Salem Dent
Ava R-I School District 507 NE 3rd St. (P.O. Box 338), Ava Douglas
Caruthersville Public School District No. 18 1711 Ward St., Caruthersville Pemiscot
Willow Springs R-IV School District 215 W. Fourth St., Willow Springs Howell
Mountain View-Birch Tree R-III School District 1 Highway 60 East (P.O. Box 464), Mountain View Howell
Forsyth R-III School District 178 Panther St., Forsyth Taney
East Prairie R-II School District 304 E. Walnut, East Prairie Mississippi
Malden R-I School District 505 Burkhart St., Malden Dunklin
Charleston R-I School District 1014 S. Main (P.O. Box 39), Charleston Mississippi
Clearwater R-I School DistrictState Highway 34 (Rte. 4 Box 1004), Piedmont Wayne
Arcadia Valley R-II School District 750 Park Dr., Ironton Iron
West St. Francois County R-IV School District 1124 Main, Leadwood St. Francois
Houston R-I School District 423 W. Pine, Houston Texas
Twin Rivers R-X School District 9348 State Highway 51 (P.O. Box 146), Broseley Butler
Scott City R-I School District 3000 Main St., Scott City Scott
Scott County R-IV School District 4035 State Highway 77, Benton Scott
Woodland R-IV School District State Highway 34 (Rte. 5 Box 3210), Marble Hill Bollinger
Puxico R-VIII School District 481 N. Bedford St., Puxico Stoddard
Senath-Hornersville C-8 School District 803 S. State (P.O. Box 370), Senath Dunklin
Hayti R-II School District 500 N. Fourth (P.O. Box 469), Hayti Pemiscot
Licking R-VIII School District 125 College Ave. (P.O. Box 179), Licking Texas
Kingston K-14 School District 10047 Diamond Road, Cadet Washington
East Carter County R-II School District 24 S. Herren Ave., Ellsinore Carter
Portageville School District 904 King Ave., Portageville New Madrid
Cabool R-IV School District 1025 Rogers St. (P.O. Box 613), Cabool Texas
Hartville R-II School District 175 N. School Ave. (P.O. Box 460), Hartville Wright
Alton R-IV School District Rte. 2 Box 2180, Alton Oregon
Greenville R-II School District 127 Walnut (P.O. Box 320), Greenville Wayne
Bloomfield R-XIV School District 505 Court St., Bloomfield Stoddard
South Pemiscot County R-V School District 611 Beasley Road, Steele Pemiscot
Mansfield R-IV School District 316 W. Ohio Ave., Mansfield Wright
Thayer R-II School District 401 E. Walnut St., Thayer Oregon
Plato R-V School District 10645 Plato Dr., Plato Texas
Campbell R-II School District 801 S. State Route 53, Campbell Dunklin
Holcomb R-III School District 102 S. Cherry (P.O. Box 190), Holcomb Dunklin
Gainesville R-V School District [ permanent dead link ]HC03 Box 170, Gainesville Ozark
Neelyville R-IV School District 289 Broadway St. (P.O. Box 8), Neelyville Butler
Bismarck R-V School District 101 Dennis Dr., Bismarck St. Francois
Meadow Heights R-II School District State Highway 72 (Rte. 1 Box 2365), Patton Bollinger
Bernie R-XIII School District 516 W. Main, Bernie Stoddard
Southern Reynolds County R-II School District 1 School St., Ellington Reynolds
Chaffee R-II School District 517 W. Yoakum St., Chaffee Scott
Winona R-III School District Highway 19 (P.O. Box 248), Winona Shannon
Van Buren R-I School District 906 Broadway (P.O. Box 550), Van Buren Carter
Newburg R-II School District 701 Wolf Pride Dr., Newburg Phelps
Valley R-VI School District 1 Viking Dr., Caledonia Washington
Advance R-IV School District 19805 State Highway 91 (P.O. Box 370), Advance Stoddard
Iron County C-4 School District State Highway 49 #35 (P.O. Box 368), Viburnum Iron
Naylor R-II School District Rte. 2 Box 512, Naylor Ripley
Southland C-9 School District 500 S. Main, Cardwell Dunklin
Summersville R-II School District 400 Rogers St. (P.O. Box 198), Summersville Texas
Bakersfield R-IV School District 1201 O Highway (P.O. Box 38), Bakersfield Ozark
Norwood R-I School District 675 N. Hawk Ave., Norwood Wright
Oran R-III School District 310 Church St. (P.O. Box 250), Oran Scott
Scott County Central School District 20794 U.S. Highway 61, Sikeston Scott
Dora R-III School District Highway 181 South (P.O. Box 14), Dora Ozark
South Iron County R-I School District 210 School St., Annapolis Iron
Gideon Public School District No. 37 400 Main St. (P.O. Box 227), Gideon New Madrid
Oak Ridge R-VI School District 4198 State Highway E (P.O. Box 10), Oak Ridge Cape Girardeau
Clarkton C-4 School District State Highway 162 (P.O. Box 637), Clarkton Dunklin
Cooter R-IV School District 1867 State Highway E (P.O. Box 218), Cooter Pemiscot
Eminence R-I School District 1 Redwing Dr. (P.O. Box 730), Eminence Shannon
Delta R-V School District [ permanent dead link ]324 Liberty St. (P.O. Box 787), Delta Cape Girardeau
Richland R-I School District 24456 State Highway 114, Essex Stoddard
North Pemiscot County R-I School District 102 School Dr. (P.O. Box 38), Wardell Pemiscot
Lesterville R-IV School District State Highway 21 (P.O. Box 120), Lesterville Reynolds
Oregon-Howell R-III School District School Street (P.O. Box 398), Koshkonong Oregon
Delta C-7 School District 20 Charger Lane (P.O. Box 297), Deering Pemiscot
Bunker R-III School District State Highway 72 (P.O. Box 365), Bunker Reynolds
Bradleyville R-I School District16474 N. State Highway 125 (P.O. Box 20), Bradleyville Taney
Zalma R-V School District School Street (HC02 Box 184), Zalma Bollinger
Bell City R-II School District 25254 Walnut St., Bell City Stoddard
Couch R-II School District Rte. 1 Box 1187, Myrtle Oregon
Lutie R-VI School District HC04 Box 4775, Theodosia Ozark
Leopold R-III School District 100 Main St. (P.O. Box 39), Leopold Bollinger
Marquand-Zion R-VI School District 205 E. Morley St., Marquand Madison
Risco R-II School District State Highway 62 (P.O. Box 17), Risco New Madrid
Fox C-6 School District 745 Jeffco Blvd., Arnold Jefferson
Windsor School District 6208 US Hwy 61-67, Imperial Jefferson
Festus R-7 School District 1515 Mid-Meadow Ln., Festus Jefferson
Crystal City 47 School District 1100 Mississippi Ave., Crystal City Jefferson
Dunklin R-5 School District 497 Joachim Ave., Herculaneum Jefferson
Jefferson R-7 School District 1250 Dooling Hollow Rd, Festus Jefferson

Public Universities

Community Colleges

Election results from presidential races, by county

2000

County George W. Bush % Al Gore % Ralph Nader %Others%Margin%Total
Bollinger 3,48765.87%1,69231.96%410.77%741.40%−1,795R+ 33.91%5,294
Butler 9,11163.28%4,99634.70%1491.03%1410.99%−4,115R+ 28.58%14,397
Cape Girardeau 19,83266.42%9,33431.26%3761.26%3171.06%−10,498R+ 35.16%29,859
Carter 1,73061.61%99735.51%401.42%411.46%−733R+ 26.10%2,808
Crawford 4,75457.26%3,35040.35%1001.20%981.19%−1,404R+ 16.91%8,302
Dent 3,99666.73%1,83930.71%661.10%871.46%−2,157R+ 36.02%5,988
Dunklin 5,42651.55%4,94747.00%780.74%740.70%−479R+ 4.55%10,525
Howell 9,01864.07%4,64132.97%1971.40%2191.56%−4,377R+ 31.10%14,075
Iron 2,23750.68%2,04446.31%641.45%691.56%−193R+ 4.37%4,414
Madison 2,46056.25%1,82841.80%420.96%430.99%−632R+ 14.45%4,373
Mississippi 2,39545.93%2,75652.85%290.56%350.67%−361D+ 6.92%5,215
New Madrid 3,41647.01%3,73851.45%450.62%670.92%−322D+ 4.44%7,266
Oregon 2,52159.56%1,56837.04%601.42%841.98%−953R+ 22.52%4,233
Pemiscot 2,75045.38%3,24553.55%370.61%280.46%−495D+ 8.17%6,060
Perry 4,66767.61%2,08530.20%701.01%811.17%−2,582R+ 37.41%6,903
Phelps 9,44458.49%6,26238.78%2531.57%1871.16%−3,182R+ 19.71%16,146
Reynolds 1,76256.28%1,29841.46%421.34%290.92%−464R+ 14.82%3,131
Ripley 3,12161.62%1,82035.93%581.15%661.30%−1,301R+ 25.69%5,065
Scott 8,99957.30%6,45241.09%1130.72%1300.83%−2,547R+ 16.21%15,704
Shannon 2,24559.38%1,43037.82%481.27%581.53%−815R+ 21.56%3,781
St. Francois 9,32749.50%9,07548.17%2651.41%1740.93%−252R+ 1.33%18,841
Stoddard 7,72762.04%4,47635.94%1140.92%1371.10%−3,251R+ 26.10%12,454
Texas 6,13661.78%3,48635.10%1371.38%1731.74%−2,650R+ 26.68%9,932
Washington 4,02048.64%4,04748.97%951.15%1031.25%−27D+ 0.33%8,265
Wayne 3,34657.22%2,38740.82%550.94%601.03%−959R+ 16.40%5,848
Wright 5,39168.75%2,25028.70%861.10%1141.45%−3,141R+ 40.05%7,841
District Total139,31858.85%92,04338.88%2,6601.12%2,6891.14%47,275R+ 19.97%236,720

2004

County George W. Bush % John Kerry %Others%Margin%Total
Bollinger 4,10269.58%1,75429.75%390.63%−2,348R+ 39.83%5,895
Butler 11,69671.14%4,66628.38%790.48%−7,030R+ 42.76%16,441
Cape Girardeau 23,81468.90%10,56830.57%1830.53%−13,246R+ 38.33%34,565
Carter 1,79764.66%96434.69%180.64%−833R+ 29.97%2,779
Dent 4,36969.31%1,86529.58%701.12%−2,504R+ 39.73%6,304
Douglas 4,49871.09%1,74127.52%881.39%−2,757R+ 43.57%6,327
Dunklin 6,72057.55%4,90141.97%560.48%−1,819R+ 15.58%11,677
Howell 11,09767.75%5,11831.25%1641.00%−5,979R+ 36.50%16,379
Iron 2,47752.94%2,15746.10%450.96%−320R+ 6.84%4,679
Madison 2,90559.07%1,97240.10%410.84%−933R+ 18.97%4,918
Mississippi 2,90354.79%2,37444.81%210.40%−529R+ 9.98%5,298
New Madrid 4,15452.54%3,71647.00%370.47%−438R+ 5.54%7,907
Oregon 2,76959.26%1,82339.01%811.74%−946R+ 20.25%4,673
Ozark 3,08365.50%1,56133.16%631.34%−1,522R+ 32.34%4,707
Pemiscot 3,39849.93%3,38149.68%270.40%−17R+ 0.25%6,806
Perry 5,58367.70%2,62131.78%430.52%−2,962R+ 35.92%8,247
Phelps 11,87463.50%6,66635.65%1600.75%−5,208R+ 27.85%18,700
Reynolds 1,89656.36%1,44943.07%190.57%−447R+ 13.29%3,364
Ripley 3,69365.33%1,90733.73%530.94%−1,786R+ 31.60%5,653
Scott 11,33064.94%6,05734.71%610.35%−5,273R+ 30.23%17,448
Shannon 2,51160.26%1,61838.83%380.92%−893R+ 21.43%4,167
St. Francois 12,08752.71%10,74846.87%980.43%−1,339R+ 5.84%22,933
Stoddard 9,24269.74%3,94629.78%640.48%−5,296R+ 39.96%13,252
Taney* 3,49667.53%1,64431.76%370.71%−1,852R+ 35.77%5,177
Texas 7,23465.66%3,66433.25%1201.09%−3,570R+ 32.41%11,018
Washington 4,64150.57%4,45948.58%780.84%−182R+ 1.99%9,178
Wayne 3,91963.17%2,25036.27%350.57%−1,669R+ 26.90%6,204
Wright 6,09072.97%2,18826.22%680.82%−3,902R+ 46.75%8,346
District Total173,37863.50%97,77835.81%1,8860.69%75,600R+ 27.69%273,042

2008

County John McCain % Barack Obama %Others%Margin%Total
Bollinger 3,97268.67%1,69029.22%1222.11%−2,282R+ 39.45%5,784
Butler 11,80568.09%5,31630.66%2171.25%−6,489R+ 37.43%17,338
Cape Girardeau 24,76866.30%12,20832.68%3791.01%−12,560R+ 33.62%37,446
Carter 1,84063.49%98433.95%742.55%−856R+ 29.54%2,898
Dent 4,65567.78%2,05629.94%1572.29%−2,599R+ 37.84%6,868
Douglas 4,40565.63%2,14031.88%1672.49%−2,265R+ 33.75%6,712
Dunklin 7,04459.88%4,54038.59%1801.53%−2,504R+ 21.29%11,764
Howell 10,98264.49%5,73633.68%3111.83%−5,246R+ 30.81%17,029
Iron 2,09047.35%2,21350.14%1112.51%−123D+ 2.79%4,414
Madison 2,89757.62%2,04240.61%891.77%−855R+ 17.01%5,028
Mississippi 3,03456.65%2,24741.95%751.40%−787R+ 14.70%5,356
New Madrid 4,59356.76%3,37041.65%1291.59%−1,223R+ 15.11%8,092
Oregon 2,65257.77%1,81139.45%1282.78%−841R+ 18.32%4,591
Ozark 2,91862.27%1,66135.45%1072.28%−1,257R+ 26.82%4,686
Pemiscot 3,95456.11%3,02942.98%640.91%−925R+ 13.13%7,047
Perry 5,52763.92%3,00534.75%1151.33%−2,522R+ 29.17%8,647
Phelps 11,70660.22%7,39438.04%3381.74%−4,312R+ 22.18%19,524
Reynolds 1,78254.21%1,41843.14%872.65%−364R+ 11.07%3,287
Ripley 3,40763.53%1,79533.47%1613.00%−1,612R+ 30.06%5,363
Scott 11,56364.15%6,25834.72%2051.13%−5,305R+ 29.43%18,082
Shannon 2,07554.06%1,63742.65%1263.29%−438R+ 11.41%3,838
St. Francois 12,66051.57%11,54047.01%3501.42%−1,120R+ 4.56%24,550
Stoddard 9,17269.16%3,89929.40%1911.44%−5,273R+ 39.76%13,262
Taney* 2,13867.62%97930.96%451.42%−1,159R+ 36.66%3,162
Texas 7,21566.49%3,41031.43%2262.08%−3,805R+ 35.06%10,851
Washington 4,70648.95%4,71149.00%1972.05%−5D+ 0.05%9,614
Wayne 3,78461.49%2,24336.45%1272.06%−1,541R+ 25.04%6,154
Wright 5,78467.94%2,55730.03%1732.03%−3,227R+ 37.91%8,514
District Total174,56461.92%102,68236.42%4,6881.66%71,882R+ 25.50%281,934

2012

County Mitt Romney % Barack Obama %Others%Margin%Total
Bollinger 4,09575.05%1,21322.23%1482.72%−2,882R+ 52.82%5,456
Butler 12,24872.52%4,36325.83%2781.65%−7,885R+ 46.69%16,889
Cape Girardeau 25,37070.81%9,72827.15%7312.04%−15,642R+ 43.66%35,829
Carter 1,97870.67%75426.94%672.39%−1,224R+ 43.73%2,799
Crawford 6,43467.17%2,95130.81%1942.03%−3,483R+ 36.36%9,579
Dent 4,88373.51%1,58523.86%1752.63%−3,298R+ 49.65%6,671
Douglas 4,64970.90%1,71026.08%1983.02%−2,939R+ 44.82%6,557
Dunklin 6,85064.31%3,63634.14%1651.55%−3,214R+ 30.17%10,651
Howell 11,54470.62%4,39526.89%4072.49%−7,149R+ 43.73%16,346
Iron 2,25255.87%1,66941.40%1102.73%−583R+ 14.47%4,031
Jefferson* 14,60855.18%11,27742.59%5912.23%−3,331R+ 12.59%26,476
Madison 3,22765.46%1,58832.21%1152.33%−1,639R+ 33.25%4,930
Mississippi 2,99760.91%1,85837.76%651.33%−1,139R+ 23.15%4,920
New Madrid 4,28459.09%2,81438.81%1522.10%−1,470R+ 20.28%7,250
Oregon 2,88665.28%1,41932.10%1162.62%−1,467R+ 33.18%4,421
Ozark 3,08069.17%1,26128.32%1122.51%−1,819R+ 40.85%4,453
Pemiscot 3,59856.80%2,67142.16%661.04%−927R+ 14.64%6,335
Perry 5,66970.98%2,18427.34%1341.68%−3,485R+ 43.64%7,987
Phelps 11,89565.05%5,79831.71%5933.24%−6,097R+ 33.34%18,286
Reynolds 1,93160.31%1,15736.13%1143.56%−774R+ 24.18%3,202
Ripley 3,74371.12%1,39626.52%1242.36%−2,347R+ 44.60%5,263
Scott 11,62368.37%5,12230.13%2541.50%−6,501R+ 38.24%16,999
Shannon 2,26261.27%1,30235.27%1283.46%−960R+ 26.00%3,692
St. Francois 13,24858.67%8,82939.10%5052.23%−4,419R+ 19.57%22,705
Ste. Genevieve 4,05550.25%3,81347.25%2022.50%−242R+ 3.00%8,070
Stoddard 9,49673.81%3,15324.51%2171.68%−6,343R+ 49.30%12,866
Texas 7,61870.77%2,87126.67%2752.56%−4,747R+ 44.10%10,764
Washington 5,07158.32%3,41739.30%2072.38%−1,654R+ 19.02%8,695
Wayne 3,79066.26%1,81331.70%1172.04%−1,977R+ 34.56%5,720
Wright 5,83073.29%1,95324.55%1722.16%−3,877R+ 48.74%7,955
District Total201,21465.88%97,70031.99%6,5232.13%103,514R+ 33.89%305,437

2008 Democratic Presidential Primary

County Hillary Clinton % Barack Obama % John Edwards %Others%Margin%Total
Bollinger 97174.12%29322.37%382.90%80.61%−678C+ 51.75%1,310
Butler 2,49069.87%96026.94%822.30%320.90%−1,530C+ 42.93%3,564
Cape Girardeau 4,51056.55%3,14539.44%2473.10%730.92%−1,365C+ 17.11%7,975
Carter 54175.24%13719.05%324.45%50.70%−404C+ 56.19%719
Dent 96262.23%49331.89%744.79%171.10%−469C+ 30.34%1,546
Douglas 82762.32%45434.21%392.94%70.53%−373C+ 28.11%1,327
Dunklin 2,58778.44%60418.31%692.09%381.15%−1,983C+ 60.13%3,298
Howell 2,30764.07%1,16832.44%992.75%270.75%−1,139C+ 31.63%3,601
Iron 1,18070.53%40624.27%724.30%150.90%−774C+ 46.26%1,673
Madison 97168.72%34424.35%644.53%342.40%−627C+ 44.37%1,413
Mississippi 1,09465.43%50230.02%573.41%191.14%−592C+ 35.41%1,672
New Madrid 1,80171.19%61024.11%1013.99%180.71%−1,191C+ 47.08%2,530
Oregon 98971.77%33224.09%423.05%151.09%−657C+ 47.68%1,378
Ozark 68965.62%33231.62%181.71%111.05%−357C+ 34.00%1,050
Pemiscot 1,27070.83%46625.99%341.90%231.28%−804C+ 44.84%1,793
Perry 1,18061.24%65033.73%814.20%160.83%−530C+ 27.51%1,927
Phelps 2,39253.93%1,87842.34%1222.75%430.97%−514C+ 11.59%4,435
Reynolds 74166.22%27724.75%706.26%312.77%−464C+ 41.47%1,119
Ripley 1,07374.20%28219.50%724.98%191.31%−791C+ 54.70%1,446
Scott 2,93163.43%1,44331.23%1914.13%561.22%−1,488C+ 32.20%4,621
Shannon 91469.72%32324.64%503.81%241.83%−591C+ 45.08%1,311
St. Francois 5,41870.25%1,99325.84%2242.90%781.01%−3,425C+ 44.41%7,713
Stoddard 2,22572.95%68422.43%1123.67%290.95%−1,541C+ 50.52%3,050
Taney* 1,21962.51%67434.56%392.00%180.92%−545C+ 27.95%1,950
Texas 1,85868.03%74327.21%1013.70%291.06%−1,115C+ 40.82%2,731
Washington 2,34574.63%67021.32%1003.18%270.86%−1,675C+ 53.31%3,142
Wayne 1,45875.94%35918.70%713.70%321.66%−1,099C+ 57.24%1,920
Wright 1,14369.48%45227.48%362.19%140.85%−691C+ 42.00%1,645
District Total48,08666.92%20,67428.77%2,3373.25%7621.06%27,412C+ 38.15%71,859

2008 Republican Presidential Primary

County Mike Huckabee % John McCain % Mitt Romney % Ron Paul %Others%Margin%Total
Bollinger 65739.72%51831.32%38423.22%653.93%301.81%−139H+ 8.04%1,654
Butler 2,21548.85%1,11724.64%1,00722.21%1342.96%611.35%−1,098H+ 24.21%4,534
Cape Girardeau 3,06827.63%3,52831.77%3,92235.32%3613.25%2262.04%−394R+ 3.55%11,105
Carter 37352.39%20228.37%10715.03%243.37%60.84%−171H+ 24.02%712
Dent 95948.78%44222.48%41120.91%1276.46%271.37%−517H+ 26.30%1,966
Douglas 1,34355.04%51621.15%27011.07%29512.09%160.66%−827H+ 33.89%2,440
Dunklin 1,30958.52%48021.46%38117.03%361.61%311.39%−829H+ 37.06%2,237
Howell 2,88252.97%1,34724.76%79314.57%3566.54%631.16%−1,535H+ 28.21%5,441
Iron 35443.17%26932.80%13816.83%435.24%161.95%−85H+ 10.37%820
Madison 56043.96%45235.48%18514.52%514.00%262.04%−108H+ 8.48%1,274
Mississippi 47142.59%37333.73%22620.43%151.36%211.90%−98H+ 8.86%1,106
New Madrid 65648.74%38628.68%25018.57%433.19%110.82%−270H+ 20.06%1,346
Oregon 69658.88%24220.47%13411.34%1018.54%90.76%−454H+ 38.41%1,182
Ozark 76648.09%42826.87%23514.75%1499.35%150.94%−338H+ 21.22%1,593
Pemiscot 56557.59%23323.75%14915.19%202.04%141.43%−332H+ 33.84%981
Perry 57525.76%97343.59%54224.28%964.30%462.06%−398M+ 17.83%2,232
Phelps 1,72835.15%1,45929.68%1,34027.26%3216.53%681.38%−269H+ 5.47%4,916
Reynolds 28346.09%20232.90%9315.15%254.07%111.79%−81H+ 13.19%614
Ripley 75053.84%32923.62%23817.09%523.73%241.72%−421H+ 30.22%1,393
Scott 1,54936.79%1,38932.99%1,07625.56%1132.68%831.97%−160H+ 3.80%4,210
Shannon 51554.44%22323.57%838.77%10911.52%161.69%−292H+ 30.87%946
St. Francois 1,63135.90%1,72738.01%94920.89%1342.95%1022.25%−96M+ 2.11%4,543
Stoddard 1,57150.56%77224.85%64320.70%912.93%300.97%−799H+ 25.71%3,107
Taney* 1,82155.89%84425.91%46214.18%922.82%401.23%−977H+ 29.98%3,258
Texas 1,72750.13%95427.69%48013.93%2346.79%501.45%−773H+ 22.44%3,445
Washington 62238.73%61638.36%29718.49%503.11%211.31%−6H+ 0.37%1,606
Wayne 74045.20%49930.48%32319.73%462.81%291.77%−241H+ 14.72%1,637
Wright 1,87859.64%74623.69%2989.46%1785.65%491.56%−1,132H+ 35.95%3,149
District Total32,26443.93%21,26628.95%15,41620.99%3,3614.58%1,1411.55%10,998H+ 14.98%73,447

See also

Related Research Articles

<span class="mw-page-title-main">Wayne County, Missouri</span> County in Missouri, United States

Wayne County is a county located in the Ozark foothills in the U.S. state of Missouri. As of the 2020 census, the population was 10,974. The county seat is Greenville. The county was officially organized on December 11, 1818, and is named after General "Mad" Anthony Wayne, who served in the American Revolution. As of August 28, 2023, Wayne County is designated the UFO Capital of Missouri, along with the city of Piedmont.

<span class="mw-page-title-main">Taney County, Missouri</span> County in Missouri, United States

Taney County is a county in the southwestern portion of the U.S. state of Missouri. As of the 2020 census, the population was 56,066. Its county seat is Forsyth. It is included in the Branson, Missouri, Micropolitan Statistical Area.

<span class="mw-page-title-main">Stone County, Missouri</span> County in Missouri, United States

Stone County is located in the southwestern portion of the U.S. state of Missouri. As of the 2020 census, the population was 31,076. Its county seat is Galena.

<span class="mw-page-title-main">Reynolds County, Missouri</span> County in Missouri, United States

Reynolds County is a county located in the Ozark Foothills Region in the Lead Belt of Missouri. As of the 2020 census, the population was 6,096. Its county seat is Centerville. The county was officially organized on February 25, 1845, and was named in honor of former Governor of Missouri Thomas Reynolds.

<span class="mw-page-title-main">Ozark County, Missouri</span> County in Missouri, United States

Ozark County is a county in the southern portion of the U.S. state of Missouri. As of the 2020 census, the population was 8,553. The largest city and county seat is Gainesville. The county was organized as Ozark County, named after the Ozark Mountains, on January 29, 1841. It was renamed Decatur County, after Commodore Stephen Decatur, from 1843 to 1845, after which the name Ozark County was restored.

<span class="mw-page-title-main">Jefferson County, Missouri</span> County in Missouri, United States

Jefferson County is located in the eastern portion of the U.S. state of Missouri. It is a part of the St. Louis Metropolitan Area. As of the 2020 census, the population was 226,739, making it the sixth-most populous county in Missouri. Its county seat is Hillsboro. The county was organized in 1818 and named in honor of former president Thomas Jefferson.

<span class="mw-page-title-main">Iron County, Missouri</span> County in Missouri, United States

Iron County is a county located in the Lead Belt region in the U.S. state of Missouri. As of the 2020 census, the population was 9,537. The largest city and county seat is Ironton. Iron County was officially organized on February 17, 1857, and was named after the abundance of iron ore found within its borders.

<span class="mw-page-title-main">Howell County, Missouri</span> County in Missouri, United States

Howell County is in southern Missouri. As of the 2020 census, the population was 39,750. The largest city and county seat is West Plains. The county was officially organized on March 2, 1851, and is named after Josiah Howell, a pioneer settler in the Howell Valley.

<span class="mw-page-title-main">Harrison County, Missouri</span> County in Missouri, United States

Harrison County is a county located in the northwest portion of the U.S. state of Missouri. As of the 2020 census, the population was 8,157. It's county seat is Bethany. The county was organized February 14, 1845 and named for U.S. Representative Albert G. Harrison of Missouri.

<span class="mw-page-title-main">Gasconade County, Missouri</span> County in Missouri, United States

Gasconade County is a county located in the east-central portion of the U.S. state of Missouri. As of the 2020 census, the population was 14,794. The county seat has been Hermann since 1842. The county was named after the Gasconade River.

<span class="mw-page-title-main">Dunklin County, Missouri</span> County in Missouri, United States

Dunklin County is located in the Bootheel of the U.S. state of Missouri. As of the 2020 census, the population was 28,283. The largest city and county seat is Kennett. The county was officially organized on February 14, 1845, and is named in honor of Daniel Dunklin, a Governor of Missouri who died the year before the county was organized.

<span class="mw-page-title-main">Christian County, Missouri</span> County in Missouri, United States

Christian County is located in the southwestern part of the U.S. state of Missouri. As of the 2020 census, its population was 88,842. Its county seat is Ozark. The county was organized in 1859 and is named after Christian County, Kentucky, it being named for William Christian, a Kentucky soldier of the American Revolutionary War.

The government of the U.S. state of Missouri is organized into the state government and local government, including county government, and city and municipal government.

<span class="mw-page-title-main">Jo Ann Emerson</span> American politician (born 1950)

Jo Ann Emerson is an American politician who was the U.S. representative for Missouri's 8th congressional district from 1996 to 2013. The district consists of Southeast and South Central Missouri and includes the Bootheel, the Lead Belt and the Ozarks. Emerson is a member of the Republican Party. On January 22, 2013, Emerson resigned her seat in Congress to become the president and chief executive officer of the National Rural Electric Cooperative Association. She served as CEO until August 2015.

<span class="mw-page-title-main">2004 United States presidential election in Missouri</span> Election in Missouri

The 2004 United States presidential election in Missouri took place on November 2, 2004, and was part of the 2004 United States presidential election. Voters chose 11 representatives, or electors to the Electoral College, who voted for president and vice president.

<span class="mw-page-title-main">2008 Missouri Democratic presidential primary</span>

The 2008 Missouri Democratic presidential primary took place on Super Tuesday, February 5, 2008, with 72 delegates at stake. The winner in each of Missouri's nine congressional districts was awarded all of that district's delegates, which totaled 47. Another 25 delegates were awarded to the statewide winner, Barack Obama. The 72 delegates represented Missouri at the Democratic National Convention in Denver, Colorado. Sixteen other unpledged delegates, known as superdelegates, also attended the convention and cast their votes as well.

<span class="mw-page-title-main">2008 United States presidential election in Missouri</span> Election in Missouri

The 2008 United States presidential election in Missouri was held on November 4, 2008, and was part of the 2008 United States presidential election, which took place throughout all 50 states and D.C. Voters chose 11 representatives, or electors to the Electoral College, who voted for president and vice president.

<span class="mw-page-title-main">2012 United States presidential election in Ohio</span> Election in Ohio

The 2012 United States presidential election in Ohio took place on November 6, 2012, as part of the 2012 United States presidential election in which all 50 states plus the District of Columbia participated. Ohio voters chose 18 electors to represent them in the Electoral College via a popular vote pitting incumbent Democratic President Barack Obama and his running mate, Vice President Joe Biden, against Republican challenger and former Massachusetts Governor Mitt Romney and his running mate, Congressman Paul Ryan. This election continued Ohio's bellwether streak, as the state voted for the winner of the presidency in every election from 1964 to 2016.

<span class="mw-page-title-main">1968 United States presidential election in Missouri</span> Election in Missouri

The 1968 United States presidential election in Missouri took place on November 5, 1968. All 50 states and the District of Columbia were part of the 1968 United States presidential election. Voters chose 12 electors to the Electoral College, which selected the president and vice president.

<span class="mw-page-title-main">2020 United States House of Representatives elections in Missouri</span> House elections in Missouri

The 2020 United States House of Representatives elections in Missouri was held on November 3, 2020, to elect the eight U.S. representatives from the state of Missouri, one from each of the state's eight congressional districts. The elections coincided with the 2020 United States presidential election, as well as other elections to the House of Representatives, elections to the United States Senate and various state and local elections.

References

  1. "My Congressional District".
  2. 1 2 "2022 Cook PVI: District Map and List". Cook Political Report. Retrieved January 10, 2023.
  3. "State of Missouri - Election Night Results".
  4. "State of Missouri - Election Night Results".
  5. "State of Missouri - Election Night Results".
  6. "2016 General Election Official Results". Missouri Secretary of State. November 8, 2016. Retrieved November 30, 2016.
  7. Johnson, Cheryl L. (February 28, 2019). "Statistics of the Congressional Election of November 6, 2018". Clerk of the U.S. House of Representatives . Retrieved April 27, 2019.
  8. "All Results State of Missouri - State of Missouri - General Election, November 03, 2020". Missouri Secretary of State. Retrieved December 9, 2020.

37°11′39″N90°56′04″W / 37.19417°N 90.93444°W / 37.19417; -90.93444