| Texas's 11th congressional district | |
|---|---|
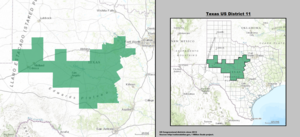
Interactive map of district boundaries | |
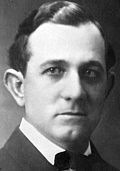
| Representative | |
| Distribution |
|
| Population (2024) | 802,030 [2] |
| Median household income | $71,363 [3] |
| Ethnicity |
|
| Cook PVI | R+22 [4] |


Texas's 11th congressional district of the United States House of Representatives is in the midwestern portion of the state of Texas, stretching from the Permian Basin through the Hill Country. Major cities in the district include: Andrews, Midland, Odessa, San Angelo, Killeen, and Brownwood. The current Representative from the 11th district is Republican August Pfluger.
Contents
- Composition
- List of members representing the district
- Recent election results from statewide races
- 2023–2027 boundaries
- 2027–2033 boundaries
- Recent election results
- Historical district boundaries
- See also
- References
Texas has had at least 11 districts since 1883. The current configuration dates from the 2003 Texas redistricting; its first congressman, Mike Conaway, took office in 2005. It is one of the most Republican districts in the nation. Much of the territory now in the district began shaking off its Democratic roots far sooner than the rest of Texas. For instance, Barry Goldwater did very well in much of this area in 1964, and Midland itself last supported a Democrat for president in 1948. While Democrats continued to hold most local offices here well into the 1980s and continued to represent parts of the region through the 1990s, today Republicans dominate every level of government, usually winning by well over 70 percent of the vote. There are almost no elected Democrats left above the county level.
It was President George W. Bush's strongest district in the entire nation in the 2004 election. Since its creation, the Republicans have never dropped below 75 percent of the vote. The Democrats have only put up a candidate five times, only one of whom has even won 20 percent of the vote.
Conaway retired at the end of his eighth term in 2021. Pfluger won the Republican primary to succeed him. With Republicans having a nearly 10-to-1 advantage in registration, he was all but assured of victory in the general election. [5]
From 1903-2005 the district was based in central Texas and contained Waco.
As part of the 2025 partisan redistricting, the 2026 election will now include parts of suburban Austin, Cedar Park Leander and Pflugerville while removing the parts of the district that stretched to Killeen.