Below is the full seat composition in Milton Keynes after each local election. The normal election pattern is that one-third of seats are re-elected every year except that there is (normally) no election every fourth year. In 1976, 1996, 2002 and 2014, the whole council was elected after boundary changes.[1][2][3][4][5] In 1991, ward boundaries were changed but the number of seats remained the same.[6][7] In 2026, the number of seats will increase to 60 and all seats will be contested.[8]
Table key
Administration in charge of council after election.
The composition of Milton Keynes Council following each election was as follows.
2002
2003
2004
2006
2007
2008
2010
2011
2012
Bletchley & Fenny Stratford
Lab 3
Lab 3
Lab 3
Lab 2/Con 1
Con 2/Lab 1
Con 3
Con 3
Con 3
Con 2/Lab 1
Bradwell
Lib 3
Lib 3
Lib 3
Lib 3
Lib 3
Lib 3
Lib 3
Lib 3
Lib 2/Lab 1
Campbell Park
Lib 3
Lib 3
Lib 3
Lib 3
Lib 3
Lib 3
Lib 3
Lib 3
Lib 2/Lab 1
Danesborough
Con 1
Con 1
Con 1
Con 1
Con 1
Con 1
Con 1
Con 1
Con 1
Denbigh
Lab 2
Lab 2
Lab 2
Lab 2
Lab 2
Lab 2
Lab 2
Lab 2
Lab 2
Eaton Manor
Lab 2
Lab 2
Lab 2
Lab 2
Lab 2
Lab 2
Lab 2
Lab 2
Lab 2
Emerson Valley
Lib 3
Lib 3
Lib 3
Lib 3
Lib 3
Lib 2/Con 1
Lib 2/Con 1
Con 2/Lib 1
Con 2/Lib 1
Furzton
Lib 2
Lib 2
Lib 2
Lib 2
Lib 2
Lib 2
Lib 2
Lib 2
Lib 2
Hanslope
Con 1
Con 1
Con 1
Con 1
Con 1
Con 1
Con 1
Con 1
Con 1
Linford North
Lib 2
Lib 2
Lib 2
Lib 1/Con 1
Lib 1/Con 1
Lib 1/Con 1
Lib 2
Lib 2
Lib 2
Linford South
Lib 2
Lib 2
Lib 2
Lib 1/Con 1
Lib 1/Con 1
Lib 1/Con 1
Lib 2
Lib 1/Con 1
Lib 1/Con 1
Loughton Park
Con 3
Con 3
Con 3
Con 3
Con 3
Con 3
Con 3
Con 3
Con 3
Middleton
Lib 2
Lib 2
Lib 2
Lib 2
Lib 1/Con 1
Lib 1/Con 1
Lib 1/Con 1
Lib 1/Con 1
Con 2
Newport Pagnell North
Lib 2
Lib 2
Lib 2
Lib 2
Lib 2
Lib 2
Lib 2
Lib 2
Lib 2
Newport Pagnell South
Lib 2
Lib 2
Lib 2
Lib 2
Lib 2
Lib 2
Lib 2
Lib 2
Lib 2
Olney
Lib 2
Lib 2
Lib 2
Lib 1/Con 1
Lib 1/Con 1
Con 2
Con 2
Con 2
Con 2
Sherington
Lib 1
Lib 1
Lib 1
Lib 1
Lib 1
Lib 1
Lib 1
Con 1
Con 1
Stantonbury
Lab 2
Lab 2
Lab 2
Lab 2
Lab 2
Lab 1/Con 1
Lab 1/Con 1
Lab 1/Con 1
Lab 2
Stony Stratford
Con 3
Con 3
Con 3
Con 3
Con 3
Con 3
Con 3
Con 3
Con 3
Walton Park
Lib 3
Lib 3
Lib 3
Lib 2/Con 1
Lib 2/Con 1
Lib 2/Con 1
Lib 3
Lib 2/Con 1
Con 2/Lib 1
Whaddon
Lab 2
Lab 2
Lab 2
Lab 2
Lab 2
Lab 2
Lab 2
Lab 2
Lab 2
Wolverton
Lab 3
Lab 3
Lab 3
Lab 3
Lab 3
Lab 2/Lib 1
Lab 2/Lib 1
Lab 2/Lib 1
Lab 3
Woughton
Lab 2
Lab 2
Lab 2
Lab 2
Lab 2
Lab 2
Lab 2
Lab 2
Lab 2
2014 to present
In 2014, the boundaries were revised so that there were 57 seats and each ward had three seats each [see below]. Elections were held for all seats in that year, before returning to the one-third model for subsequent years.
2014
2015
2016
2018
2019
2021
2022
2023
2024
Bletchley East
Lab 2/UKIP 1
Lab 3
Lab 3
Lab 3
Lab 3
Lab 3
Lab 3
Lab 3
Lab 3
Bletchley Park
Lab 2/Con 1
Lab 2/Con 1
Lab 2/Con 1
Con 2/Lab 1
Con 2/Lab 1
Con 3
Con 2/Lab 1
Lab 2/Con 1
Lab 3
Bletchley West
Lab 3
Lab 2/Con 1
Lab 2/Con 1
Lab 2/Con 1
Lab 3
Lab 2/Con 1
Lab 2/Con 1
Lab 2/Con 1
Lab 3
Bradwell
Lab 2/Lib 1
Lib 2/Lab 1
Lib 3
Lib 3
Lib 3
Lib 3
Lib 3
Lib 3
Lib 3
Broughton
Con 2/Lib 1
Con 2/Lib 1
Con 2/Lib 1
Con 2/Lib 1
Lib 2/Con 1
Lib 3
Lib 3
Lib 3
Lib 3
Campbell Park & Old Woughton
Lib 2/Con 1
Lib 2/Con 1
Lib 2/Con 1
Con 2/Lib 1
Lib 2/Con 1
Con 2/Lib 1
Lib 2/Con 1
Lib 2/Con 1
Lib 3
Central Milton Keynes
Lab 3
Lab 3
Lab 3
Lab 3
Lab 3
Lab 3
Lab 3
Lab 3
Lab 3
Danesborough & Walton
Con 3
Con 3
Con 3
Con 3
Con 3
Con 3
Con 3
Con 2/Lab 1
Con 2/Lab 1
Loughton & Shenley
Lab 2/Con 1
Lab 2/Con 1
Lab 2/Con 1
Con 2/Lab 1
Con 2/Lab 1
Con 2/Lab 1
Lab 2/Con 1
Lab 3
Lab 3
Monkston
Lib 3
Lib 2/Con 1
Lib 2/Con 1
Lib 2/Con 1
Lib 3
Lib 3
Lib 3
Lib 3
Lib 3
Newport Pagnell North & Hanslope
Con 3
Con 3
Con 3
Con 3
Con 3
Con 3
Con 3
Con 3
Con 3
Newport Pagnell South
Lib 3
Lib 3
Lib 3
Lib 3
Lib 3
Lib 2/Con 1
Lib 2/Con 1
Lib 2/Con 1
Lib 2/Con 1
Olney
Con 3
Con 3
Con 3
Con 3
Con 3
Con 3
Con 3
Con 2/Lab 1
Con 2/Lab 1
Shenley Brook End
Lib 3
Lib 2/Con 1
Lib 2/Con 1
Lib 2/Con 1
Lib 2/Con 1
Con 2/Lib 1
Con 2/Lib 1
Lib 2/Con 1
Lib 3
Stantonbury
Lab 3
Lab 2/Con 1
Lab 2/Con 1
Lab 2/Con 1
Lab 2/Con 1
Con 2/Lab 1
Con 2/Lab 1
Lab 2/Con 1
Lab 3
Stony Stratford
Lab 2/Con 1
Lab 2/Con 1
Lab 2/Con 1
Lab 2/Con 1
Lab 3
Lab 2/Con 1
Lab 2/Con 1
Lab 2/Con 1
Lab 2/Con 1
Tattenhoe
Con 3
Con 3
Con 3
Con 2/Lab 1
Con 2/Lab 1
Con 2/Lab 1
Con 3
Con 3
Con 3
Wolverton
Lab 3
Lab 3
Lab 3
Lab 3
Lab 3
Lab 3
Lab 3
Lab 3
Lab 3
Woughton & Fishermead
Lab 3
Lab 3
Lab 3
Lab 3
Lab 3
Lab 3
Lab 3
Lab 3
Lab 3
Borough result maps
Prior to 2014, not all wards had seats up at each election; those without elections are in white. In elections post-2014, just one of the three seats in each ward is being filled. These maps show the result for that single seat in the year given, though the whole ward is being balloted. It is not intended to show the overall representation, as given in the table above. To see an example of this, take the Olney ward: in 2023, Labour came first, taking the seat from Conservative; in 2024, Conservative came first, retaining its seat. The net effect was no change in the state of the parties with 2 CON, 1 LAB
2002 results map
2003 results map
2004 results map
2006 results map
2007 results map
2008 results map
2010 results map
2011 results map
2012 results map
2014 results map
2015 results map
2016 results map
2018 results map
2019 results map
2021 results map
2022 results map
2023 results map
2024 results map
Frequency
Population trend of borough and Urban Area 1801–2021
One third of the council is elected each year for 3 years, followed by one year without election, unless there is a substantial boundary change (when all seats are elected). Following an electoral review, changes to wards and an increase in the number of seats, 57 councillors were elected for all 19 wards from May 2014 onwards.[22] After the previous reorganisation in 2002, 51 councillors were elected from 23 wards.[23]
Wards
1973
The first elections to the newly created Milton Keynes Borough Council took place on 7 June 1973. There were 40 seats up for election spread over 16 Wards. All councillors were elected for three years.
1976
In November 1975, the Boundary Commission proposed new ward boundaries.[24] (These wards are generally larger than the civil parishes that give them their names. Some parishes are divided between wards. For details, see the Boundary Commission report.)
Bletchley Central
Danesborough
Denbigh
Eaton
Loughton
Newport Rural
Newport Urban
Newton
Petsoe Manor
Pineham
Sherington
Stantonbury
Stony Stratford
Watling
Whaddon
Wolverton
1996 to 2000
Between 1996 and 2000, there were 51 seats up for election. Boundary changes were made before the 2002 election but this did not affect the number of seats up for election.
2002 to 2012
Ward map 2010
From 2002 until the 2014 local elections, there were 23 wards in the Borough, which were represented by 51 councillors. The councillors corresponded to the wards in the following way:
There were 8 wards that represented by 3 councillors:
Following an electoral review and with effect from the 2014 Milton Keynes Council election in May 2014, there were 57 Councillors representing 19 wards, each with having 3 councillors.[25]
This page is based on this Wikipedia article Text is available under the CC BY-SA 4.0 license; additional terms may apply. Images, videos and audio are available under their respective licenses.
 2002 results map
 2003 results map
 2004 results map
 2006 results map
 2007 results map
 2008 results map
 2010 results map
 2011 results map
 2012 results map
 2014 results map
 2015 results map
 2016 results map
 2018 results map
 2019 results map
 2021 results map
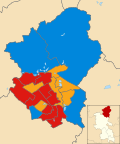 2022 results map
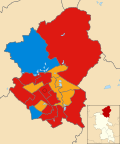 2023 results map
 2024 results map