Proportional representation (PR) refers to a type of electoral system under which subgroups of an electorate are reflected proportionately in the elected body. The concept applies mainly to geographical and political divisions of the electorate. The essence of such systems is that all votes cast - or almost all votes cast - contribute to the result and are actually used to help elect someone—not just a plurality, or a bare majority—and that the system produces mixed, balanced representation reflecting how votes are cast.

The additional member system (AMS) is a mixed electoral system under which most representatives are elected in single-member districts (SMDs), and the other "additional members" are elected to make the seat distribution in the chamber more proportional to the way votes are cast for party lists. It is distinct from parallel voting in that the "additional member" seats are awarded to parties taking into account seats won in SMDs, which is not done under parallel voting.
Mixed-member proportional representation is a mixed electoral system in which votes cast are considered in local elections and also to determine overall party vote tallies, which are used to allocate additional members to produce or deepen overall Proportional representation.
Electoral reform in New Zealand has, in recent years, become a political issue as major changes have been made to both parliamentary and local government electoral systems.
Parallel voting is a type of mixed electoral system in which representatives are voted into a single chamber using two or more different systems, most often first-past-the-post voting (FPTP) with party-list proportional representation (PR). It is the most common form of mixed member majoritarian representation (MMM), which is why these terms are often used synonymously with each other. In some countries, parallel voting is known as the supplementary member (SM) system, while in academic literature it is sometimes called the superposition method within mixed systems.
The Citizens' Assembly on Electoral Reform was established by the government of the province of Ontario, Canada in March 2006. Modelled on the British Columbia equivalent, it reviewed the first past the post electoral system currently in use to elect members of the Ontario Legislature, with the authority to recommend an alternative. In May 2007, the Assembly recommended, by a decision of 94–8, that Ontario adopt a form of mixed member proportional representation (MMP).

A referendum was held on October 10, 2007, on the question of whether to establish a mixed member proportional representation (MMP) system for elections to the Legislative Assembly of Ontario. The vote was strongly in favour of the existing plurality voting or first-past-the-post (FPTP) system.
The Royal Commission on the Electoral System was formed in New Zealand in 1985 and reported in 1986. The decision to form the Royal Commission was taken by the Fourth Labour government, after the Labour Party had received more votes, yet it won fewer seats than the National Party in both the 1978 and 1981 elections. It was also a reaction to the power displayed by Prime Minister Robert Muldoon, whose action of illegally abolishing the Superannuation scheme in 1975 without any repercussions highlighted the need to distribute power in a more democratic way. The Royal Commission's report Towards a Better Democracy was instrumental in effecting New Zealand to change its electoral system from first-past-the-post to mixed member proportional.
The New Zealand electoral system has been mixed-member proportional (MMP) since the 1996 election. MMP was introduced following a referendum in 1993. It replaced the first-past-the-post (FPP) system New Zealand had previously used for most of its history. New Zealanders elect their members of parliament (MPs) with two votes. The first vote is for a candidate from an electorate. The second vote is used to elect ranked party lists.
Voting in New Zealand was introduced after colonisation by British settlers. The first New Zealand Constitution Act was passed in 1852, and the first parliamentary elections were held the following year.
A referendum was held in the Canadian province of Prince Edward Island on November 28, 2005, to determine whether to adopt the Mixed Member Proportional (MMP) system as recommended by the Prince Edward Island Electoral Reform Commission in 2003.
The Electoral Reform Coalition (ERC) is a group advocating electoral reform in New Zealand. It was founded in 1986. The group has been reformed as the Campaign for MMP to fight to retain Mixed-member proportional representation at the 2011 referendum on the issue.
The 2011 New Zealand voting system referendum was a referendum on whether to keep the existing mixed member proportional (MMP) voting system, or to change to another voting system, for electing Members of Parliament to New Zealand's House of Representatives. It was held on 26 November 2011 in conjunction with the 2011 general election.

The 50th New Zealand Parliament was elected at the 2011 general election. It had 121 members, and was in place from December 2011 until September 2014, followed by the 2014 general election. The first sitting of the 50th Parliament was held on 20 December 2011, where members were sworn in and Lockwood Smith was elected Speaker of the House. This was followed by the speech from the throne on 21 December. John Key continued to lead the Fifth National Government. Following the resignation of Smith, David Carter was elected Speaker.
A mixed electoral system or mixed-member electoral system combines methods of majoritarian and proportional representation (PR). The majoritarian component is usually first-past-the-post voting (FPTP/SMP), whereas the proportional component is most often based on party-list PR. The results of the combination may be mixed-member proportional (MMP), where the overall results of the elections are proportional, or mixed-member majoritarian, in which case the overall results are semi-proportional, retaining disproportionalities from the majoritarian component.

A referendum on electoral reform took place by mail-in ballot between October 22 and December 7, 2018, in the Canadian province of British Columbia. 61.3 percent of voters supported maintaining the first-past-the-post voting system rather than switching to a proportional representation voting system, which was supported by 38.7 percent of voters. This was British Columbia's third referendum on electoral reform, following ones in 2005 and 2009.

Rural–urban proportional representation (RUP), also called Flexible District PR, is a hybrid proportional system designed by Fair Vote Canada with the intention of meeting the special challenges of Canada's geography, which includes wide-flung, sparsely populated areas. As conceived in general terms by Fair Vote Canada, the rural–urban proportional model combines the use of multi-member ridings and top-up seats to meet the different needs of both rural and urban areas, while protecting the objective of proportionality. Sweden, Denmark and Iceland use similar voting models.
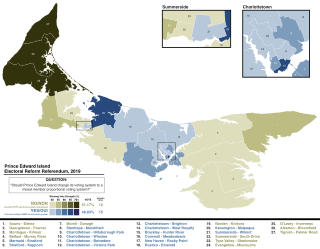
A referendum on electoral reform was held on April 23, 2019, in the Canadian province of Prince Edward Island – simultaneously with the 2019 provincial election – to determine if the province should adopt a mixed-member proportional representation voting system (MMP). A narrow majority voted to keep the existing first-past-the-post system. However, the referendum was not binding, as neither the yes or no side received majority support in 60% or more of the province's 27 electoral districts.

The next New Zealand general election to determine the composition of the 54th Parliament of New Zealand will be held no later than 13 January 2024, after the currently elected 53rd Parliament is dissolved or expires.
Mixed member majoritarian representation (MMM) is type of a mixed electoral system combining majoritarian and proportional methods, where the disproportional results of the majoritarian side of the system prevail over the proportional component. Mixed member majoritarian systems are therefore also as a type of semi-proportional representation, and are usually contrasted with mixed-member proportional representation (MMP) which aims to provide proportional representation via additional compensation ("top-up") seats.
