
Lesley Frances Soper is a former New Zealand politician of the Labour Party.
An electorate or electoral district is a geographic constituency used for electing a member (MP) to the New Zealand Parliament. The size of electorates is determined such that all electorates have approximately the same population.

Invercargill is an electorate of the New Zealand Parliament that has existed since 1866. Since the 2020 election, the electorate's representative is Penny Simmonds of the National Party.

Bay of Plenty is a New Zealand electoral division returning one member to the New Zealand House of Representatives. The current representative is Tom Rutherford of the National Party, first elected at the 2023 election.
Dunedin South is a former New Zealand parliamentary electorate. It first existed from 1881 to 1890, and subsequently from 1905 to 1946. In 1996, the electorate was re-established for the introduction of MMP, before being abolished in 2020.

Kaikōura is a New Zealand parliamentary electorate, returning a single MP to the New Zealand House of Representatives. The current MP for Kaikōura is Stuart Smith of the National Party, who won the 2014 election.

Waitaki is an electorate for the New Zealand House of Representatives that crosses the boundary of North Otago and South Canterbury towns on the East Coast of the South Island. The electorate was first established for the 1871 election that determined the 5th New Zealand Parliament. It has been abolished and re-established several times and in its early years was a two-member electorate for two parliamentary terms. The current electorate has existed since the 2008 election and is held by Miles Anderson of the National Party.

Rangitata is an electorate in the South Island of New Zealand. It first existed for two parliamentary terms in the late 19th century and was re-established for the 2008 general election. It largely replaced the Aoraki electorate, but included parts of the Rakaia electorate as well.
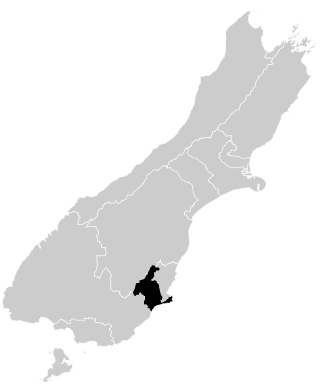
Taieri is a parliamentary electorate in the Otago region of New Zealand, initially from 1866 to 1911, and was later recreated during the 2019/20 electoral redistribution ahead of the 2020 election.

The 2014 New Zealand general election took place on Saturday 20 September 2014 to determine the membership of the 51st New Zealand Parliament.

Todd Keith Barclay is a former New Zealand politician of the National Party. He was elected Member of Parliament (MP) for Clutha-Southland at the 2014 general election. In 2017, Barclay resigned from parliament in disgrace after a scandal involving secret recordings he made.

The 2020 New Zealand general election was held on Saturday 17 October 2020 to determine the composition of the 53rd New Zealand Parliament. Voters elected 120 members to the House of Representatives, 72 from single-member electorates and 48 from closed party lists. Two referendums, one on the personal use of cannabis and one on euthanasia, were also held on the same day. Official results of the election and referendums were released on 6 November.
Seventy-one members of the New Zealand House of Representatives were elected from electorates in the general election on 23 September 2017.
67 electorate members of the New Zealand House of Representatives were to be elected in the general election on 27 November 1999. The tables below show the candidates for each electorate. Incumbent electorate MPs are highlighted in blue, and those candidates who were members of the previous parliament via their party list—regardless of which electorate they previously contested—are highlighted in red.

Elizabeth Dorothy Craig is a New Zealand politician of the Labour Party. She served as a Member of Parliament from 2017 to 2023. As a public health physician before entering Parliament, she is known for her research work on child poverty.
Hamish Richard Walker is a New Zealand former politician and former Member of Parliament in the House of Representatives for the National Party.
Mark William James Patterson is a right-wing New Zealand farmer, lobbyist and politician. He is a Member of Parliament in the House of Representatives for the New Zealand First party.
This page lists candidates contesting electorates in the 2020 New Zealand general election.
Southland is an electorate to the New Zealand House of Representatives. It was first created for the 2020 New Zealand general election and has since then been held by Joseph Mooney of the National Party.

Joseph Mooney is a New Zealand politician. In 2020 he was elected as a Member of Parliament in the House of Representatives for the National Party in the Southland electorate.
