Grey Lynn is a former New Zealand parliamentary electorate, in the city of Auckland. It existed from 1902 to 1978, and was represented by nine Members of Parliament.
The Representation Act 1900 had increased the membership of the House of Representatives from general electorates 70 to 76, and this was implemented through the 1902 electoral redistribution. In 1902, changes to the country quota affected the three-member electorates in the four main centres. The tolerance between electorates was increased to ±1,250 so that the Representation Commissions (since 1896, there had been separate commissions for the North and South Islands) could take greater account of communities of interest. These changes proved very disruptive to existing boundaries, and six electorates were established for the first time, including Grey Lynn, and two electorates that previously existed were re-established. [1]
During this electorate's existence, it was centred on the suburb of Grey Lynn. In the 1902 election, the electorate was classed as a mix of rural and urban (with a two to one ratio), and comprised areas just west of the central part of Auckland. [2] In the 1907 electoral redistribution, the electorate was classed as fully urban, and the country quota thus no longer applied. [3]
The electorate existed from 1902 to 1978. [4] George Fowlds of the Liberal Party was the electorate's first representative. [5] He served for three terms as was beaten in the 1911 election by the independent left-wing politician John Payne. [6] [7]
In 1919 Ellen Melville was one of three women who stood at short notice when women were able to stand as candidates for election to parliament. She stood on behalf of the Reform Party and came second in Grey Lynn.
Grey Lynn was held from the 1919 election by Labour's Fred Bartram until he was defeated in 1928 by John Fletcher of the United Party. [8] During 1930, Fletcher became an Independent. [9] There was disagreement in the Labour Party regarding the nomination for the 1931 election, with John A. Lee chosen over their previous representative Fred Bartram, resulting in the latter to stand as an Independent. [10] [11] Four candidates stood in total, with Lee defeating the incumbent. [12]
The electorate was represented by nine Members of Parliament. [4]
Key
Liberal Independent Labour Labour Independent United Democratic Labour
Table footnotes:
Party | Candidate | Votes | % | ±% | |
---|---|---|---|---|---|
Labour | Eddie Isbey | 8,268 | 51.58 | -9.03 | |
National | Jens Meder | 5,429 | 33.87 | +6.90 | |
Values | Loren Robb | 1,472 | 9.18 | ||
Social Credit | Bill Ross | 977 | 6.09 | -0.94 | |
Socialist Action | Matt Robson | 31 | 0.19 | ||
Socialist Unity | Bruce Skilton | 30 | 0.18 | ||
Majority | 2,839 | 17.71 | -15.92 | ||
Turnout | 16,027 | 71.99 | -13.65 | ||
Registered electors | 22,262 |
Party | Candidate | Votes | % | ±% | |
---|---|---|---|---|---|
Labour | Eddie Isbey | 9,887 | 60.61 | +16.10 | |
National | Jens Meder | 4,400 | 26.97 | +1.09 | |
Social Credit | Bill Ross | 1,148 | 7.03 | +2.29 | |
Values | Wayne Houston | 814 | 4.99 | ||
New Democratic | Martin Spratt | 63 | 0.38 | ||
Majority | 5,487 | 33.63 | +15.01 | ||
Turnout | 16,312 | 85.64 | -1.45 | ||
Registered electors | 19,045 |
Party | Candidate | Votes | % | ±% | |
---|---|---|---|---|---|
Labour | Eddie Isbey | 6,966 | 44.51 | ||
National | Jens Meder | 4,051 | 25.88 | ||
Independent Labour | Kevin Ryan | 3,887 | 24.84 | ||
Social Credit | Bill Ross | 743 | 4.74 | -6.19 | |
Majority | 2,915 | 18.62 | |||
Turnout | 15,647 | 87.09 | +4.25 | ||
Registered electors | 17,965 |
Party | Candidate | Votes | % | ±% | |
---|---|---|---|---|---|
Labour | Ritchie Macdonald | 8,329 | 59.77 | -2.24 | |
National | Horace Alexander Nash | 3,930 | 28.20 | ||
Social Credit | Bill Ross | 1,523 | 10.93 | +5.09 | |
Communist | Peter McAra | 152 | 1.09 | ||
Majority | 4,399 | 31.57 | -3.06 | ||
Turnout | 13,934 | 82.84 | -2.46 | ||
Registered electors | 16,820 |
Party | Candidate | Votes | % | ±% | |
---|---|---|---|---|---|
Labour | Ritchie Macdonald | 9,383 | 62.01 | ||
National | Jolyon Firth | 4,598 | 30.38 | ||
Social Credit | Bill Ross | 885 | 5.84 | +1.96 | |
Communist | George Jackson | 264 | 1.74 | -0.28 | |
Majority | 5,240 | 34.63 | |||
Turnout | 15,130 | 85.30 | +43.82 | ||
Registered electors | 17,737 |
Party | Candidate | Votes | % | ±% | |
---|---|---|---|---|---|
Labour | Reginald Keeling | 4,172 | 65.84 | ||
National | Ray Presland | 1,791 | 28.26 | ||
Social Credit | Bill Ross | 246 | 3.88 | ||
Communist | George Jackson | 128 | 2.02 | ||
Informal votes | 24 | 0.38 | |||
Majority | 2,381 | 37.57 | |||
Turnout | 6,361 | 41.48 | -44.66 | ||
Registered electors | 15,336 | ||||
Labour hold | Swing |
Party | Candidate | Votes | % | ±% | |
---|---|---|---|---|---|
Labour | Fred Hackett | 8,761 | 63.78 | -3.37 | |
National | Brian Zouch | 4,165 | 30.32 | ||
Social Credit | Frederick Thomas Morley | 693 | 5.04 | ||
Communist | Dick Wolf | 117 | 0.85 | ||
Majority | 4,596 | 33.45 | -5.83 | ||
Turnout | 13,736 | 86.14 | -7.57 | ||
Registered electors | 15,945 |
Party | Candidate | Votes | % | ±% | |
---|---|---|---|---|---|
Labour | Fred Hackett | 9,893 | 67.15 | +2.51 | |
National | Bernard Griffiths | 4,106 | 27.87 | ||
Social Credit | Ernest Richard James | 733 | 4.97 | ||
Majority | 5,787 | 39.28 | +2.65 | ||
Turnout | 14,732 | 93.71 | +2.79 | ||
Registered electors | 15,720 |
Party | Candidate | Votes | % | ±% | |
---|---|---|---|---|---|
Labour | Fred Hackett | 8,483 | 64.64 | -0.35 | |
National | Tom McGowan | 3,676 | 28.01 | ||
Social Credit | Samuel Hank Charles Jones | 835 | 6.36 | ||
Communist | Rita Smith | 129 | 0.98 | ||
Majority | 4,807 | 36.63 | +6.65 | ||
Turnout | 13,123 | 90.92 | +2.25 | ||
Registered electors | 14,432 |
Party | Candidate | Votes | % | ±% | |
---|---|---|---|---|---|
Labour | Fred Hackett | 8,265 | 64.99 | +6.95 | |
National | Harold Barry | 4,452 | 35.01 | ||
Majority | 3,813 | 29.98 | -11.98 | ||
Turnout | 12,717 | 88.67 | -5.23 | ||
Registered electors | 14,341 |
Party | Candidate | Votes | % | ±% | |
---|---|---|---|---|---|
Labour | Fred Hackett | 7,362 | 58.04 | -14.40 | |
National | John Leon Faulkner | 3,159 | 24.02 | ||
Democratic Labour | John A. Lee | 2,627 | 19.98 | ||
Majority | 4,203 | 41.96 | -2.93 | ||
Turnout | 13,148 | 93.90 | -0.98 | ||
Registered electors | 14,002 |
Party | Candidate | Votes | % | ±% | |
---|---|---|---|---|---|
Labour | Fred Hackett | 9,537 | 72.44 | +13.43 | |
National | Harold Barry | 3,627 | 27.56 | ||
Majority | 5,910 | 44.89 | +9.17 | ||
Turnout | 13,164 | 94.28 | -0.07 | ||
Registered electors | 13,962 |
Party | Candidate | Votes | % | ±% | |
---|---|---|---|---|---|
Labour | Fred Hackett | 10,010 | 59.01 | ||
Democratic Labour | John A. Lee | 3,951 | 23.29 | -56.26 | |
National | Ellen Melville [19] | 2,802 | 16.52 | ||
Real Democracy | Joseph Alexander Govan | 410 | 2.42 | -18.03 | |
People's Movement | George Edward Plane | 91 | 0.54 | ||
Informal votes | 322 | 1.86 | +0.03 | ||
Majority | 6,059 | 35.72 | -23.38 | ||
Turnout | 17,286 | 94.35 | +1.67 | ||
Registered electors | 18,321 |
Party | Candidate | Votes | % | ±% | |
---|---|---|---|---|---|
Labour | John A. Lee | 11,584 | 79.55 | +4.78 | |
National | Joseph Alexander Govan | 2,977 | 20.45 | ||
Informal votes | 272 | 1.83 | -1.05 | ||
Majority | 8,607 | 59.10 | -1.85 | ||
Turnout | 14,833 | 92.68 | +3.52 | ||
Registered electors | 16,005 |
Party | Candidate | Votes | % | ±% | |
---|---|---|---|---|---|
Labour | John A. Lee | 9,828 | 74.77 | +16.99 | |
United | George Wildish | 1,816 | 13.81 | ||
Democrat | Hilton Basil Moore Arthur | 1,290 | 9.81 | ||
Communist | Henry Mornington Smith | 210 | 1.59 | ||
Informal votes | 379 | 2.88 | +2.00 | ||
Majority | 8,012 | 60.95 | +33.27 | ||
Turnout | 13,144 | 89.16 | +5.90 | ||
Registered electors | 14,741 |
Party | Candidate | Votes | % | ±% | |
---|---|---|---|---|---|
Labour | John A. Lee | 6,767 | 57.78 | ||
Independent | John Fletcher | 3,525 | 30.10 | -16.43 | |
United | Walter Harry Murray | 1,037 | 8.85 | ||
Independent Labour | Fred Bartram | 382 | 3.26 | -42.73 | |
Informal votes | 104 | 0.88 | -0.18 | ||
Majority | 3,242 | 27.68 | |||
Turnout | 11,815 | 83.26 | -4.07 | ||
Registered electors | 14,190 |
Party | Candidate | Votes | % | ±% | |
---|---|---|---|---|---|
United | John Fletcher | 5,489 | 46.53 | ||
Labour | Fred Bartram | 5,425 | 45.99 | -6.67 | |
Reform | Patrick Buckley Fitzherbert | 684 | 5.79 | ||
Independent | Louisa Paterson | 72 | 0.61 | ||
Informal votes | 126 | 1.06 | -0.26 | ||
Majority | 64 | 0.54 | |||
Turnout | 11,796 | 87.33 | -3.47 | ||
Registered electors | 13,507 |
Party | Candidate | Votes | % | ±% | |
---|---|---|---|---|---|
Labour | Fred Bartram | 6,061 | 52.66 | -3.73 | |
Reform | Ellen Melville | 5,296 | 46.01 | ||
Informal votes | 152 | 1.32 | +0.07 | ||
Majority | 765 | 6.64 | -7.40 | ||
Turnout | 11,509 | 90.80 | -1.75 | ||
Registered electors | 12,674 |
Party | Candidate | Votes | % | ±% | |
---|---|---|---|---|---|
Labour | Fred Bartram | 5,648 | 56.39 | +20.37 | |
Reform | William John Holdsworth | 4,241 | 42.34 | ||
Informal votes | 126 | 1.25 | -0.10 | ||
Majority | 1,407 | 14.04 | +8.53 | ||
Turnout | 10,015 | 92.55 | +6.49 | ||
Registered electors | 10,821 |
Party | Candidate | Votes | % | ±% | |
---|---|---|---|---|---|
Labour | Fred Bartram | 3,141 | 36.02 | ||
Reform | Ellen Melville | 2,660 | 30.51 | ||
Liberal | George Fowlds | 2,405 | 27.58 | ||
Independent | Lindsay Garmson | 214 | 2.45 | ||
Independent Labour | Paul Richardson | 180 | 2.06 | ||
Informal votes | 118 | 1.35 | -0.33 | ||
Majority | 481 | 5.51 | |||
Turnout | 8,718 | 86.06 | -0.14 | ||
Registered electors | 10,130 |
Party | Candidate | Votes | % | ±% | |
---|---|---|---|---|---|
Independent Labour | John Payne | 2,933 | 34.04 | -16.07 | |
Reform | Murdoch McLean | 2,844 | 33.01 | ||
United Labour | George Fowlds | 2,838 | 32.94 | -16.62 | |
Informal votes | 145 | 1.68 | +1.37 | ||
Majority | 89 | 1.03 | +0.49 | ||
Turnout | 8,615 | 86.20 | +5.09 | ||
Registered electors | 9,994 |
Party | Candidate | Votes | % | ±% | |
---|---|---|---|---|---|
Liberal | George Fowlds | 3,117 | 44.64 | -9.94 | |
Independent Labour | John Payne | 2,191 | 31.38 | ||
Reform | Walter Harry Murray | 1,568 | 22.45 | ||
Informal votes | 106 | 1.51 | -0.57 | ||
Turnout | 6,982 | 81.79 | -0.41 | ||
Second ballot result | |||||
Independent Labour | John Payne | 3,470 | 50.11 | +18.73 | |
Liberal | George Fowlds | 3,432 | 49.56 | +4.92 | |
Informal votes | 22 | 0.31 | -1.20 | ||
Majority | 38 | 0.54 | |||
Turnout | 6,924 | 81.11 | -0.68 | ||
Registered electors | 8,536 |
Party | Candidate | Votes | % | ±% | |
---|---|---|---|---|---|
Liberal | George Fowlds | 4,035 | 54.58 | +3.00 | |
Conservative | Oliver Nicholson | 3,146 | 42.55 | ||
Independent Labour | James Ulysses Brown | 57 | 0.77 | ||
Informal votes | 154 | 2.08 | +1.16 | ||
Majority | 889 | 12.02 | +7.92 | ||
Turnout | 7,392 | 82.20 | +0.87 | ||
Registered electors | 8,992 |
Party | Candidate | Votes | % | ±% | |
---|---|---|---|---|---|
Liberal | George Fowlds | 2,891 | 51.58 | -0.15 | |
Conservative | John Farrell | 2,661 | 47.48 | ||
Informal votes | 52 | 0.92 | +1.95 | ||
Majority | 230 | 4.10 | +1.23 | ||
Turnout | 5,604 | 81.33 | +5.71 | ||
Registered electors | 6,890 |
Party | Candidate | Votes | % | ±% | |
---|---|---|---|---|---|
Liberal | George Fowlds | 2,108 | 51.43 | ||
Liberal–Labour | Thomas Taylor Masefield | 1,990 | 48.56 | ||
Majority | 118 | 2.87 | |||
Turnout | 4,098 | 75.62 | |||
Registered electors | 5,419 |
The 1919 New Zealand general election was held on Tuesday, 16 December in the Māori electorates and on Wednesday, 17 December in the general electorates to elect a total of 80 MPs to the 20th session of the New Zealand Parliament. A total number of 560,673 (80.5%) voters turned out to vote.
Auckland Central is a New Zealand electoral division returning one member to the New Zealand House of Representatives. The electorate is currently represented by Chlöe Swarbrick, a member of the Green Party; she has represented the seat since 2020.
Auckland East was a New Zealand electorate, situated in the east of Auckland. It existed between 1861 and 1887, and again between 1905 and 1946.
Napier is a New Zealand parliamentary electorate, returning one Member of Parliament to the House of Representatives. It is named after the city of Napier, the main urban area within the electorate. The electorate was established for the 1861 election and has existed since. Since the 2014 general election, Napier has been held by Stuart Nash of the New Zealand Labour Party. Previously, it had been held by Chris Tremain of the New Zealand National Party, who stood down prior to the 2014 election.
Rotorua is a New Zealand parliamentary electorate, returning one Member of Parliament to the New Zealand House of Representatives. It was first established in 1919, and has existed continuously since 1954. The current MP for Rotorua is Todd McClay of the National Party, who won the electorate in the 2008 general election from incumbent Labour MP Steve Chadwick.
Hamilton is a former New Zealand parliamentary electorate that existed from 1922 to 1969. The electorate covered the urban area of the city of Hamilton. In 1969, the city was part of two rural electorates, Hamilton East and Waikato. For the 1972 election, the nature of Hamilton East changed to urban, and the Hamilton West electorate complements it to form a second urban electorate.
Raglan is a former New Zealand parliamentary electorate. It existed for three periods between 1861 and 1996 and during that time, it was represented by 13 Members of Parliament.
Franklin was a rural New Zealand parliamentary electorate. It existed from 1861 to 1996 during four periods.
Gisborne is a former New Zealand parliamentary electorate. It existed from 1908 to 1996, and it was represented by 12 Members of Parliament.
Waitemata was a New Zealand parliamentary electorate, from 1871 to 1946, and then from 1954 to 1978. It was represented by 18 members of parliament.
Manukau is a former New Zealand parliamentary electorate in the south Auckland Region. It existed from 1881 to 1978, with a break from 1938 to 1954. It was represented by nine Members of Parliament. Two by-elections were held in the electorate.
Awarua was a New Zealand parliamentary electorate from 1881 to 1996.
Hutt was a New Zealand parliamentary electorate. It was one of the original electorates in 1853 and existed during two periods until 1978. It was represented by 13 Members of Parliament.
The former New Zealand parliamentary electorate on the western inner city of Auckland, was known as City of Auckland West from 1861 to 1890, and then Auckland West from 1905 to 1946.
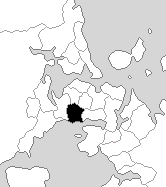
Roskill was a New Zealand parliamentary electorate, from 1919 to 1996. The electorate was represented by eight Members of Parliament.
Kaipara is a former New Zealand parliamentary electorate north of Auckland that existed from 1902 to 1946, and from 1978 to 1996.
Hurunui was a parliamentary electorate in the Canterbury region of New Zealand, from 1902 to 1963.
Waipawa was a parliamentary electorate in the Hawke's Bay Region of New Zealand, from 1881 to 1946.
Ponsonby was a parliamentary electorate in Auckland, New Zealand from 1887 to 1890 and from 1946 to 1963. The Ponsonby electorate was represented by two Members of Parliament.
Oamaru was a parliamentary electorate in the Otago region of New Zealand, during three periods between 1866 and 1978.