St Albans was a parliamentary electorate in Christchurch, New Zealand, from 1881 to 1890, then from 1946 to 1996.
The previous electoral redistribution was undertaken in 1875 for the 1875–1876 election. In the six years since, New Zealand's European population had increased by 65%. In the 1881 electoral redistribution, the House of Representatives increased the number of European representatives to 91 (up from 84 since the 1875–76 election). The number of Māori electorates was held at four. The House further decided that electorates should not have more than one representative, which led to 35 new electorates being formed, including St Albans, and two electorates that had previously been abolished to be recreated. This necessitated a major disruption to existing boundaries. [1]
The 1941 New Zealand census had been postponed due to World War II, so the 1946 electoral redistribution had to take ten years of population growth and movements into account. The North Island gained a further two electorates from the South Island due to faster population growth. The abolition of the country quota through the Electoral Amendment Act, 1945 reduced the number and increased the size of rural electorates. None of the existing electorates remained unchanged, 27 electorates were abolished, 19 electorates were created for the first time, and eight former electorates were re-established, including St Albans. [2]
The electorate was centred on the Christchurch suburb of St Albans.
The electorate was first created for the 1881 general election, held on 9 December. [3]
John Evans Brown contested the electorate with J. L. Wilson and A. W. O'Neill. They received 218, 168 and 85 votes, respectively. Brown was declared elected. [4] Brown did not stand for re-election in the 1884 general election. [5]
In 1884 general election, held on 22 July, Francis James Garrick successfully stood for the electorate against two other candidates and obtained a comfortable victory, gaining 396 out of 477 votes. [6] Garrick stood again in the electorate in the 1887 general election, against William Pember Reeves. At the election on 26 September, Reeves and Garrick received 802 and 634 votes, respectively. With a majority of 164 votes, Reeves was the successful candidate. [7] [8] The electorate was abolished at the end of the parliamentary term in 1890 and Reeves successfully contested the Christchurch electorate.
The electorate was recreated in 1946. [9] Jack Watts from the National Party was the representative from 1946 to 1957, when he successfully contested the Fendalton electorate. St Albans went to Neville Pickering of the Labour Party, who lost the electorate at the next election in 1960 to National's Bert Walker. Walker represented St Albans until 1969, when he successfully contested the Papanui electorate.
St Albans was won by Labour's Roger Drayton in the 1969 general election. He retired after three terms, and the 1978 general election was won by Labour's David Caygill, who held the electorate until it was abolished in 1996.
The electorate was represented by eight Members of Parliament: [9]
Key
Election | Winner | |
---|---|---|
1881 election | John Brown | |
1884 election | Francis Garrick | |
1887 election | William Reeves | |
(electorate abolished 1890-1946) | ||
1946 election | Jack Watts | |
1949 election | ||
1951 election | ||
1954 election | ||
1957 election | Neville Pickering | |
1960 election | Bert Walker | |
1963 election | ||
1966 election | ||
1969 election | Roger Drayton | |
1972 election | ||
1975 election | ||
1978 election | David Caygill | |
1981 election | ||
1984 election | ||
1987 election | ||
1990 election | ||
1993 election | ||
(Electorate abolished in 1996; see Christchurch Central) |
Party | Candidate | Votes | % | ±% | |
---|---|---|---|---|---|
Labour | David Caygill | 10,022 | 46.43 | −0.92 | |
National | Raewyn Dawson | 6,597 | 30.56 | ||
Alliance | Mike Newlove | 3,423 | 15.85 | +5.77 | |
NZ First | Peter Gordon | 949 | 4.39 | ||
Christian Heritage | Mary Lovell | 481 | 2.22 | ||
Natural Law | Joe Pickering | 88 | 0.40 | ||
Independent | Bill Bunting | 25 | 0.11 | ||
Majority | 3,425 | 15.86 | +8.47 | ||
Turnout | 21,585 | 85.44 | +0.91 | ||
Registered electors | 25,261 |
Party | Candidate | Votes | % | ±% | |
---|---|---|---|---|---|
Labour | David Caygill | 9,990 | 47.35 | −11.05 | |
National | David Dumergue | 8,430 | 39.96 | ||
NewLabour | Mike Newlove | 2,127 | 10.08 | ||
Democrats | John McCaskey | 310 | 1.46 | ||
McGillicuddy Serious | Michael Vercoe | 209 | 0.99 | ||
Communist League | Kerry Moyst | 28 | 0.13 | ||
Majority | 1,560 | 7.39 | −14.33 | ||
Turnout | 21,094 | 84.53 | −3.09 | ||
Registered electors | 24,954 |
Party | Candidate | Votes | % | ±% | |
---|---|---|---|---|---|
Labour | David Caygill | 12,166 | 58.40 | +2.55 | |
National | Andrew Cowie | 7,641 | 36.68 | ||
Democrats | Bill Morgan | 593 | 2.84 | ||
Socialist Action | Geoff Pearce | 181 | 0.86 | ||
Wizard Party | Suzanne Sadler | 129 | 0.61 | ||
Values | Phil McAnally | 121 | 0.58 | ||
Majority | 4,525 | 21.72 | −6.52 | ||
Turnout | 20,831 | 87.62 | −4.57 | ||
Registered electors | 23,773 |
Party | Candidate | Votes | % | ±% | |
---|---|---|---|---|---|
Labour | David Caygill | 12,208 | 55.85 | +0.82 | |
National | Ian Wilson | 6,036 | 27.61 | ||
NZ Party | Maurice Kattell | 2,621 | 11.99 | ||
Social Credit | Quinton Manson | 990 | 4.52 | −8.94 | |
Majority | 6,172 | 28.24 | +4.72 | ||
Turnout | 21,855 | 92.19 | +2.81 | ||
Registered electors | 23,704 |
Party | Candidate | Votes | % | ±% | |
---|---|---|---|---|---|
Labour | David Caygill | 11,524 | 55.03 | +2.31 | |
National | Jim Baker | 6,598 | 31.50 | ||
Social Credit | Quinton Manson | 2,819 | 13.46 | +4.54 | |
Majority | 4,926 | 23.52 | +16.19 | ||
Turnout | 20,941 | 89.38 | +22.42 | ||
Registered electors | 23,428 |
Party | Candidate | Votes | % | ±% | |
---|---|---|---|---|---|
Labour | David Caygill | 11,279 | 52.72 | ||
National | Neil Russell | 7,600 | 35.52 | ||
Social Credit | Quinton Manson | 1,909 | 8.92 | +5.44 | |
Values | Conway Jack | 577 | 2.69 | ||
Tory | Ian Douglas Costello | 28 | 0.13 | ||
Majority | 1,570 | 7.33 | |||
Turnout | 21,393 | 66.96 | −12.93 | ||
Registered electors | 31,946 |
Party | Candidate | Votes | % | ±% | |
---|---|---|---|---|---|
Labour | Roger Drayton | 9,013 | 48.59 | −7.43 | |
National | Prudence Rotherberg | 7,443 | 40.13 | ||
Values | Roger Wilson | 1,304 | 7.03 | ||
Social Credit | Quinton Manson | 647 | 3.48 | ||
Independent | Richard Dawson | 104 | 0.56 | ||
Imperial British Conservative | Alice Flett | 36 | 0.19 | ||
Majority | 1,570 | 8.46 | −8.89 | ||
Turnout | 18,547 | 79.89 | −6.64 | ||
Registered electors | 23,214 |
Party | Candidate | Votes | % | ±% | |
---|---|---|---|---|---|
Labour | Roger Drayton | 9,900 | 56.02 | +6.41 | |
National | Ron Doak | 6,834 | 38.67 | ||
Social Credit | Carol Flint | 514 | 2.90 | ||
Values | Bob Overend | 376 | 2.12 | ||
New Democratic | Bob Scott | 47 | 0.26 | ||
Majority | 3,066 | 17.35 | +12.00 | ||
Turnout | 17,671 | 86.53 | +2.92 | ||
Registered electors | 20,420 |
Party | Candidate | Votes | % | ±% | |
---|---|---|---|---|---|
Labour | Roger Drayton | 8,415 | 49.61 | ||
National | Ian Wilson | 7,506 | 44.25 | ||
Social Credit | Jim Fountain | 1,041 | 6.13 | ||
Majority | 909 | 5.35 | |||
Turnout | 16,962 | 89.45 | +3.66 | ||
Registered electors | 18,961 |
Party | Candidate | Votes | % | ±% | |
---|---|---|---|---|---|
National | Bert Walker | 8,455 | 53.62 | −1.72 | |
Labour | Ted Adcock | 5,880 | 37.29 | ||
Social Credit | Ray McNeil | 1,344 | 8.52 | ||
Keynesian Progress | Mark Sadler | 88 | 0.55 | ||
Majority | 2,575 | 16.33 | +1.33 | ||
Turnout | 15,767 | 85.79 | −5.36 | ||
Registered electors | 18,378 |
Party | Candidate | Votes | % | ±% | |
---|---|---|---|---|---|
National | Bert Walker | 9,228 | 55.34 | +6.74 | |
Labour | John Palmer | 6,727 | 40.34 | ||
Social Credit | Carol Flint | 718 | 4.30 | ||
Majority | 2,501 | 15.00 | +13.15 | ||
Turnout | 16,673 | 91.15 | +0.10 | ||
Registered electors | 18,291 |
Party | Candidate | Votes | % | ±% | |
---|---|---|---|---|---|
National | Bert Walker | 7,809 | 48.60 | ||
Labour | Neville Pickering | 7,511 | 46.75 | −3.28 | |
Social Credit | George Richard Lynne | 746 | 4.64 | ||
Majority | 298 | 1.85 | |||
Turnout | 16,066 | 91.25 | −0.70 | ||
Registered electors | 17,605 |
Party | Candidate | Votes | % | ±% | |
---|---|---|---|---|---|
Labour | Neville Pickering | 7,960 | 50.03 | ||
National | Eric Philip Wills | 7,459 | 46.88 | ||
Social Credit | Thomas Francis Penrose | 759 | 4.77 | ||
Majority | 501 | 3.14 | |||
Turnout | 15,908 | 91.95 | +0.42 | ||
Registered electors | 17,299 |
Party | Candidate | Votes | % | ±% | |
---|---|---|---|---|---|
National | Jack Watts | 6,905 | 43.58 | −11.49 | |
Labour | Mick Connelly | 6,297 | 39.75 | ||
Social Credit | Stanley William Ayers | 2,639 | 16.65 | ||
Majority | 608 | 3.83 | −6.32 | ||
Turnout | 15,841 | 92.37 | +2.29 | ||
Registered electors | 17,148 |
Party | Candidate | Votes | % | ±% | |
---|---|---|---|---|---|
National | Jack Watts | 7,675 | 55.07 | +0.85 | |
Labour | John Bernard Mora | 6,260 | 44.93 | ||
Majority | 1,415 | 10.15 | +1.71 | ||
Turnout | 13,935 | 90.08 | −3.10 | ||
Registered electors | 15,469 |
Party | Candidate | Votes | % | ±% | |
---|---|---|---|---|---|
National | Jack Watts | 7,335 | 54.22 | +3.90 | |
Labour | George Manning | 6,193 | 45.78 | ||
Majority | 1,142 | 8.44 | +7.80 | ||
Turnout | 13,528 | 93.18 | +1.19 | ||
Registered electors | 14,518 |
Party | Candidate | Votes | % | ±% | |
---|---|---|---|---|---|
National | Jack Watts | 6,691 | 50.32 | ||
Labour | Morgan Williams | 6,605 | 49.68 | ||
Majority | 86 | 0.64 | |||
Turnout | 13,296 | 91.99 | |||
Registered electors | 14,453 |
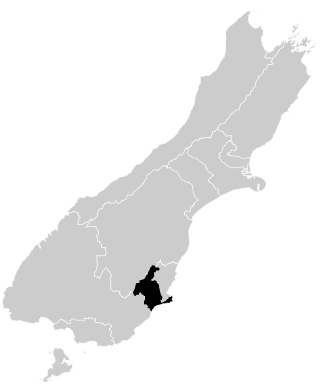
Dunedin South is a former New Zealand parliamentary electorate. It first existed from 1881 to 1890, and subsequently from 1905 to 1946. In 1996, the electorate was re-established for the introduction of MMP, before being abolished in 2020.
New Plymouth is a New Zealand parliamentary electorate. It was first created for the 1st New Zealand Parliament in 1853 and has existed since, with one 32-year interruption. The electorate was initially called Town of New Plymouth.
Waitaki is an electorate for the New Zealand House of Representatives that crosses the boundary of North Otago and South Canterbury towns on the East Coast of the South Island. The electorate was first established for the 1871 election that determined the 5th New Zealand Parliament. It has been abolished and re-established several times and in its early years was a two-member electorate for two parliamentary terms. The current electorate has existed since the 2008 election and is held by Miles Anderson of the National Party.
Taranaki was a New Zealand parliamentary electorate that existed for three periods between 1881 and 1996. It was represented by nine Members of Parliament.
Manukau is a former New Zealand parliamentary electorate in the south Auckland Region. It existed from 1881 to 1978, with a break from 1938 to 1954. It was represented by nine Members of Parliament. Two by-elections were held in the electorate.
Christchurch North is a former New Zealand parliamentary electorate. The electorate comprised the northern half of what is now considered the Christchurch Central City.
Papanui is a former New Zealand parliamentary electorate. The electorate was in the northern suburbs of the city of Christchurch, and existed from 1969 to 1984.
Fendalton is a former New Zealand parliamentary electorate. It existed during two periods between 1946 and 1996. The electorate was in the western suburbs of Christchurch, New Zealand. Fendalton is an expensive suburb, and was always represented by the National Party.
Dunedin West was a New Zealand parliamentary electorate, in the city of Dunedin. It existed for three periods between 1881 and 1996 and was represented by seven Members of Parliament.
Chalmers, originally Port Chalmers, was a parliamentary electorate in the Otago Region of New Zealand, from 1866 to 1938 with a break from 1896 to 1902. It was named after the town of Port Chalmers, the main port of Dunedin and Otago.
Moeraki was a parliamentary electorate in the Otago region of New Zealand, from 1881 to 1887.
Geraldine was a former parliamentary electorate in the South Canterbury region of New Zealand that existed three times from 1875 to 1911. It was represented by six Members of Parliament.
Wairau was a parliamentary electorate in the Marlborough Region of New Zealand. It was one of the initial 24 New Zealand electorates and existed from 1853 until its abolition in 1938, when it was succeeded by the Marlborough electorate. The electorate had 13 representatives during its existence. The 1861 election in the Wairau electorate was notable in that a later Premier, Frederick Weld, was unexpectedly and narrowly defeated by William Henry Eyes.
Stanmore was a parliamentary electorate in Christchurch, New Zealand, from 1881 to 1887. The electorate was represented by two Members of Parliament.
Hokonui was a parliamentary electorate in the Southland region of New Zealand, from 1881 to 1890.
City of Dunedin, during the first two parliaments called Town of Dunedin, was a parliamentary electorate in Dunedin in Otago, New Zealand. It was one of the original electorates created in 1853 and existed, with two breaks, until 1905. The first break, from 1862 to 1866, was caused by an influx of people through the Otago gold rush, when many new electorates were formed in Otago. The second break occurred from 1881 to 1890. It was the only New Zealand electorate that was created as a single-member, two-member and three member electorate.
Roslyn was a parliamentary electorate in the city of Dunedin in the Otago region of New Zealand from 1866 to 1890.
Oamaru was a parliamentary electorate in the Otago region of New Zealand, during three periods between 1866 and 1978.
Francis James Garrick, was a barrister and politician from Christchurch, New Zealand.
The 8th New Zealand Parliament was a term of the New Zealand Parliament.