| Representative | Party | Dates | Cong
ress(es) | Electoral history | Counties [11] [12] [13] |
|---|
| District created March 4, 1933 |

John H. Hoeppel
(Arcadia) | Democratic | March 4, 1933 –
January 3, 1937 | 73rd
74th | Elected in 1932.
Re-elected in 1934.
Lost renomination. | 1933–1953:
Eastern Los Angeles (Pasadena, Pomona, Whittier) |

Jerry Voorhis
(San Dimas) | Democratic | January 3, 1937 –
January 3, 1947 | 75th
76th
77th
78th
79th | Elected in 1936.
Re-elected in 1938.
Re-elected in 1940.
Re-elected in 1942.
Re-elected in 1944.
Lost re-election. |

Richard Nixon
(Whittier) | Republican | January 3, 1947 –
November 30, 1950 | 80th
81st | Elected in 1946.
Re-elected in 1948.
Retired to run for U.S. Senator.
Resigned when appointed U.S. Senator. |
| Vacant | November 30, 1950 –
January 3, 1951 | 81st |
Patrick J. Hillings
(Arcadia) | Republican | January 3, 1951 –
January 3, 1953 | 82nd | Elected in 1950.
Redistricted to the 25th district . |

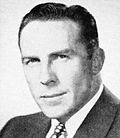
Allan O. Hunter
(Fresno) | Republican | January 3, 1953 –
January 3, 1955 | 83rd | Redistricted from the 9th district and re-elected in 1952.
Lost re-election. | 1953–1963:
Fresno, Madera, Merced |
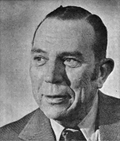
B. F. Sisk
(Fresno) | Democratic | January 3, 1955 –
January 3, 1963 | 84th
85th
86th
87th | Elected in 1954.
Re-elected in 1956.
Redistricted to the 16th district . |

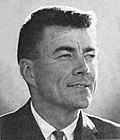
Burt Talcott
(Salinas) | Republican | January 3, 1963 –
January 3, 1975 | 88th
89th
90th
91st
92nd
93rd | Elected in 1962.
Re-elected in 1964.
Re-elected in 1966.
Re-elected in 1968.
Re-elected in 1970.
Re-elected in 1972.
Redistricted to the 16th district . | 1963–1967:
Monterey, San Benito, San Luis Obispo, Santa Cruz |
1967–1973:
Kings, Monterey, San Luis Obispo, Santa Cruz |
1973–1975:
Monterey, San Benito, northwestern San Luis Obispo, southern Santa Clara, Santa Cruz |
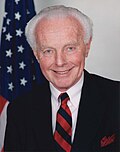
Pete McCloskey
(Menlo Park) | Republican | January 3, 1975 –
January 3, 1983 | 94th
95th
96th
97th | Redistricted from the 17th district and re-elected in 1974.
Re-elected in 1976.
Re-elected in 1978.
Re-elected in 1980.
Retired to run for U.S. Senator. | 1975–1983:
Southern San Mateo, northern Santa Clara |

Ed Zschau
(Los Altos) | Republican | January 3, 1983 –
January 3, 1987 | 98th
99th | Elected in 1982.
Re-elected in 1984.
Retired to run for U.S. Senator. | 1983–1993:
Southern San Mateo, Santa Clara, northern Santa Cruz |

Ernie Konnyu
(Saratoga) | Republican | January 3, 1987 –
January 3, 1989 | 100th | Elected in 1986.
Lost renomination. |

Tom Campbell
(Stanford) | Republican | January 3, 1989 –
January 3, 1993 | 101st
102nd | Elected in 1988.
Re-elected in 1990.
Retired to run for U.S. Senator. |
Tom Lantos
(San Mateo) | Democratic | January 3, 1993 –
February 11, 2008 | 103rd
104th
105th
106th
107th
108th
109th
110th | Redistricted from the 11th district and re-elected in 1992.
Re-elected in 1994.
Re-elected in 1996.
Re-elected in 1998.
Re-elected in 2000.
Re-elected in 2002.
Re-elected in 2004.
Re-elected in 2006.
Announced retirement, then died. | 1993–2003:
Southwestern San Francisco, northern San Mateo |
2003–2013:

Southwestern San Francisco, northern San Mateo |
| Vacant | February 11, 2008 –
April 8, 2008 | 110th |

Jackie Speier
(Hillsborough) | Democratic | April 8, 2008 –
January 3, 2013 | 110th
111th
112th | Elected to finish Lantos's term.
Re-elected in 2008.
Re-elected in 2010.
Redistricted to the 14th district . |

Nancy Pelosi
(San Francisco) | Democratic | January 3, 2013 –
January 3, 2023 | 113th
114th
115th
116th
117th | Redistricted from the 8th district and re-elected in 2012.
Re-elected in 2014.
Re-elected in 2016.
Re-elected in 2018.
Re-elected in 2020.
Redistricted to the 11th district . | 2013–2023:

Most of San Francisco |
Barbara Lee
(Oakland) | Democratic | January 3, 2023 –
January 3, 2025
| 118th | Redistricted from the 13th district and re-elected in 2022.
Retired to run for U.S. senator. | 2023–present

northwestern portion of Alameda County |

Lateefah Simon
(Emeryville) | Democratic | January 3, 2025 –
present | 119th | Elected in 2024. |


