This article contains one or more duplicated citations. The reason given is: DuplicateReferences detected: (June 2025)
|

In Earth's atmosphere, carbon dioxide is a trace gas that plays an integral part in the greenhouse effect, carbon cycle, photosynthesis and oceanic carbon cycle. It is one of three main greenhouse gases in the atmosphere of Earth. The concentration of carbon dioxide (CO2) in the atmosphere reached 427 ppm (0.0427%) on a molar basis in 2024, representing 3341 gigatonnes of CO2. [1] This is an increase of 50% since the start of the Industrial Revolution, up from 280 ppm during the 10,000 years prior to the mid-18th century. [2] [3] [4] The increase is due to human activity. [5]
Contents
- Current concentration and future trends
- Current situation
- Annual and regional fluctuations
- Measurements and predictions made in the recent past
- Measurement techniques
- Data networks
- Analytical methods to investigate sources of CO2
- Causes of the current increase
- Anthropogenic CO2 emissions
- Roles in natural processes on Earth
- Greenhouse effect
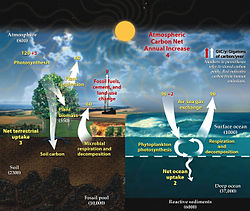
- Carbon cycle
- Effects of current increase
- Direct effects
- Indirect effects and impacts
- Approaches for reducing CO2 concentrations
- Concentrations in the geologic past
- Drivers of ancient-Earth CO2 concentration
- Photosynthesis in the geologic past
- Measuring ancient-Earth CO2 concentration
- See also
- References
- External links
The current increase in CO2 concentrations is primarily driven by the burning of fossil fuels. [6] Other significant human activities that emit CO2 include cement production, deforestation, and biomass burning. The increase in atmospheric concentrations of CO2 and other long-lived greenhouse gases such as methane increase the absorption and emission of infrared radiation by the atmosphere. This has led to a rise in average global temperature and ocean acidification. Another direct effect is the CO2 fertilization effect. The increase in atmospheric concentrations of CO2 causes a range of further effects of climate change on the environment and human living conditions.
Carbon dioxide is a greenhouse gas. It absorbs and emits infrared radiation at its two infrared-active vibrational frequencies. The two wavelengths are 4.26 μm (2,347 cm−1) (asymmetric stretching vibrational mode) and 14.99 μm (667 cm−1) (bending vibrational mode). CO2 plays a significant role in influencing Earth's surface temperature through the greenhouse effect. [7] Light emission from the Earth's surface is most intense in the infrared region between 200 and 2500 cm−1, [8] as opposed to light emission from the much hotter Sun which is most intense in the visible region. Absorption of infrared light at the vibrational frequencies of atmospheric CO2 traps energy near the surface, warming the surface of Earth and its lower atmosphere. Less energy reaches the upper atmosphere, which is therefore cooler because of this absorption. [9]
The present atmospheric concentration of CO2 is the highest for 14 million years. [10] Concentrations of CO2 in the atmosphere were as high as 4,000 ppm during the Cambrian period about 500 million years ago, and as low as 180 ppm during the Quaternary glaciation of the last two million years. [2] Reconstructed temperature records for the last 420 million years indicate that atmospheric CO2 concentrations peaked at approximately 2,000 ppm. This peak happened during the Devonian period (400 million years ago). Another peak occurred in the Triassic period (220–200 million years ago). [11]