Henley (UK Parliament constituency)

Last updated

Henley
County constituency
for the House of Commons
Henley2007Constituency.svg
Boundary of Henley in Oxfordshire
EnglandOxfordshire.svg
Location of Oxfordshire within England
County Oxfordshire
Electorate 73,851 (December 2010) [1]
Major settlements Henley, Thame and Chinnor
Current constituency
Created 1885
Member of Parliament John Howell (Conservative)
SeatsOne
Created from Oxfordshire

Henley is a constituency [n 1] in Oxfordshire represented in the House of Commons of the UK Parliament since 2008 by John Howell, a Member of Parliament from the Conservative Party. [n 2]

Contents

Under the 2023 Periodic Review of Westminster constituencies, the constituency will only be subject to minor boundary changes, but is to be renamed Henley and Thame - to be first contested at the next general election. [2]

Constituency profile

The seat has throughout its history consisted of the town of Henley, a part of the Chiltern Hills AONB interspersed by the larger settlements of Thame and Chinnor, and a narrow, more developed area adjoining the Thames on one bank. The local economy, interconnected with London, Oxford and in the far south Reading, ensures a high rate of employment and its natural environment attracts retirees and high income owners. [3] The seat has good rail connections to Central London. [4] As of 2021, the largest town in the constituency is Thame.

History

The constituency was established under the Redistribution of Seats Act 1885 for the 1885 general election when the three-member Parliamentary County of Oxfordshire was divided into the three single-member seats of Banbury, Woodstock and Henley.

Prominent members

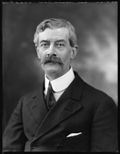
Two prominent Cabinet ministers have been elected for Henley Michael Heseltine who served as the MP for Henley from 19742001. Heseltine was succeeded by the future Mayor of London and Prime Minister Boris Johnson, rapidly made a shadow minister during the period of the Labour government. [n 3] In May 2008, Johnson was elected as Mayor of London, and he subsequently resigned from the Commons on 4 June 2008, [5] resulting in a by-election in the constituency, which was won by the current incumbent, John Howell.

Political history

An unbroken succession of Conservative candidates have won the seat since 1910. The 2008 by-election was closer than general elections since 2001 and won by the Conservative candidate, John Howell. Howell was re-elected at the 2010 general election and again in 2015, when Labour finished second for the first time since 1970 in Henley. The 2015 GE result made the seat the twelfth safest of the Conservative Party's 331 seats by percentage of majority. [6]

Other parties

All five parties' candidates achieved more than deposit-retaining threshold of 5% of the vote in 2015, reflecting frequent such results for the Green Party and UKIP in that election. Liberal Democrat or predecessor-party Liberal candidates were second-placed between February 1974 and 2010 (inclusive). The closest contest for Henley was in 1966, when Labour's George Cunningham took 44.6% of the vote in a two-candidate contest.

Turnout

At general elections, turnout in the constituency has ranged between 52.9% in the "khaki election" of 1918 to 81.7% in 1950.

Boundaries and boundary changes

1885–1918

1918–1950

Expanded to include eastern half of the abolished Woodstock Division, including Bicester. Caversham, which had been absorbed by the County Borough of Reading, was transferred to the Parliamentary Borough of Reading in Berkshire.

1950–1974

Change to contents due to reorganisation of urban and rural districts. Minor losses to the Oxford constituency, including Cowley and Headington, as a result of the expansion of the County Borough of Oxford.

1974–1983

Bicester and northern parts of Rural District of Ploughley transferred to Banbury. Southern parts of the Rural District of Ploughley and northernmost parts of the Rural District of Bullingdon included in the new County Constituency of Mid-Oxon.

1983–1997

Gained the rural area to the east of Oxford from the abolished County Constituency of Mid-Oxon.  The Littlemore ward to the south of Oxford was included in the new Borough Constituency of Oxford East.

1997–2010

As above plus Horspath ward which was added following a change to local authority boundaries. [10]

Minor gain from Oxford East.

Henley (UK Parliament constituency)
Map of current boundaries

2010–present

The two wards in the District of Cherwell, to the south of Bicester, were transferred from Banbury.

The constituency covers most of the local government district of South Oxfordshire, excluding Wallingford, Didcot and surrounding areas in the west. Main settlements include Henley-on-Thames itself, Thame, Chinnor and Sonning Common. The two wards of Cherwell are to the north, close to Oxford; they are predominantly rural.

Members of Parliament

ElectionMember [12] Party
1885 Edward Vernon Harcourt Conservative
1886 Francis Parker Conservative
1895 Robert Hermon-Hodge Conservative
1906 Philip Morrell Liberal
1910 Valentine Fleming Conservative
1917 by-election Sir Robert Hermon-Hodge Conservative
1918 Reginald Terrell Coalition Conservative
1922 Conservative
1924 Robert Henderson Conservative
1932 by-election Gifford Fox Conservative
1950 John Hay Conservative
February 1974 Michael Heseltine Conservative
2001 Boris Johnson Conservative
2008 by-election John Howell Conservative

Elections

Elections in the 2010s

General election 2019: Henley [13]
PartyCandidateVotes%±%
Conservative John Howell 32,189 54.8 –4.3
Liberal Democrats Laura Coyle18,13630.9+16.0
Labour Zaid Marham5,6989.7–10.4
Green Jo Robb2,7364.7+1.4
Majority14,05323.9–14.9
Turnout 58,75976.6+0.3
Conservative hold Swing –10.2
General election 2017: Henley [14]
PartyCandidateVotes%±%
Conservative John Howell 33,749 59.1 +0.6
Labour Oliver Kavanagh11,45520.1+7.6
Liberal Democrats Laura Coyle8,48514.9+3.7
Green Robin Bennett1,8643.3–3.6
UKIP Tim Scott1,1542.0–8.9
The Radical PartyPatrick Gray3920.7New
Majority22,29439.0–7.0
Turnout 57,21876.3+5.4
Conservative hold Swing –3.5
General election 2015: Henley [15]
PartyCandidateVotes%±%
Conservative John Howell [16] 32,292 58.5 +2.3
Labour Sam Juthani [17] 6,91712.5+1.6
Liberal Democrats Sue Cooper [18] 6,20511.2–14.0
UKIP Christopher Jones [19] 6,00710.9+7.5
Green Mark Stevenson [20] 3,8156.9+4.4
Majority25,37546.0+15.0
Turnout 55,23670.9–0.5
Conservative hold Swing
General election 2010: Henley [21] [22]
PartyCandidateVotes%±%
Conservative John Howell 30,054 56.2 +3.0
Liberal Democrats Andy Crick13,46625.2−0.9
Labour Richard McKenzie5,83510.9−4.1
UKIP Laurence Hughes1,8173.4+0.9
Green Mark Stevenson1,3282.5−0.8
BNP John Bews1,0201.9−1.7
Majority16,58831.0+3.5
Turnout 53,52071.4+3.6
Conservative hold Swing +1.9

Elections in the 2000s

2008 Henley by-election [23]
PartyCandidateVotes%±%
Conservative John Howell 19,796 56.9 +3.4
Liberal Democrats Stephen Kearney9,68027.8+1.8
Green Mark Stevenson1,3213.8+0.5
BNP Tim Rait1,2433.6New
Labour Richard McKenzie1,0663.1−11.6
UKIP Chris Adams8432.4−0.1
Monster Raving Loony Bananaman Owen2420.7New
English Democrat Derek Allpass1570.4New
Independent Amanda Harrington1280.4New
Common Good Dick Rodgers1210.3New
Independent Louise Cole910.3New
Fur Play PartyHarry Bear730.2New
Majority10,11629.1+1.6
Turnout 34,76150.5−17.4
Conservative hold Swing +0.8

General election 2005: Henley [24] [25]
PartyCandidateVotes%±%
Conservative Boris Johnson 24,894 53.5 +7.4
Liberal Democrats David Turner12,10126.0–1.0
Labour Kaleem Saeed6,86214.7–6.4
Green Mark Stevenson1,5183.3+0.7
UKIP Delphine Gray-Fisk1,1622.5–0.7
Majority12,79327.5+8.4
Turnout 46,53767.9+3.6
Conservative hold Swing +4.2

General election 2001: Henley [25] [26]
PartyCandidateVotes%±%
Conservative Boris Johnson 20,466 46.1 –0.3
Liberal Democrats Catherine Bearder 12,00827.0+2.3
Labour Janet Matthews9,36721.1–1.6
UKIP Philip Collings1,4133.2New
Green Oliver Tickell 1,1472.6+1.6
Majority8,45819.1–2.6
Turnout 44,40164.3–13.3
Conservative hold Swing –1.3

Elections in the 1990s

General election 1997: Henley [25] [27]
PartyCandidateVotes%±%
Conservative Michael Heseltine 23,908 46.4 −13.3
Liberal Democrats Tim Horton12,74124.7+0.6
Labour Duncan Enright11,70022.7+7.8
Referendum Sebastian Sainsbury2,2994.5New
Green Susan Miles5141.0New
Natural Law Nigel Barlow2210.4–0.1
Whig PartyThomas Hibbert1600.3New
Majority11,16721.7−13.9
Turnout 51,54377.6−2.2
Conservative hold Swing -7.0
General election 1992: Henley [28] [29]
PartyCandidateVotes%±%
Conservative Michael Heseltine 30,835 59.7 −1.4
Liberal Democrats David G. Turner12,44324.1−2.2
Labour Ivan J. Russell-Swinnerton7,67614.9+2.3
Independent Alan S. Plane4310.8New
Natural Law Sara A. Banerji2740.5New
Majority18,39235.6+0.8
Turnout 51,65979.8+4.8
Conservative hold Swing +0.4

Elections in the 1980s

General election 1987: Henley [30] [31]
PartyCandidateVotes%±%
Conservative Michael Heseltine 29,978 61.1 +1.4
Liberal John Madeley12,89626.3-3.0
Labour Michael Barber 6,17312.6+3.1
Majority17,08234.8+4.4
Turnout 49,04775.0+2.1
Conservative hold Swing
General election 1983: Henley [32] [33]
PartyCandidateVotes%±%
Conservative Michael Heseltine 27,039 59.7 +1.0
Liberal Ian Brook13,25829.3+6.4
Labour Iain Roxburgh4,2829.5-9.0
Women for Life On EarthR. Johnson5171.1New
One Nation Conservative T. Rogers2130.5New
Majority13,78130.4-5.4
Turnout 45,30972.9-5.4
Conservative hold Swing

Elections in the 1970s

General election 1979: Henley [34]
PartyCandidateVotes%±%
Conservative Michael Heseltine 29,982 58.7 +9.7
Liberal Steve Atack11,69322.9-3.9
Labour D. J. Whiting9,43518.5-5.8
Majority18,28935.8+13.6
Turnout 51,11077.5+4.0
Conservative hold Swing
General election October 1974: Henley [35]
PartyCandidateVotes%±%
Conservative Michael Heseltine 22,504 49.0 +0.6
Liberal S. R. C. Evans12,28826.8-3.9
Labour I. M. Haig11,14124.3+3.4
Majority10,21622.2+4.5
Turnout 45,93373.5-7.8
Conservative hold Swing
General election February 1974: Henley [36]
PartyCandidateVotes%±%
Conservative Michael Heseltine 24,367 48.4
Liberal S. R. C. Evans15,46730.7
Labour A. Alexander10,50020.9
Majority8,90017.7
Turnout 50,33481.3
Conservative hold Swing
General election 1970: Henley [37]
PartyCandidateVotes%±%
Conservative John Hay 33,452 53.4 -2.0
Labour Maeve Judith Denby19,31030.8-13.8
Liberal Arthur William Giles8,90714.2New
Anti-Common MarketDaniel Brunner9601.5New
Majority14,14222.6+11.8
Turnout 62,62974.0-1.2
Conservative hold Swing

Elections in the 1960s

General election 1966: Henley [38]
PartyCandidateVotes%±%
Conservative John Hay 28,994 55.4 +6.2
Labour George Cunningham 23,32044.6+11.8
Majority5,67410.8-5.6
Turnout 52,31475.2-3.1
Conservative hold Swing
General election 1964: Henley [39]
PartyCandidateVotes%±%
Conservative John Hay 24,898 49.2 -4.2
Labour Co-op Arthur Ledger16,61432.8-0.1
Liberal Arthur William Giles9,08118.0+4.3
Majority8,28416.4-4.1
Turnout 50,59378.3-0.1
Conservative hold Swing

Elections in the 1950s

General election 1959: Henley [40]
PartyCandidateVotes%±%
Conservative John Hay 24,417 53.4 -5.2
Labour Co-op Arthur Ledger15,01432.9-8.5
Liberal Frederick Charles Truman6,26113.7New
Majority9,40320.5+3.3
Turnout 45,69278.4+3.0
Conservative hold Swing
General election 1955: Henley [41]
PartyCandidateVotes%±%
Conservative John Hay 24,061 58.6 +0.6
Labour Nora J T Wiles16,98041.4-0.6
Majority7,08117.2+1.2
Turnout 41,04175.4-2.9
Conservative hold Swing
General election 1951: Henley [42]
PartyCandidateVotes%±%
Conservative John Hay 23,621 58.0 +8.6
Labour Constantine Gallop17,09042.0+6.5
Majority6,53116.0+2.1
Turnout 40,71178.3-3.4
Conservative hold Swing
General election 1950: Henley [43]
PartyCandidateVotes%±%
Conservative John Hay 20,488 49.4
Labour Alan Hawkins14,70935.5
Liberal Peter Minoprio6,25515.1
Majority5,77913.9
Turnout 41,45281.7
Conservative hold Swing

Elections in the 1940s

General election 1945: Henley [44]
PartyCandidateVotes%±%
Conservative Gifford Fox 22,286 42.5 -27.9
Labour James Stewart Cook19,45737.1New
Liberal Lionel Brett 10,71820.4-9.2
Majority2,8295.4-35.4
Turnout 52,46166.3+9.4
Conservative hold Swing

Elections in the 1930s

General election 1935: Henley [45]
PartyCandidateVotes%±%
Conservative Gifford Fox 22,024 70.4 -1.8
Liberal John Herbert May9,25429.6+13.3
Majority12,77040.8-15.1
Turnout 31,27856.9-11.7
Conservative hold Swing +1.0
1932 Henley by-election [45]
PartyCandidateVotes%±%
Conservative Gifford Fox 16,553 69.9 -2.3
Liberal Richard Matthews 7,12930.1+13.8
Majority9,42439.8-16.1
Turnout 23,68248.9-19.7
Conservative hold Swing -8.05
General election 1931: Henley [45]
PartyCandidateVotes%±%
Conservative Robert Henderson 24,015 72.2 +20.3
Liberal Richard Matthews 5,41116.3-13.6
Labour Frederick J Hembury3,80911.5-6.7
Majority18,60455.9+33.9
Turnout 33,23568.6-4.7
Conservative hold Swing +16.95

Elections in the 1920s

General election 1929: Henley [45]
PartyCandidateVotes%±%
Unionist Robert Henderson 16,943 51.9 12.9
Liberal Geoffrey Tritton 9,78629.95.3
Labour Bernard Benjamin Gillis5,96218.2New
Majority7,15722.07.6
Turnout 32,69173.3+3.1
Registered electors 44,624
Unionist hold Swing 3.8
General election 1924: Henley [45]
PartyCandidateVotes%±%
Unionist Robert Henderson 14,830 64.8 +13.0
Liberal Charles Alan Bennett 8,06035.213.0
Majority6,77029.6+26.0
Turnout 22,89070.23.1
Registered electors 32,613
Unionist hold Swing +13.0
Sir Henry Rew 1922 Sir Henry Rew.jpg
Sir Henry Rew
General election 1923: Henley [45]
PartyCandidateVotes%±%
Unionist Reginald Terrell 12,092 51.8 1.3
Liberal R. Henry Rew 11,26648.2+1.3
Majority8263.62.6
Turnout 23,35873.3+3.7
Registered electors 31,873
Unionist hold Swing 1.3
General election 1922: Henley [45]
PartyCandidateVotes%±%
Unionist Reginald Terrell 11,545 53.1 14.6
Liberal R. Henry Rew 10,20446.9+14.6
Majority1,3416.229.2
Turnout 21,74969.6+17.4
Registered electors 31,246
Unionist hold Swing 14.6

Elections in the 1910s

General election 1918: Henley [45]
PartyCandidateVotes%±%
C Unionist Reginald Terrell 10,75767.7+8.6
Liberal Edmund Loftus MacNaghten5,13832.38.6
Majority5,61935.4+17.2
Turnout 15,89552.233.6
Registered electors 30,457
Unionist hold Swing +8.6
Cindicates candidate endorsed by the coalition government.
1917 Henley by-election [46]
PartyCandidateVotes%±%
Unionist Robert Hermon-Hodge Unopposed
Unionist hold
General election December 1910: Henley [46]
PartyCandidateVotes%±%
Conservative Valentine Fleming 5,340 59.1 +0.8
Liberal G.C.N. Nicholson3,70140.90.8
Majority1,63918.2+1.6
Turnout 9,04185.86.2
Registered electors 10,536
Conservative hold Swing +0.8
General election January 1910: Henley [46]
PartyCandidateVotes%±%
Conservative Valentine Fleming 5,649 58.3 +11.3
Liberal Philip Morrell 4,04641.711.3
Majority1,60316.6N/A
Turnout 9,69592.0+4.4
Registered electors 10,536
Conservative gain from Liberal Swing +11.3

Elections in the 1900s

General election 1906: Henley [46]
PartyCandidateVotes%±%
Liberal Philip Morrell 4,562 53.0 +4.2
Conservative Robert Hermon-Hodge 4,05047.04.2
Majority5126.0N/A
Turnout 8,61287.6+9.4
Registered electors 9,828
Liberal gain from Conservative Swing +4.2
General election 1900: Henley [46]
PartyCandidateVotes%±%
Conservative Robert Hermon-Hodge 3,622 51.2 1.3
Liberal H. L. Samuel3,45048.8+1.3
Majority1722.42.6
Turnout 7,07278.23.5
Registered electors 9,039
Conservative hold Swing 1.3

Elections in the 1890s

General election 1895: Henley [46]
PartyCandidateVotes%±%
Conservative Robert Hermon-Hodge 3,831 52.5 0.5
Liberal Herbert Samuel [47] 3,47047.5+0.5
Majority3615.01.0
Turnout 7,30181.7+2.0
Registered electors 8,932
Conservative hold Swing 0.5
General election 1892: Henley [46]
PartyCandidateVotes%±%
Conservative Francis Parker 3,688 53.0 5.6
Liberal Walter Phillimore 3,26947.0+5.6
Majority4196.011.2
Turnout 6,95779.7+6.4
Registered electors 8,731
Conservative hold Swing 5.6

Elections in the 1880s

General election 1886: Henley [46]
PartyCandidateVotes%±%
Conservative Francis Parker 3,674 58.6 +4.9
Liberal Walter Phillimore 2,60041.44.9
Majority1,07417.2+9.8
Turnout 6,27473.38.9
Registered electors 8,555
Conservative hold Swing +4.9
General election 1885: Henley [46]
PartyCandidateVotes%±%
Conservative Edward Vernon Harcourt 3,778 53.7
Liberal Frederick William Maude [48] 3,25846.3
Majority5207.4
Turnout 7,03682.2
Registered electors 8,555
Conservative win (new seat)

Neighbouring constituencies

See also

Notes

  1. A county constituency (for the purposes of election expenses and type of returning officer)
  2. As with all constituencies, the constituency elects one Member of Parliament (MP) by the first past the post system of election at least every five years.
  3. Johnson returned to Parliament in 2015, as the MP for Uxbridge and South Ruislip, and was in 2016 appointed Foreign Secretary in the May Ministry.

Related Research Articles

<span class="mw-page-title-main">South Oxfordshire</span> Non-metropolitan district in England

South Oxfordshire is a local government district in the ceremonial county of Oxfordshire, England. Its council is temporarily based outside the district at Abingdon-on-Thames pending a planned move to Didcot, the district's largest town. The areas located south of the River Thames are within the historic county of Berkshire.

<span class="mw-page-title-main">Hexham (UK Parliament constituency)</span> Parliamentary constituency in the United Kingdom, 1885 onwards

Hexham is a constituency in Northumberland represented in the House of Commons of the UK Parliament since 2010 by Guy Opperman, a Conservative. As with all constituencies, the constituency elects one Member of Parliament (MP) by the first past the post system of election at least every five years.

<span class="mw-page-title-main">Reading East (UK Parliament constituency)</span> Parliamentary constituency in the United Kingdom, 1983 onwards

Reading East is a constituency represented in the House of Commons of the UK Parliament since 2017 by Matt Rodda, of the Labour Party. The seat is one of two Labour seats from a total of eight seats in Berkshire.

<span class="mw-page-title-main">Reading West (UK Parliament constituency)</span> Parliamentary constituency in the United Kingdom, 1983 onwards

Reading West is a constituency represented in the House of Commons of the UK Parliament since 2010 by Alok Sharma, a Conservative.

<span class="mw-page-title-main">Oxford East (UK Parliament constituency)</span> Parliamentary constituency in the United Kingdom since 1983

Oxford East is a constituency represented in the House of Commons of the UK Parliament by Anneliese Dodds of the Labour Party, who also serves as party chair.

<span class="mw-page-title-main">Oxford West and Abingdon (UK Parliament constituency)</span> Parliamentary constituency in the United Kingdom since 1983

Oxford West and Abingdon is a constituency represented in the House of Commons of the UK Parliament since 2017 by Layla Moran, a Liberal Democrat.

<span class="mw-page-title-main">Newbury (UK Parliament constituency)</span> Parliamentary constituency in the United Kingdom since 1885

Newbury is a constituency represented in the House of Commons of the UK Parliament from 2019 by Laura Farris, a Conservative. It was created by the Redistribution of Seats Act 1885 and has been in continual existence since then.

<span class="mw-page-title-main">Wantage (UK Parliament constituency)</span> Constituency in Oxfordshire, England

Wantage is a constituency in Oxfordshire represented in the House of Commons of the Parliament of the United Kingdom by Conservative MP David Johnston.

<span class="mw-page-title-main">Sedgefield (UK Parliament constituency)</span> Parliamentary constituency in the United Kingdom since 1983

Sedgefield is a constituency in County Durham represented in the House of Commons of the UK Parliament since 2019 by Paul Howell of the Conservative Party. It elects one Member of Parliament (MP) by the first past the post system of election.

<span class="mw-page-title-main">Banbury (UK Parliament constituency)</span> Parliamentary constituency in the United Kingdom, 1801 onwards

Banbury is a constituency in Oxfordshire created in 1553 and represented in the House of Commons of the UK Parliament since 2015 by Victoria Prentis of the Conservative Party. She currently serves as Attorney General for England and Wales.

<span class="mw-page-title-main">Ashton-under-Lyne (UK Parliament constituency)</span> Parliamentary constituency in the United Kingdom, 1832 onwards

Ashton-under-Lyne is a constituency in the House of Commons of the UK Parliament. It has been represented since 2015 by Angela Rayner, who has served as Deputy Leader of the Labour Party since 2020.

<span class="mw-page-title-main">Kettering (UK Parliament constituency)</span> Parliamentary constituency in the United Kingdom, 1918 onwards

Kettering is a constituency in Northamptonshire represented in the House of Commons of the UK Parliament since 2005 by Philip Hollobone, a Conservative.

<span class="mw-page-title-main">Stratford-on-Avon (UK Parliament constituency)</span> Parliamentary constituency in the United Kingdom, 1950 onwards

Stratford-on-Avon is a constituency represented in the House of Commons of the UK Parliament since 2010 by Nadhim Zahawi, a member of the Conservative Party, who briefly served as the Chancellor of the Exchequer in mid-2022. The constituency is in Warwickshire; as its name suggests, it is centred on the town of Stratford-on-Avon, birthplace of William Shakespeare, but also takes in the surrounding areas around the town, including the towns of Alcester and Henley-in-Arden.

<span class="mw-page-title-main">Witney (UK Parliament constituency)</span> Parliamentary constituency in the United Kingdom since 1983

Witney is a county constituency in Oxfordshire represented in the House of Commons of the Parliament of the United Kingdom since 2016 by Robert Courts of the Conservative Party. It elects one Member of Parliament by the first-past-the-post system of election, and was created for the 1983 general election.

Bullingdon Rural District was a rural district in Oxfordshire, England from 1932 to 1974, covering an area to the south-east of the city of Oxford.

Woodstock, sometimes called New Woodstock, was a parliamentary constituency in the United Kingdom named after the town of Woodstock in the county of Oxfordshire.

Mid Oxfordshire was a parliamentary constituency in Oxfordshire, returning one Member of Parliament (MP) to the House of Commons of the Parliament of the United Kingdom. Unusually, its official name - Mid-Oxon - incorporated an abbreviation but the full form of the county name was and is normally used in referring to the constituency.

Henley and Thame is a proposed constituency of the House of Commons in the UK Parliament. Further to the completion of the 2023 Periodic Review of Westminster constituencies, it will first be contested at the next general election.

References

  1. "Electorate Figures – Boundary Commission for England". 2011 Electorate Figures. Boundary Commission for England. 4 March 2011. Archived from the original on 6 November 2010. Retrieved 13 March 2011.
  2. "The 2023 Review of Parliamentary Constituency Boundaries in England – Volume three: Maps | Boundary Commission for England | Page 7". boundarycommissionforengland.independent.gov.uk. Retrieved 28 June 2023.
  3. UK Polling Report http://ukpollingreport.co.uk/guide/seat-profiles/henley/
  4. "Let's move to Henley-on-Thames, Oxfordshire: it's enemy territory". the Guardian. 17 June 2016. Retrieved 30 November 2022.
  5. "HM Treasury". GOV.UK. Retrieved 30 November 2022.
  6. "Conservative Members of Parliament 2015". UK Political.info. Archived from the original on 8 June 2017. Retrieved 12 February 2017.
  7. Great Britain, Incorporated Council of Law Reporting for England and Wales. The public general acts. unknown library. Proprietors of the Law Journal Reports, 1884.
  8. 1 2 3 S., Craig, Fred W. (1972). Boundaries of parliamentary constituencies 1885-1972;. Chichester: Political Reference Publications. ISBN   0900178094. OCLC   539011.{{cite book}}: CS1 maint: multiple names: authors list (link)
  9. "The Parliamentary Constituencies (England) Order 1983". www.legislation.gov.uk. Retrieved 12 February 2019.
  10. "The Parliamentary Constituencies (England) Order 1995". www.legislation.gov.uk. Retrieved 12 February 2019.
  11. "The Parliamentary Constituencies (England) Order 2007". www.legislation.gov.uk. Retrieved 12 February 2019.
  12. Leigh Rayment's Historical List of MPs – Constituencies beginning with "H" (part 2)
  13. "Oops – we can't find that page" (PDF).
  14. "Declaration of Results of Poll - South Oxfordshire Election of a Member of Parliament for Henley" (PDF). Archived from the original (PDF) on 15 June 2018.
  15. "Election Data 2015". Electoral Calculus. Archived from the original on 17 October 2015. Retrieved 17 October 2015.
  16. "UK ELECTION RESULTS: HENLEY 2015".
  17. http://www.samjuthaniforhenley.org.uk Archived 2015-02-13 at the Wayback Machine
  18. "Sue Cooper PPC page". Liberal Democrats. Retrieved 22 February 2015.
  19. "constituencies". UKIP South East. Archived from the original on 16 February 2015. Retrieved 5 February 2015.
  20. "Mark Stevenson is the Green Party parliamentary candidate for Henley". Oxfordshire Green Party.
  21. "Election Data 2010". Electoral Calculus. Archived from the original on 26 July 2013. Retrieved 17 October 2015.
  22. "BBC NEWS – Election 2010 – Henley". BBC News.
  23. "UKPollingReport Election Guide 2010 » Henley".
  24. "Election Data 2005". Electoral Calculus. Archived from the original on 15 October 2011. Retrieved 18 October 2015.
  25. 1 2 3 Ask Aristotle: Henley, guardian.co.uk
  26. "Election Data 2001". Electoral Calculus. Archived from the original on 15 October 2011. Retrieved 18 October 2015.
  27. "Election Data 1997". Electoral Calculus. Archived from the original on 15 October 2011. Retrieved 18 October 2015.
  28. "Election Data 1992". Electoral Calculus. Archived from the original on 15 October 2011. Retrieved 18 October 2015.
  29. "Politics Resources". Election 1992. Politics Resources. 9 April 1992. Archived from the original on 24 July 2011. Retrieved 6 December 2010.
  30. "Election Data 1987". Electoral Calculus. Archived from the original on 15 October 2011. Retrieved 18 October 2015.
  31. UK General Election results June 1987
  32. "Election Data 1983". Electoral Calculus. Archived from the original on 15 October 2011. Retrieved 18 October 2015.
  33. UK General Election results June 1983
  34. UK General Election results May 1979
  35. UK General Election results October 1974
  36. UK General Election results February 1974
  37. UK General Election results 1970
  38. UK General Election results March 1966
  39. UK General Election results October 1964
  40. UK General Election results October 1959
  41. UK General Election results May 1955
  42. UK General Election results October 1951
  43. UK General Election results February 1950
  44. UK General Election results July 1945
  45. 1 2 3 4 5 6 7 8 F. W. S. Craig, British Parliamentary Election Results 1918 – 1949
  46. 1 2 3 4 5 6 7 8 9 Craig, FWS, ed. (1974). British Parliamentary Election Results: 1885-1918. London: Macmillan Press. ISBN   9781349022984.
  47. "South Oxfordshire Election" . Reading Mercury. 20 July 1895. p. 7. Retrieved 29 November 2017 via British Newspaper Archive.
  48. "The Representation of Oxfordshire" . Oxford Journal . 5 December 1885. p. 8. Retrieved 29 November 2017 via British Newspaper Archive.

Sources

51°39′N1°03′W / 51.65°N 1.05°W / 51.65; -1.05