List of countries by wealth inequality

Last updated

A map showing Gini coefficients for Wealth within countries for 2019. Gini Coefficient of Wealth Inequality source.png
A map showing Gini coefficients for Wealth within countries for 2019.

This is a list of countries by distribution of wealth , including Gini coefficients. Wealth distribution can vary greatly from income distribution in a country (see List of countries by income equality).

Contents

Higher Gini coefficients signify greater inequality in wealth distribution, with 0 being complete equality, whereas a value near 1 can arise in a situation where everybody has zero wealth except a very small minority.

It is also important to note, however, that Wealth Inequality measurements can greatly vary based on the quality of data presented. Countries that have high-quality wealth taxes and honest reporting from financial institutions, such as the Netherlands and Norway, tend to have more reliable wealth inequality statistics. [2]

List

The table below is for 2018. The GDP data is based on data from the World Bank. [3] The population data is based on data from the UN. [4] The Wealth Gini coefficients from 2008 are based on a working paper published by the National Bureau of Economic Research. [5] The Wealth Gini numbers come from the Global Wealth Databook 2018 by Credit Suisse. [6] Also the Gini Wealth coefficients for 2019 are shown. [1]


* indicates "Wealth inequality in COUNTRY or TERRITORY" or "Income inequality in COUNTRY or TERRITORY" links.

CountryWealth GiniPopulationNominal GDPGDP per capita
200820182019 % of world(in millions) % of world
 World0.8040.9040.8857,935,782,00010093,863,85110011,258
Flag of the Taliban.svg Afghanistan N/AN/A0.655N/AN/AN/AN/AN/A
Flag of Albania.svg Albania 0.6420.6290.6372,882,7400.03615,1030.0165,239
Flag of Algeria.svg Algeria 0.670.7580.74942,228,4200.530.5504,115
Flag of Angola.svg Angola N/AN/A0.731N/AN/AN/AN/AN/A
Flag of Antigua and Barbuda.svg Antigua and Barbuda 0.7470.8380.82396,2800.00121,6110.001716,732
Flag of Argentina.svg Argentina * 0.740.7920.76844,361,1500.560.58011,719
Flag of Armenia.svg Armenia 0.6840.6450.6632,951,7400.03712,4330.0134,212
Flag of Aruba.svg Aruba N/AN/A0.703N/AN/AN/AN/AN/A
Flag of Australia (converted).svg Australia 0.6220.6580.65624,898,1500.311,433,9041.557,591
Flag of Austria.svg Austria 0.6460.7640.7398,891,3800.11455,2860.4951,205
Flag of Azerbaijan.svg Azerbaijan 0.6780.6430.6549,949,5400.1346,9400.0504,718
Flag of the Bahamas.svg Bahamas N/AN/A0.828N/AN/AN/AN/AN/A
Flag of Bahrain.svg Bahrain N/AN/A0.747N/AN/AN/AN/AN/A
Flag of Bangladesh.svg Bangladesh 0.660.6710.678161,376,7102.02.1101,698
Flag of Barbados.svg Barbados 0.7060.7880.778285,7200.00364,9900.005317,465
Flag of Belarus.svg Belarus 0.6280.6140.6219,452,6200.1259,6620.0646,312
Flag of Belgium (civil).svg Belgium 0.6620.6590.60311,482,1800.14542,7610.5847,270
Flag of Belize.svg Belize 0.7630.8150.803383,0700.00481,8710.00204,884
Flag of Benin.svg Benin 0.7130.6890.70711,485,0400.1410,3540.011902
Bandera de Bolivia (Estado).svg Bolivia 0.7620.7790.76411,050,0000.1440,2880.0433,646
Flag of Bosnia and Herzegovina.svg Bosnia and Herzegovina N/AN/A0.6423,301021,0230.0226,056
Flag of Botswana.svg Botswana 0.7510.7830.82,254.07018,6160.0208,259
Flag of Brazil.svg Brazil * 0.620.8230.849209,469,3202.62.7408,921
Flag of Brunei.svg Brunei N/AN/A0.787N/AN/AN/AN/AN/A
Flag of Bulgaria.svg Bulgaria 0.6520.6470.6597,051,6100.08965,1330.0699,237
Flag of Burkina Faso.svg Burkina Faso 0.7280.6740.68819,751,4700.2514,1250.015715
Flag of Burundi.svg Burundi 0.6990.6540.68111,175,3800.143,0370.0032272
Flag of Cambodia.svg Cambodia 0.7140.7040.71816,249,8000.2024,5420.0261,510
Flag of Cameroon.svg Cameroon 0.7110.7250.74325,216,2600.3238,6750.0411,534
Flag of Canada (Pantone).svg Canada 0.6880.7260.72837,074,5600.471,713,3421.846,213
Flag of the Central African Republic.svg Central African Republic 0.7820.7680.7774,666,3800.0592,2200.0024476
Flag of Chad.svg Chad 0.6810.7150.7315,477,7300.200.20728
Flag of Chile.svg Chile 0.7770.7730.79818,729,1700.24331,2500.3515,923
Flag of the People's Republic of China.svg China * 0.550.7140.7021,427,647,7901815,710,960179,532
Flag of Colombia.svg Colombia 0.7650.8070.7749,661,0600.630.6506,666
Flag of the Comoros.svg Comoros 0.7110.7660.783832,3200.0101,1780.00131,415
Flag of the Democratic Republic of the Congo.svg DR Congo N/AN/A0.755N/AN/AN/AN/AN/A
Flag of the Republic of the Congo.svg Congo N/AN/A0.769N/AN/AN/AN/AN/A
Flag of Costa Rica.svg Costa Rica 0.7320.7690.754,999,4400.0630.07012,027
Flag of Croatia.svg Croatia 0.6540.6310.6454,156,4100.05260,9720.06514,669
Flag of Cyprus.svg Cyprus N/AN/A0.801N/AN/AN/AN/AN/A
Flag of the Czech Republic.svg Czech Republic 0.6260.7580.72510,649,8000.13245,2260.2623,026
Flag of Denmark.svg Denmark * 0.8080.8350.8385,752,1300.072355,6750.3861,834
Flag of Djibouti.svg Djibouti N/AN/A0.729N/AN/AN/AN/AN/A
Flag of Dominica.svg Dominica 0.7630.840.82371,6300.00090007,693
Flag of the Dominican Republic.svg Dominican Republic 0.723N/AN/A10,627.150.0001385,5550.0918,051
Flag of Ecuador.svg Ecuador * 0.760.7760.75917,084,3600.220.2206,345
Flag of Egypt.svg Egypt 0.6890.9090.75699,581,2001.3250,8950.272,520
Flag of El Salvador.svg El Salvador 0.7460.7590.7436,420,7400.08126,0570.0284,058
Flag of Equatorial Guinea.svg Equatorial Guinea 0.6880.7810.7931,308,9700.01613,4320.01410,262
Flag of Eritrea.svg Eritrea N/AN/A0.621N/AN/AN/AN/AN/A
Flag of Estonia.svg Estonia 0.6750.7150.7161,322,9100.01730,7320.03323,231
Flag of Eswatini.svg Eswatini 0.78N/AN/A1,136.2704,7110.00504,146
Flag of Ethiopia.svg Ethiopia 0.6520.6120.62109,224,4101.41.430772
Flag of Fiji.svg Fiji 0.7090.6940.702883,4900.0115,5370.00596,267
Flag of Finland.svg Finland 0.6150.7670.7425,522,5900.070276,7430.2950,111
Flag of France.svg France * 0.730.6870.69664,990,5100.823,135,2673.342,738
Flag of Gabon.svg Gabon 0.7840.70.7192,119.28016,8540.0187,953
Flag of The Gambia.svg Gambia 0.7230.7550.7712,051,3600.0261,6330.0017796
Flag of Georgia.svg Georgia 0.7250.6780.6874,002,9500.05017,6000.0194,397
Flag of Germany.svg Germany * 0.6670.8160.81683,124,4101.03,947,6204.247,491
Flag of Ghana.svg Ghana 0.6920.6820.69929,767,1100.3865,5560.0702,202
Flag of Greece.svg Greece 0.6540.6820.65410,522,2400.13218,0320.2320,721
Flag of Grenada.svg Grenada 0.7630.8420.827111,4500.00141,1860.001310,642
Flag of Guatemala.svg Guatemala * 0.779N/AN/A17,247.860.0002278,4600.0844,549
Flag of Guinea.svg Guinea 0.6930.7160.74112,414,2900.1610,9070.012879
Flag of Guinea-Bissau.svg Guinea-Bissau 0.710.6970.7121,874,3000.0240.020778
Flag of Guyana.svg Guyana 0.7070.750.734779,0100.00980.0104,979
Flag of Haiti.svg Haiti 0.7550.820.80111,123,1800.140.150868
Flag of Honduras.svg Honduras * 0.7430.804N/A9,587.520.0001223,9700.0262,500
Flag of Hong Kong.svg Hong Kong 0.740N/A0.7777,482.50362,6820.3948,471
Flag of Hungary.svg Hungary * 0.6510.6620.6639,707,5000.12157,8830.1716,264
Flag of Iceland.svg Iceland 0.6640.7310.694336,7100.004225,8780.02876,855
Flag of India.svg India * 0.6690.8540.8321,352,642,280172,718,7322.92,010
Flag of Indonesia.svg Indonesia * 0.7640.840.833267,670,5503.43.5103,893
Flag of Iran.svg Iran 0.7070.7050.70582,531,7001.0454,0130.485,501
Flag of Iraq.svg Iraq N/AN/A0.633N/AN/AN/AN/AN/A
Flag of Ireland.svg Ireland 0.5810.830.7964,818,6900.061511,4580.54102,394
Flag of Israel.svg Israel 0.6770.7660.7778,381,5100.11370,5880.3944,215
Flag of Italy.svg Italy 0.6090.6890.66960,627,2900.762,083,8642.234,372
Flag of Cote d'Ivoire.svg Ivory Coast 0.712N/AN/A25,069.230.0003243,0070.0461,716
Flag of Jamaica.svg Jamaica 0.6860.7880.7752,934,8500.03715,7140.0175,354
Flag of Japan.svg Japan 0.5470.6310.626127,202,1901.64,971,3235.339,082
Flag of Jordan.svg Jordan 0.6780.6770.6969,965,3200.1342,2310.0454,238
Flag of Kazakhstan.svg Kazakhstan 0.6550.9520.77218,319,6200.23179,3400.199,790
Flag of Kenya.svg Kenya 0.6990.7320.74551,392,5700.6587,9080.0941,711
Flag of Kuwait.svg Kuwait N/AN/A0.763N/AN/AN/AN/AN/A
Flag of Kyrgyzstan.svg Kyrgyzstan 0.680.6730.6816,389,5000.0810.0801,267
Flag of Laos.svg Laos N/AN/A0.794N/AN/AN/AN/AN/A
Flag of Latvia.svg Latvia 0.670.7880.7891,928,4600.0240.03017,843
Flag of Lebanon.svg Lebanon * 0.7620.8890.8196,859,4100.08656,6390.0608,257
Flag of Lesotho.svg Lesotho 0.7670.7950.8052,108,3300.0272,7390.00291,299
Flag of Liberia.svg Liberia N/AN/A0.727N/AN/AN/AN/AN/A
Flag of Libya.svg Libya N/AN/A0.659N/AN/AN/AN/AN/A
Flag of Lithuania.svg Lithuania 0.6660.6550.6632,801,2700.03553,4290.05719,073
Flag of Luxembourg.svg Luxembourg 0.650.6630.67604,2400.00760.010117,312
Flag of Macau.svg Macau 0.58N/AN/A667.4055,0840.05982,535
Flag of Madagascar.svg Madagascar 0.7220.7020.72226,262,3100.3313,8530.015527
Flag of Malawi.svg Malawi 0.7360.7330.75118,143,2200.237,0650.0075389
Flag of Malaysia.svg Malaysia * 0.7330.820.79631,528,0300.400.41011,373
Flag of Maldives.svg Maldives * N/AN/A0.724N/AN/AN/AN/AN/A
Flag of Mali.svg Mali 0.750.6820.70719,077,7600.240.250900
Flag of Malta.svg Malta 0.6640.6310.64439,2600.00550.01033,131
Flag of Mauritania.svg Mauritania 0.6860.6670.6814,403,3100.0555,2350.00561,189
Flag of Mauritius.svg Mauritius 0.6610.640.6621,267,1800.0160.02011,222
Flag of Mexico.svg Mexico * 0.7490.80.777126,190.780.00161,220,6991.39,673
Flag of Moldova.svg Moldova N/AN/A0.645N/AN/AN/AN/AN/A
Flag of Mongolia.svg Mongolia N/AN/A0.668N/AN/AN/AN/AN/A
Flag of Montenegro.svg Montenegro N/AN/A0.648N/AN/AN/AN/AN/A
Flag of Morocco.svg Morocco 0.690.8020.76636,029,0900.450.47003,273
Flag of Mozambique.svg Mozambique 0.6890.70.71629,4960.0003714,7170.016499
Flag of Myanmar.svg Myanmar N/AN/A0.597N/AN/AN/AN/AN/A
Flag of Namibia.svg Namibia 0.8470.7760.7882,448,3000.03114,5220.0155,931
Flag of Nepal.svg Nepal N/AN/A0.71N/AN/AN/AN/AN/A
Flag of the Netherlands.svg Netherlands * 0.650.7890.90217,059,5600.21912,2420.9753,557
Flag of New Zealand.svg New Zealand * 0.6510.7080.6724,743,1300.060204,9240.2243,204
Flag of Nicaragua.svg Nicaragua 0.7550.7780.7596,465,5000.08113,1180.0142,029
Flag of Niger.svg Niger 0.7290.660.68222,442,8300.280.290414
Flag of Nigeria.svg Nigeria 0.7290.8940.809195,874,6902.5397,2700.422,028
Flag of North Macedonia.svg North Macedonia 0.6610.655N/A2,082.96012,6720.0146,084
Flag of Norway.svg Norway 0.6330.7910.7985,337,9600.067434,1670.4681,336
Flag of Oman.svg Oman N/AN/A0.786N/AN/AN/AN/AN/A
Flag of Pakistan.svg Pakistan 0.6980.650.665212,228,2902.72.78001,482
Flag of Panama.svg Panama 0.7660.7950.784,176,8700.0530.05015,575
Flag of Papua New Guinea.svg Papua New Guinea 0.7380.760.7668,606,3200.110.1102,730
Flag of Paraguay.svg Paraguay 0.7660.7850.7686,956,0700.08840,4970.0435,822
Flag of Peru.svg Peru 0.7380.7950.78831,989,2700.40222,0450.246,941
Flag of the Philippines.svg Philippines * 0.7170.8260.837106,651,3901.3330,9100.353,103
Flag of Poland.svg Poland * 0.6570.7220.67737,921,5900.48585,6640.6215,444
Flag of Portugal.svg Portugal 0.6670.7360.69210,256,1900.13240,6750.2623,466
Flag of Puerto Rico.svg Puerto Rico 0.753N/AN/A3,039.60101,1310.1133,271
Flag of Qatar.svg Qatar N/AN/A0.633N/AN/AN/AN/AN/A
Flag of Romania.svg Romania 0.6510.7280.64719,506,1100.25239,5530.2612,281
Flag of Russia.svg Russia * 0.6990.8750.879146,801,9301.81,657,5551.811,291
Flag of Rwanda.svg Rwanda 0.7140.7280.74212,301,9700.169,5090.010773
Flag of Samoa.svg Samoa N/AN/A0.747N/AN/AN/AN/AN/A
Flag of Sao Tome and Principe.svg São Tomé and Príncipe N/AN/A0.674N/AN/AN/AN/AN/A
Flag of Saudi Arabia.svg Saudi Arabia 0.7370.810.83433,702,7600.420.44023,337
Flag of Senegal.svg Senegal 0.6970.7050.72615,854,3200.2024,1300.0261,522
Flag of Serbia.svg Serbia N/AN/A0.6766,963.76055,4370.0597,992
Flag of the Seychelles.svg Seychelles 0.760.6790.70497,0900.00120016,376
Flag of Sierra Leone.svg Sierra Leone 0.6870.6710.6947,650,1500.0964,0850.0044534
Flag of Singapore.svg Singapore * 0.6890.7580.7575,757,5000.073364,1570.3963,249
Flag of Slovakia.svg Slovakia 0.6290.4980.4985,453,0200.069105,9050.1119,421
Flag of Slovenia.svg Slovenia 0.6260.6460.6622,077,8400.02654,0080.05825,992
Flag of the Solomon Islands.svg Solomon Islands N/AN/A0.7N/AN/AN/AN/AN/A
Flag of South Africa.svg South Africa * 0.7630.8060.80657,792,5200.73368,2890.396,373
Flag of South Korea.svg South Korea * 0.5790.670.60651,709,1000.651,823,8521.935,196
Flag of Spain.svg Spain 0.570.6970.69446,692,8600.590.61030,391
Flag of Sri Lanka.svg Sri Lanka 0.6650.6870.721,228.760.0002788,9010.0954,188
Flag of Saint Lucia.svg Saint Lucia N/AN/A0.728N/AN/AN/AN/AN/A
Flag of Saint Vincent and the Grenadines.svg Saint Vincent and the Grenadines N/AN/A0.818N/AN/AN/AN/AN/A
Flag of Sudan.svg Sudan N/AN/A0.687N/AN/AN/AN/AN/A
Flag of Suriname.svg Suriname N/AN/A0.832N/AN/AN/AN/AN/A
Flag of Sweden.svg Sweden * 0.7420.8650.8679,971,6300.13556,0860.5955,767
Flag of Switzerland.svg Switzerland 0.8030.7410.7058,570,1500.11705,1400.7582,279
Flag of Syria.svg Syria N/AN/A0.699N/AN/AN/AN/AN/A
Flag of the Republic of China.svg Taiwan N/AN/A0.751N/AN/AN/AN/AN/A
Flag of Tajikistan.svg Tajikistan N/AN/A0.656N/AN/AN/AN/AN/A
Flag of Tanzania.svg Tanzania 0.6760.650.66156,313,4400.710.7401,030
Flag of Thailand.svg Thailand 0.710.9020.84669,428,4500.870.9107,274
Flag of East Timor.svg East Timor N/AN/A0.565N/AN/AN/AN/AN/A
Flag of Togo.svg Togo 0.7110.7190.7347,889,1000.0995,3590.0057679
Flag of Tonga.svg Tonga N/AN/A0.682N/AN/AN/AN/AN/A
Flag of Trinidad and Tobago.svg Trinidad and Tobago 0.6890.7480.7321,389,8400.01823,8080.02517,130
Flag of Tunisia.svg Tunisia 0.6930.6830.70511,565,2000.1539,8710.0423,447
Flag of Turkey.svg Turkey 0.7180.8710.79482,340,0901.0771,3500.829,368
Flag of Turkmenistan.svg Turkmenistan N/AN/A0.63N/AN/AN/AN/AN/A
Flag of Uganda.svg Uganda 0.7230.7140.72942,729,0300.5427,4610.029643
Flag of Ukraine.svg Ukraine 0.6670.9550.84744,246,1600.56130,8320.142,957
Flag of the United Arab Emirates.svg United Arab Emirates N/AN/A0.796N/AN/AN/AN/AN/A
Flag of the United Kingdom.svg United Kingdom 0.6970.7470.74667,141,6800.852,855,2973.042,526
Flag of the United States.svg United States * 0.8010.8520.852327,096,2604.120,544,3432262,808
Flag of Uruguay.svg Uruguay 0.7080.7410.7213,449,2900.04359,5970.06317,278
Flag of Vanuatu.svg Vanuatu N/AN/A0.688N/AN/AN/AN/AN/A
Flag of Venezuela.svg Venezuela N/AN/A0.743N/AN/AN/AN/AN/A
Flag of Vietnam.svg Vietnam 0.6820.7080.76195,545,9601.2245,2140.262,566
Flag of Yemen.svg Yemen 0.6130.8010.79828,498,6800.3626,9140.029944
Flag of Zambia.svg Zambia 0.7660.7870.79817,351,7100.2226,7200.0281,540
Flag of Zimbabwe.svg Zimbabwe 0.8450.7070.71914,438,8100.1831,0010.0332,147

See also

Related Research Articles

Gini coefficient Measure of inequality in the income or wealth distribution

In economics, the Gini coefficient, also the Gini index and the Gini ratio, is a measure of statistical dispersion intended to represent the income inequality or the wealth inequality within a nation or a social group. The Gini coefficient was developed by statistician and sociologist Corrado Gini.

Lorenz curve Graphical representation of the distribution of income or of wealth

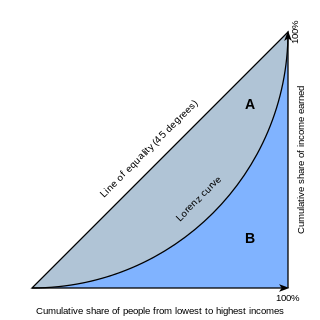
In economics, the Lorenz curve is a graphical representation of the distribution of income or of wealth. It was developed by Max O. Lorenz in 1905 for representing inequality of the wealth distribution.

Wealth Abundance of valuable financial assets or physical possessions which can be converted into a form that can be used for transactions

Wealth is the abundance of valuable financial assets or physical possessions which can be converted into a form that can be used for transactions. This includes the core meaning as held in the originating Old English word weal, which is from an Indo-European word stem. The modern concept of wealth is of significance in all areas of economics, and clearly so for growth economics and development economics, yet the meaning of wealth is context-dependent. An individual possessing a substantial net worth is known as wealthy. Net worth is defined as the current value of one's assets less liabilities.

Economic inequality Divergence in economic well-being within a group

There are wide varieties of economic inequality, most notably measured using the distribution of income and the distribution of wealth. Besides economic inequality between countries or states, there are important types of economic inequality between different groups of people.

In economics, income distribution covers how a country's total GDP is distributed amongst its population. Economic theory and economic policy have long seen income and its distribution as a central concern. Classical economists such as Adam Smith (1723–1790), Thomas Malthus (1766–1834), and David Ricardo (1772–1823) concentrated their attention on factor income-distribution, that is, the distribution of income between the primary factors of production. Modern economists have also addressed issues of income distribution, but have focused more on the distribution of income across individuals and households. Important theoretical and policy concerns include the balance between income inequality and economic growth, and their often inverse relationship.

Income inequality metrics or income distribution metrics are used by social scientists to measure the distribution of income and economic inequality among the participants in a particular economy, such as that of a specific country or of the world in general. While different theories may try to explain how income inequality comes about, income inequality metrics simply provide a system of measurement used to determine the dispersion of incomes. The concept of inequality is distinct from poverty and fairness.

Distribution of wealth Spread of wealth in a society

The distribution of wealth is a comparison of the wealth of various members or groups in a society. It shows one aspect of economic inequality or economic heterogeneity.

International inequality Inequality between nations wealth

International inequality refers to inequality between countries, as compared to global inequality, which is inequality between people across countries. International inequality research has primarily been concentrated on the rise of international income inequality, but other aspects include educational and health inequality, as well as differences in medical access. Reducing inequality within and among countries is the 10th goal of the UN Sustainable Development Goals and ensuring that no one is left behind is central to achieving them. Inequality can be measured by metrics such as the Gini coefficient.

Income inequality in the United States National income inequality

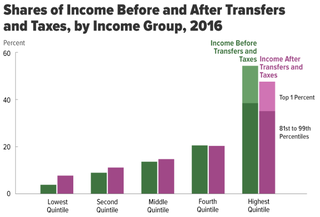
Income inequality in the United States is the extent to which income is distributed in differing amounts among the American population. It has fluctuated considerably since measurements began around 1915, moving in an arc between peaks in the 1920s and 2000s, with a 30-year period of relatively lower inequality between 1950 and 1980.

Income in India Overview of the income in India

Income in India discusses the financial state in India. With rising economic growth and prosperity, India’s income is also rising rapidly. As an overview, India's per capita net national income or NNI was around 135 thousand rupees in 2020. The per-capita income is a crude indicator of the prosperity of a country. In contrast, the gross national income at constant prices stood at over 128 trillion rupees. The same year, GNI growth rate at constant prices was around 6.6 percent. While GNI and NNI are both indicators for a country's economic performance and welfare, the GNI is related to the GDP or the gross domestic product plus the net receipts from abroad, including wages and salaries, property income, net taxes and subsidies receivable from abroad. On the other hand, the NNI of a country is equal to its GNI net of depreciation.

Social inequality Uneven distribution of resources in a society

Social inequality occurs when resources in a given society are distributed unevenly, typically through norms of allocation, that engender specific patterns along lines of socially defined categories of persons. It is the differentiation preference of access of social goods in the society brought about by power, religion, kinship, prestige, race, ethnicity, gender, age, sexual orientation, and class. Social inequality usually implies the lack of equality of outcome, but may alternatively be conceptualized in terms of the lack of equality of access to opportunity. The social rights include labor market, the source of income, health care, and freedom of speech, education, political representation, and participation.

Wealth inequality in the United States Overview of the wealth inequality in the United States

Wealth inequality in the United States, also known as the wealth gap, is the unequal distribution of assets among residents of the United States. Wealth commonly includes the values of any homes, automobiles, personal valuables, businesses, savings, and investments, as well as any associated debts. As of Q3 2019, the top 10% of households in the United States held 70% of the country's wealth, while the bottom 50% held 2%. Wealth commonly includes the values of any homes, automobiles, personal valuables, businesses, savings, and investments, as well as any associated debts. From an international perspective, the difference in US median and mean wealth per adult is over 600%. A 2011 study found that US citizens across the political spectrum dramatically underestimate the current level of wealth inequality in the US, and would prefer a far more egalitarian distribution of wealth.

Wealth distribution by country Statistical data that describes how wealth is distributed around the world

World distribution of wealth is the distribution of how wealth is distributed around the world. The guideline for categorizing the data is to organize it based on the continent on which the people with wealth reside.

Anthony Shorrocks British development economist

Anthony F. Shorrocks is a British development economist.

Income inequality in India Overview of Indias income inequality

Income inequality in India refers to the unequal distribution of wealth and income among its citizens. According to the CIA World Factbook, the Gini coefficient of India, which is a measure of income distribution inequality, was 35.2 in 2011, ranking 95th out of 157. Wealth distribution is also uneven, with one report estimating that 54% of the country's wealth is controlled by millionaires, the second highest after Russia, as of November 2016. The richest 1% of Indians own 58% of wealth, while the richest 10% of Indians own 80% of the wealth. This trend has consistently increased, meaning the rich are getting richer much faster than the poor, widening the income gap. Inequality worsened since the establishment of income tax in 1922, overtaking the British Raj's record of the share of the top 1% in national income, which was 20.7% in 1939–40.

Wealth is the total sum value of monetary assets and valuable material possessions owned by an individual, minus private debt, at a set point in time.

References

  1. 1 2 "Global wealth databook 2019" (PDF). Credit Suisse.
  2. Zucman, Gabriel (March 2016). "State of the Union 2016: Wealth Inequality" (PDF). Stanford.{{cite web}}: CS1 maint: url-status (link)
  3. "Gross Domestic Product 2018" (PDF). World Bank. 2018. Retrieved 2020-01-18.
  4. "World Population Prospects, the 2019 revision". United Nations. June 2019. Retrieved 2020-01-18.
  5. The Level and Distribution of Global Household Wealth. April 2008. By James B. Davies, Susanna Sandström, Anthony Shorrocks, and Edward N. Wolff.
  6. "Global Wealth Databook 2018" (PDF). Credit Suisse. Retrieved 2020-01-15.