
This article includes three versions of the list of countries by crude birth rate .

This article includes three versions of the list of countries by crude birth rate .
Crude birth rate refers to the number of births over a given period divided by the person-years lived by the population over that period.
It is expressed as number of births per 1,000 population. Lists 236 countries and territories in 2011 crude birth rate.
The first list is based on World Bank Data for the year 2018. [1]
The second list is based on the Organization for Economic Cooperation and Development (OECD) "2011 annual statistics".
The third, fourth and fifth lists are based on CIA World Factbook estimates for years 2013, 2014 and 2020. [2] Dependent territories and not fully recognized states are not ranked.
The sixth list is provided by Population Reference Bureau. [3]
| Country/territory | WB 2018 (Rate ‰) | OECD 2011 (Rate ‰) | CIA WF 2013 (Rate ‰) | CIA WF 2014 (Rate ‰) | CIA WF 2020 (Rate ‰) | PRB 2022 (Rate ‰) |
|---|---|---|---|---|---|---|
| 32 | 45.1 | 39.05 | 38.84 | 36.7 | 36 | |
| 12 | 11.5 | 12.57 | 12.73 | 13.0 | 10 | |
| 24 | 24.8 | 24.25 | 23.99 | 20.0 | 22 | |
| 7 | 10.2 | 8.88 | 8.48 | 7.0 | 6 | |
| 41 | 40.9 | 39.16 | 38.97 | 42.7 | 39 | |
| 15 | 13.8 | 16.07 | 15.94 | 15.4 | 12 | |
| 17 | 18.7 | 17.12 | 16.88 | 16.0 | 14 | |
| 14 | 13.3 | 12.86 | 13.92 | 11.9 | 12 | |
| 13 | 13.3 | 12.23 | 12.19 | 12.4 | 12 | |
| 10 | 9.3 | 8.73 | 8.76 | 9.5 | 10 | |
| 14 | 19.4 | 17.17 | 16.96 | 14.5 | 13 | |
| 14 | 13.8 | 15.81 | 15.65 | 14.8 | 11 | |
| 14 | 15 | 14.16 | 13.92 | 12.7 | 12 | |
| 18 | 19.2 | 22.07 | 21.61 | 18.1 | 18 | |
| 11 | 12.2 | 12.1 | 11.97 | 11.3 | 8 | |
| 10 | 11.5 | 10.99 | 10.86 | 9.5 | 9 | |
| 10 | 11.9 | 10 | 9.99 | 11.1 | 10 | |
| 21 | 22.1 | 25.58 | 25.14 | 22.0 | 17 | |
| 36 | 37.3 | 37.02 | 36.51 | 42.1 | 36 | |
| 17 | 20.7 | 18.43 | 18.12 | 16.3 | 14 | |
| 22 | 23.77 | 23.28 | 20.8 | 22 | ||
| 8 | 8.3 | 8.92 | 8.89 | 8.6 | 7 | |
| 25 | 24.8 | 21.69 | 21.34 | 20.9 | 24 | |
| 13.2 | 15.2 | 14.64 | 14.32 | 12.6 | 13 | |
| 15 | 15.5 | 17.63 | 17.49 | 16.5 | 14 | |
| 9 | 9.6 | 9.07 | 8.92 | 8.3 | 9 | |
| 38 | 45 | 42.81 | 42.42 | 35.1 | 35 | |
| 39 | 33.3 | 40.04 | 42.33 | 36.5 | 35 | |
| 22 | 25.4 | 24.88 | 24.40 | 21.3 | 22 | |
| 35 | 34.2 | 31.93 | 36.58 | 36.3 | 35 | |
| 10 | 11.2 | 10.28 | 10.29 | 10.2 | 10 | |
| 19 | 20.96 | 20.72 | 19.1 | 15 | ||
| 35 | 33.2 | 35.8 | 35.45 | 33.2 | 43 | |
| 42 | 43.2 | 37.99 | 37.29 | 41.7 | 43 | |
| 12 | 14.5 | 14.12 | 13.97 | 13.1 | 11 | |
| 11 | 11.9 | 12.25 | 12.17 | 11.6 | 8 | |
| 15 | 18.9 | 16.98 | 16.73 | 15.4 | 15 | |
| 32 | 29.4 | 30.26 | 29.05 | 23.6 | 29 | |
| 41 | 31.9 | 39.63 | 36.59 | 41.0 | 42 | |
| 33 | 42.5 | 36.34 | 35.62 | 32.6 | 31 | |
| 14 | 15.9 | 16.25 | 16.08 | 14.8 | 11 | |
| 36 | 32.8 | 29.83 | 29.25 | 29.1 | 34 | |
| 9 | 9.4 | 9.53 | 9.49 | 8.7 | 9 | |
| 10 | 11.8 | 9.92 | 9.90 | 10.4 | 9 | |
| 10 | 11.3 | 11.45 | 11.44 | 10.9 | 10 | |
| 11 | 10.4 | 8.55 | 9.79 | 8.9 | 11 | |
| 11 | 10.6 | 10.2 | 10.22 | 11.1 | 11 | |
| 21 | 26.5 | 24.5 | 24.08 | 22.7 | 22 | |
| 12.8 | 15.61 | 15.53 | 14.5 | 13 | ||
| 20 | 21.1 | 19.21 | 18.97 | 18.5 | 18 | |
| 20 | 15.1 | 19.23 | 18.87 | 17.0 | 17 | |
| 26 | 30.4 | 23.79 | 23.35 | 27.2 | 21 | |
| 18 | 20 | 17.12 | 16.79 | 18.6 | 16 | |
| 33 | 37.4 | 34.35 | 33.83 | 30.7 | 30 | |
| 30 | 33.6 | 31.39 | 30.69 | 27.9 | 29 | |
| 11 | 11 | 10.38 | 10.29 | 9.3 | 9 | |
| 26 | 31.1 | 25.69 | 25.18 | 24.5 | 24 | |
| 32 | 35.7 | 38.07 | 37.66 | 31.6 | 32 | |
| 21 | 21.4 | 20.28 | 19.86 | 17.4 | 19 | |
| 9 | 11.1 | 10.36 | 10.35 | 10.6 | 9 | |
| 11 | 12.6 | 12.6 | 12.49 | 11.9 | 11 | |
| 32 | 34.82 | 34.64 | 26.3 | 27 | ||
| 39 | 34.6 | 32.59 | 31.75 | 27.0 | 33 | |
| 13 | 12.9 | 12.9 | 16.3 | 11.6 | 12 | |
| 10 | 8.1 | 8.37 | 8.42 | 8.6 | 10 | |
| 29 | 30.8 | 31.7 | 31.40 | 29.6 | 28 | |
| 8 | 9.2 | 8.94 | 8.80 | 7.8 | 8 | |
| 16 | 16.5 | 16.57 | 16.30 | 14.6 | 16 | |
| 25 | 30.5 | 25.99 | 25.46 | 23.3 | 21 | |
| 36 | 37.3 | 36.3 | 36.02 | 36.1 | 34 | |
| 35 | 39.4 | 34.28 | 33.83 | 36.9 | 31 | |
| 20 | 16.6 | 16.31 | 15.90 | 15.5 | 20 | |
| 24 | 26 | 23.35 | 22.83 | 21.7 | 23 | |
| 22 | 27.3 | 24.16 | 23.66 | 18.5 | 21 | |
| 10 | 8.8 | 9.37 | 9.26 | 8.8 | 9 | |
| 12 | 14.1 | 13.15 | 13.09 | 13.3 | 13 | |
| 18 | 21.8 | 20.24 | 19.89 | 18.2 | 20 | |
| 18 | 18.1 | 17.38 | 17.04 | 15.4 | 16 | |
| 19 | 18.2 | 18.4 | 18.23 | 16.3 | 14 | |
| 29 | 31 | 27.51 | 26.85 | 25.7 | 27 | |
| 13 | 16.3 | 15.5 | 15.18 | 13.0 | 12 | |
| 21 | 21.4 | 18.71 | 18.44 | 17.6 | 20 | |
| 7 | 9.1 | 8.94 | 8.84 | 8.4 | 7 | |
| 16 | 15.2 | 18.65 | 18.41 | 16.1 | 12 | |
| 7 | 8.3 | 8.23 | 8.07 | 7.3 | 7 | |
| 22 | 28.9 | 26.23 | 25.23 | 23.0 | 18 | |
| 22 | 22.5 | 20.03 | 19.61 | 16.4 | 23 | |
| 29 | 36.1 | 30.08 | 28.27 | 27.2 | 28 | |
| 27.8 | 22.18 | 21.85 | 20.5 | 26 | 27 | |
| 14 | 14.4 | 14.49 | 14.51 | 14.5 | 13 | |
| 6 | 9.4 | 8.33 | 8.26 | 8.2 | 5 | |
| 14 | 16 | 20.61 | 20.26 | 18.0 | 12 | |
| 27 | 27.1 | 23.67 | 23.33 | 20.6 | 24 | |
| 24 | 28 | 25.23 | 24.76 | 22.4 | 21 | |
| 10 | 9.1 | 9.91 | 9.79 | 9.2 | 9 | |
| 18 | 24.3 | 14.79 | 14.80 | 13.6 | 15 | |
| 27 | 30.4 | 26.31 | 25.92 | 23.2 | 26 | |
| 33 | 36.1 | 35.75 | 35.07 | 37.3 | 31 | |
| 19 | 21.5 | 18.74 | 18.40 | 23.0 | 17 | |
| 10 | 10.9 | 10.67 | 10.53 | 10.4 | 9 | |
| 10 | 11.3 | 9.36 | 9.36 | 9.5 | 9 | |
| 10 | 10.9 | 11.72 | 11.75 | 11.6 | 10 | |
| 11 | 11.1 | 11.72 | 11.64 | 10.7 | ||
| 33 | 33.5 | 33.58 | 33.12 | 29.9 | 35 | |
| 34 | 44.6 | 39.98 | 41.80 | 40.1 | 33 | |
| 17 | 17.5 | 20.41 | 20.06 | 18.3 | 14 | |
| 14 | 22.4 | 15.38 | 15.59 | 16.0 | 13 | |
| 42 | 45.4 | 46.06 | 45.53 | 42.2 | 42 | |
| 9 | 10.2 | 10.27 | 10.24 | 9.9 | 9 | |
| 31.1 | 27.21 | 26.36 | 22.8 | 19 | ||
| 34 | 33.2 | 32.31 | 31.83 | 29.0 | 39 | |
| 10 | 11.4 | 13.62 | 13.46 | 12.6 | 10 | |
| 18 | 17.5 | 18.61 | 19.02 | 17.6 | 15 | |
| 23 | 23.5 | 21.44 | 20.97 | 18.9 | ||
| 10 | 11 | 12.38 | 12.21 | 10.7 | 11 | |
| 6 | 7.3 | 6.79 | 6.72 | 6.4 | 25 | |
| 24 | 25.1 | 20.34 | 20.88 | 16.6 | 22 | |
| 12 | 11.6 | 10.75 | 10.59 | 11.5 | 11 | |
| 19 | 18.8 | 18.73 | 18.47 | 17.9 | 17 | |
| 38 | 41.4 | 39.08 | 38.83 | 38.6 | 37 | |
| 18 | 19.3 | 18.89 | 18.65 | 17.0 | 17 | |
| 29 | 20.72 | 20.28 | 25.7 | 27 | ||
| 29.7 | 26.39 | 25.61 | 21.9 | 28 | ||
| 20 | 24.3 | 21.48 | 21.07 | 18.1 | 20 | |
| 10 | 10.8 | 10.85 | 10.83 | 11.0 | 10 | |
| 12 | 14.3 | 13.48 | 13.40 | 12.8 | 11 | |
| 21 | 23.2 | 18.77 | 18.41 | 17.1 | 19 | |
| 46 | 46 | 46.84 | 46.12 | 47.5 | 45 | |
| 38 | 36.9 | 38.78 | 38.03 | 34.6 | 37 | |
| 10 | 12.2 | 10.8 | 12.09 | 12.2 | 10 | |
| 19 | 31 | 24.43 | 24.47 | 23.1 | 19 | |
| 28 | 27.5 | 23.76 | 23.19 | 27.4 | 28 | |
| 14 | 13.6 | 10.9 | 10.95 | 11.3 | 15 | |
| 32 | 32.8 | 23.81 | 32.20 | 30 | 29 | |
| 19 | 19.7 | 18.91 | 18.61 | 17.1 | 15 | |
| 27 | 30.9 | 25.4 | 24.89 | 22.5 | 26 | |
| 21 | 22.9 | 16.95 | 16.66 | 16.6 | 21 | |
| 18 | 19.9 | 18.85 | 18.57 | 17.0 | 17 | |
| 21 | 25.3 | 24.62 | 24.24 | 22.9 | 22 | |
| 10 | 10.2 | 9.88 | 9.77 | 8.9 | 9 | |
| 9 | 9.2 | 9.59 | 9.42 | 8.1 | 8 | |
| 10 | 11.9 | 10.08 | 9.95 | 9.3 | 10 | |
| 10 | 9.2 | 9.4 | 9.27 | 8.5 | 9 | |
| 12 | 12.6 | 12.11 | 11.87 | 10.0 | 10 | |
| 32 | 42.1 | 35.49 | 34.61 | 27.9 | 30 | |
| 12.5 | 13.79 | 13.64 | 12.6 | |||
| 12 | 12.8 | 14.19 | 13.94 | 12.5 | 12 | |
| 16 | 16.8 | 14.12 | 13.85 | 12.6 | ||
| 24 | 24.8 | 21.7 | 21.29 | 19.6 | 29 | |
| 7 | 10.2 | 8.78 | 8.70 | 8.8 | 6 | |
| 32 | 29.4 | 36.05 | 35.12 | 29.7 | 28 | |
| 18 | 22.9 | 19.01 | 18.78 | 14.7 | 17 | |
| 35 | 36.7 | 35.64 | 35.09 | 31.8 | 32 | |
| 9 | 9 | 9.15 | 9.13 | 8.8 | 9 | |
| 17 | 18.6 | 14.85 | 14.54 | 12.8 | 17 | |
| 33 | 38.4 | 37.77 | 37.40 | 35.4 | 33 | |
| 9 | 9.5 | 7.91 | 8.10 | 8.9 | 9 | |
| 11 | 11.3 | 10.27 | 10.01 | 9.3 | 10 | |
| 9 | 10.7 | 8.66 | 8.54 | 8.7 | 9 | |
| 32 | 34.3 | 26.9 | 26.33 | 23.6 | 30 | |
| 42 | 42.3 | 41.45 | 40.87 | 38.7 | 44 | |
| 21 | 21 | 19.14 | 18.94 | 19.2 | 20 | |
| 35 | 36.8 | 38.5 | 37.68 | 38.8 | 29 | |
| 8 | 10.2 | 10.14 | 9.88 | 8.7 | 7 | |
| 16 | 17.4 | 16.64 | 16.24 | 14.2 | 13 | |
| 32 | 32.6 | 30.84 | 30.01 | 33.8 | 34 | |
| 19 | 18.7 | 17.1 | 16.73 | 14.9 | 17 | |
| 11 | 11.8 | 10.33 | 11.92 | 12.1 | 11 | |
| 10 | 10.2 | 10.45 | 10.48 | 10.5 | 10 | |
| 24 | 27.6 | 23.01 | 22.76 | 23.8 | 20 | |
| 8 | 8.5 | 8.61 | 8.55 | 8.0 | 7 | |
| 31 | 28.7 | 25.49 | 24.99 | 21.8 | 27 | |
| 37 | 39.8 | 37.25 | 36.82 | 34.6 | 36 | |
| 10 | 12.4 | 12.66 | 11.26 | 10.7 | 10 | |
| 29 | 39.2 | 34.85 | 34.48 | 32.0 | 25 | |
| 33 | 30.9 | 34.9 | 34.52 | 32.0 | 32 | |
| 24 | 26.5 | 24.12 | 23.55 | 21.0 | 23 | |
| 13 | 15.2 | 14.07 | 13.80 | 11.4 | 11 | |
| 18 | 18.6 | 17.12 | 16.90 | 15.9 | 16 | |
| 16 | 16.7 | 17.22 | 16.86 | 14.8 | 13 | |
| 24 | 21.7 | 19.53 | 19.46 | 18.3 | 22 | |
| 22.9 | 23.56 | 23.74 | 23.4 | 25 | ||
| 38 | 44.1 | 44.5 | 44.17 | 42.3 | 37 | |
| 9 | 11 | 9.52 | 9.41 | 9.6 | 7 | |
| 10 | 9.6 | 15.65 | 15.54 | 9.5 | 10 | |
| 11 | 12.9 | 12.26 | 12.22 | 11.9 | 10 | |
| 12 | 12.7 | 13.66 | 13.42 | 12.4 | 11 | |
| 14 | 14.1 | 13.28 | 13.18 | 12.9 | 10 | |
| 23 | 21.5 | 17.2 | 17.02 | 16.1 | 26 | |
| 30 | 31.1 | 26.35 | 25.69 | 22.4 | 29 | |
| 18 | 20.2 | 19.66 | 19.42 | 17.9 | 16 | |
| 17 | 16.6 | 16.56 | 16.26 | 14.5 | 15 | |
| 21.9 | 31.18 | 30.71 | 28.0 | 17 | ||
| 32 | 35.9 | 31.63 | 31.02 | 25.8 | 30 | |
| 38 | 43.6 | 42.79 | 42.46 | 40.4 | 34 | |
| 33 | 29.2 | 32.41 | 32.47 | 33.6 | 31 | |
| 11.1 | 12.82 | 12.68 | 12.2 | |||
| 11 | 10.6 | 12.72 | 12.65 | 12.1 | ||
| 10 | 11.9 | 11.39 | 11.35 | 11.2 | ||
| 10.1 | 10.78 | 10.83 | 11.1 | |||
| 15 | 14.5 | 12.17 | 12.13 | 11.9 | ||
| 10.1 | 9.95 | 9.89 | 9.8 | |||
| 11.3 | 11.39 | 11.65 | 12.7 | |||
| 16.8 | 14.93 | 14.70 | 13.3 | |||
| 11 | 13.6 | 13.4 | ||||
| 9 | 10.9 | |||||
| 14 | 11.9 | 13.36 | 13.57 | 14.9 | ||
| 14.9 | 14.19 | 14.15 | 13.8 | |||
| 15 | 14.5 | 14.57 | 14.53 | 14.1 | ||
| 13.6 | 11 | |||||
| 17 | 20.6 | 17.23 | 17.01 | 18.9 | 17 | |
| 26.1 | 27 | |||||
| 8 | 13.5 | 7.58 | 9.38 | 8.4 | ||
| 12.3 | 10.27 | 11.17 | 10.8 | |||
| 17 | 19.1 | 15.4 | 15 | |||
| 12 | 10.6 | 9.03 | 8.98 | 7.9 | ||
| 13 | 10 | |||||
| 23.2 | 34 | |||||
| 9.3 | 11.37 | 11.31 | 11.7 | |||
| 16 | 16.7 | 15.81 | 15.57 | 14.5 | 14 | |
| 14.8 | ||||||
| 20.7 | 19.6 | 18.94 | 15.1 | |||
| 12.3 | ||||||
| 16 | 17 | 15.7 | 15.47 | 14.0 | 13 | |
| 9 | 11.4 | 11.28 | 10.90 | 8.0 | 6 | |
| 17 | 16 | |||||
| 10.2 | 9.3 | |||||
| 8.5 | 10.19 | 10.03 | 9.4 | |||
| 16 | 16.6 | 14.3 | ||||
| 8.3 | 7.79 | 7.70 | 6.7 | |||
| 23.5 | 22.84 | 22.87 | 19.6 | |||
| 13 | 13 | 13.00 | 14.3 | |||
| 22.1 | ||||||
| 14.8 | 17.05 | 16.61 | 14.1 | |||
| 13 | 11.1 | 10.69 | 10.49 | 12.1 | ||
| 13.4 | 13.74 | 13.56 | 12.7 | |||
| 33.27 | 23.41 | 28.6 | ||||
| | 19 | 19.4 | 19.40 | 19.40 |
No data for Christmas Island (Australia), Cocos (Keeling) Islands (Australia), Norfolk Island (Australia), Svalbard (Norway) and Vatican City.
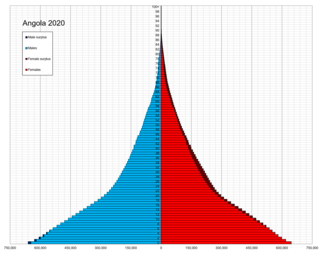
This article is about the demographic features of the population of Angola, including population density, ethnicity, education level, health of the populace, economic status, religious affiliations and other aspects of the population.

India is the second most populated country in the world with a sixth of the world's population. According to official estimates in 2021, India's population stood at 1.38 billion.
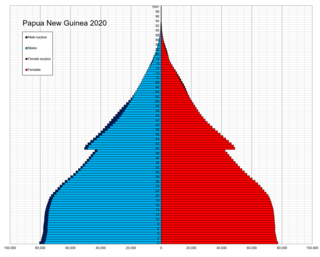
The indigenous population of Papua New Guinea is one of the most heterogeneous in the world. Papua New Guinea has several thousand separate communities, most with only a few hundred people. Divided by language, customs, and tradition, some of these communities have engaged in endemic warfare with their neighbors for centuries. It is the second most populous nation in Oceania, with a total population estimated variously as being between 9.5 and 10.1 million inhabitants.
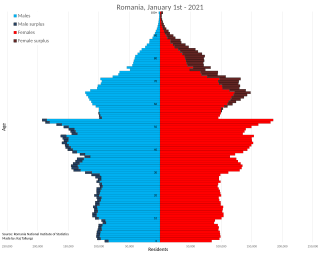
This article is about the demographic features of the population of Romania, including population density, ethnicity, education level, health of the populace, economic status, religious affiliations, and other aspects of the population.
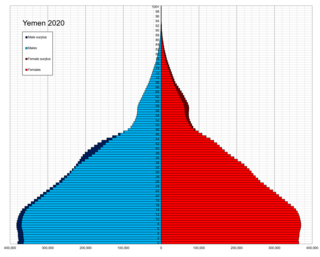
This article is about the demographic features of the population of Yemen, including population density, ethnicity, education level, health of the populace, economic status, religious affiliations and other aspects of the population.
Death rates in the 20th century is the ratio of deaths compared to the population around the world throughout the 20th century. When giving these ratios, they are most commonly expressed by number of deaths per 1,000 people per year. Many factors contribute to death rates such as cause of death, increasing the death rate, an ageing population, which could increase and decrease the death rates by birth rates, and improvements in public health, decreasing the death rate.

The population of Australia is estimated to be 26,063,200 as of 11 March 2023. Australia is the 55th most populous country in the world and the most populous Oceanian country. Its population is concentrated mainly in urban areas, particularly on the Eastern, South Eastern and Southern seaboards, and is expected to exceed 28 million by 2030.

Population density is a measurement of population per unit land area. It is mostly applied to humans, but sometimes to other living organisms too. It is a key geographical term. In simple terms, population density refers to the number of people living in an area per square kilometre, or other unit of land area.

Mortality rate, or death rate, is a measure of the number of deaths in a particular population, scaled to the size of that population, per unit of time. Mortality rate is typically expressed in units of deaths per 1,000 individuals per year; thus, a mortality rate of 9.5 in a population of 1,000 would mean 9.5 deaths per year in that entire population, or 0.95% out of the total. It is distinct from "morbidity", which is either the prevalence or incidence of a disease, and also from the incidence rate.

The birth rate for a given period is the total number of live human births per 1,000 population divided by the length of the period in years. The number of live births is normally taken from a universal registration system for births; population counts from a census, and estimation through specialized demographic techniques. The birth rate is used to calculate population growth. The estimated average population may be taken as the mid-year population.

This article is about the demographic features of the population of the area which is commonly described as Palestinian territories and includes information on ethnicity, education level, health of the populace, economic status, religious affiliations and other aspects of that population.
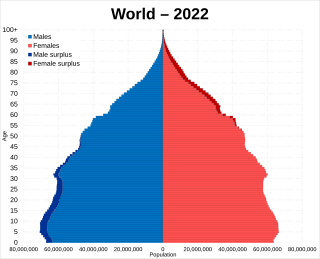
Earth has a human population of over 8 billion as of 2023, with an overall population density of 50 people per km2, excluding Antarctica. Nearly 60% of the world's population lives in Asia, with almost 2.8 billion in the countries of China and India combined. The percentage shares of India, China and rest of South Asia of the world population have remained at similar levels for the last few thousand years of recorded history. The world's literacy rate has increased dramatically in the last 40 years, from 66.7% in 1979 to 86.3% today. Lower literacy levels are mostly attributable to poverty. Lower literacy rates are found mostly in South Asia and Sub-Saharan Africa. The world's largest nationality group is Chinese, with Mandarin being the world's most spoken language in terms of native speakers.