This article relies largely or entirely on a single source .(May 2015) |
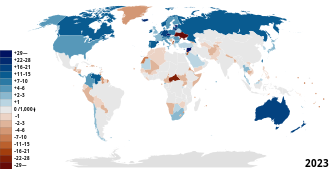
This is a list of countries by net migration rate , the difference between the number of persons entering and leaving a country during the year, per 1,000 persons (based on midyear population).
An excess of persons entering the country is referred to as net immigration (e.g., 3.56 migrants/1,000 population); an excess of persons leaving the country as net emigration (e.g., -9.26 migrants/1,000 population). The net migration rate indicates the contribution of migration to the overall level of population change. The net migration rate does not distinguish between economic migrants, refugees, and other types of migrants; nor does it distinguish between lawful migrants and unlawful migrants. [1]
Country | Annual net migration per 1000 inhabitants 2010–2015 | Annual net migration per 1000 inhabitants 2015–2020 (forecast) |
---|---|---|
Qatar | 54.7 | 14.7 |
Oman | 48.5 | 18.6 |
Lebanon | 41.5 | −4.5 |
Kuwait | 34.0 | 9.8 |
Maldives | 28.4 | 22.8 |
Jordan | 25.6 | 1.0 |
Luxembourg | 18.1 | 16.3 |
Equatorial Guinea | 17.0 | 12.4 |
Macau | 14.9 | 8.0 |
Singapore | 11.8 | 4.7 |
Saudi Arabia | 11.7 | 4.1 |
Gabon | 11.2 | 1.6 |
Switzerland | 9.9 | 6.1 |
Curaçao | 8.8 | 3.2 |
Norway | 8.8 | 5.3 |
Australia | 8.6 | 6.4 |
Iraq | 8.0 | 0.2 |
Malta | 7.3 | 2.1 |
Canada | 7.1 | 6.6 |
Bahrain | 6.4 | 31.1 |
Austria | 6.3 | 7.4 |
United Arab Emirates | 6.1 | 4.2 |
Italy | 5.5 | 2.5 |
Sweden | 5.3 | 4.0 |
Germany | 4.8 | 6.6 |
Turkey | 4.7 | 3.5 |
Belgium | 4.7 | 4.2 |
Belize | 4.4 | 3.2 |
Guernsey and Jersey | 4.4 | 8.0 |
Cyprus | 4.0 | 4.2 |
New Zealand | 4.0 | 3.2 |
United Kingdom | 4.0 | 3.9 |
Denmark | 3.8 | 2.6 |
South Africa | 3.5 | 2.5 |
Afghanistan | 3.3 | −1.7 |
United States | 3.2 | 2.9 |
Finland | 3.0 | 2.5 |
Bahamas | 2.7 | 2.6 |
Russia | 2.5 | 1.3 |
Aruba | 2.4 | 1.9 |
New Caledonia | 2.3 | 1.8 |
Hong Kong | 2.1 | 4.0 |
Antigua and Barbuda | 2.1 | 0.0 |
Kazakhstan | 1.9 | −1.0 |
Chile | 1.9 | 6.0 |
Malaysia | 1.7 | 1.6 |
South Korea | 1.6 | 0.2 |
Slovenia | 1.6 | 1.0 |
Chad | 1.5 | 0.1 |
Taiwan | 1.5 | 1.3 |
Panama | 1.5 | 2.7 |
Belarus | 1.5 | 1.9 |
Djibouti | 1.4 | 0.9 |
Vanuatu | 1.4 | 0.4 |
Angola | 1.4 | 0.2 |
Mauritania | 1.3 | 1.2 |
France | 1.3 | 0.6 |
Liberia | 1.2 | −1.0 |
Western Sahara | 1.1 | 9.9 |
Czech Republic | 1.1 | 2.1 |
Ethiopia | 0.8 | 0.3 |
Costa Rica | 0.8 | 0.8 |
Serbia | 0.7 | 0.5 |
Netherlands | 0.7 | 0.9 |
Japan | 0.6 | 0.6 |
Ukraine | 0.6 | 0.2 |
Israel | 0.5 | 1.2 |
Thailand | 0.5 | 0.3 |
Slovakia | 0.4 | 0.3 |
Niger | 0.2 | 0.2 |
Azerbaijan | 0.2 | 0.1 |
Bhutan | 0.1 | 0.4 |
Argentina | 0.1 | 0.1 |
DR Congo | 0.0 | 0.3 |
Saint Lucia | 0.0 | 0.0 |
Brazil | 0.0 | 0.1 |
Madagascar | −0.1 | −0.1 |
Papua New Guinea | −0.1 | −0.1 |
Kenya | −0.2 | −0.2 |
China | −0.2 | −0.2 |
North Korea | −0.2 | −0.2 |
Cameroon | −0.3 | −0.2 |
Mongolia | −0.3 | −0.3 |
Barbados | −0.3 | −0.3 |
Moldova | −0.3 | −0.3 |
Ghana | −0.4 | −0.3 |
Nigeria | −0.4 | −0.3 |
Uzbekistan | −0.4 | −0.3 |
India | −0.4 | −0.3 |
Brunei | −0.4 | 0.0 |
Indonesia | −0.4 | −0.3 |
Ecuador | −0.5 | 2.2 |
Sierra Leone | −0.6 | −0.6 |
Egypt | −0.6 | −0.4 |
Yemen | −0.6 | −1.1 |
Trinidad and Tobago | −0.6 | −0.6 |
Guatemala | −0.6 | −0.5 |
Zambia | −0.7 | −0.5 |
Ivory Coast | −0.7 | −0.5 |
Honduras | −0.7 | −0.7 |
Mexico | −0.7 | −0.5 |
Algeria | −0.8 | −0.2 |
Colombia | −0.8 | 4.2 |
Benin | −0.9 | −0.2 |
Guinea-Bissau | −0.9 | −0.8 |
Vietnam | −0.9 | −0.8 |
French Guiana | −0.9 | 4.3 |
North Macedonia | −0.9 | −0.5 |
Malawi | −1.0 | −0.9 |
Tanzania | −1.0 | −0.7 |
Montenegro | −1.0 | −0.8 |
Pakistan | −1.1 | −1.1 |
Bolivia | −1.1 | −0.8 |
Mayotte | −1.3 | 0.0 |
Iran | −1.3 | −0.7 |
Iceland | −1.3 | 1.1 |
Cuba | −1.4 | −1.3 |
Burundi | −1.5 | 0.2 |
Burkina Faso | −1.5 | −1.3 |
Gambia | −1.6 | −1.4 |
Estonia | −1.6 | 3.0 |
Uganda | −1.7 | 4.0 |
Philippines | −1.7 | −0.6 |
Poland | −1.7 | −0.8 |
Suriname | −1.8 | −1.7 |
Uruguay | −1.8 | −0.9 |
Croatia | −1.8 | −1.9 |
Mauritius | −1.9 | 0.0 |
Turkmenistan | −1.9 | −0.9 |
Grenada | −1.9 | −1.8 |
Rwanda | −2.0 | −0.7 |
South Sudan | −2.0 | −15.9 |
Cambodia | −2.0 | −1.9 |
Myanmar | −2.0 | −3.0 |
Seychelles | −2.1 | −2.1 |
Armenia | −2.1 | −1.7 |
Morocco | −2.2 | −1.4 |
Spain | −2.2 | 0.9 |
Congo | −2.6 | −0.8 |
Comoros | −2.7 | −2.4 |
Paraguay | −2.7 | −2.4 |
Portugal | −2.7 | −0.6 |
Tunisia | −2.8 | −0.3 |
Solomon Islands | −2.8 | −2.5 |
Sudan | −2.9 | −1.2 |
Haiti | −2.9 | −3.2 |
Venezuela | −2.9 | −22.3 |
Bangladesh | −3.0 | −2.3 |
Romania | −3.0 | −3.8 |
Greece | −3.0 | −1.5 |
Senegal | −3.1 | −1.3 |
Dominican Republic | −3.1 | −2.8 |
Cape Verde | −3.2 | −2.5 |
Réunion | −3.3 | −1.4 |
Namibia | −3.3 | −2.0 |
Kyrgyzstan | −3.3 | −0.6 |
Tajikistan | −3.4 | −2.2 |
Laos | −3.5 | −2.1 |
Somalia | −3.6 | −2.7 |
Mali | −3.7 | −2.1 |
Jamaica | −4.0 | −3.9 |
Peru | −4.2 | 3.1 |
Nicaragua | −4.5 | −3.3 |
Lesotho | −4.7 | −4.8 |
Georgia | −4.7 | −2.5 |
Sri Lanka | −4.7 | −4.6 |
East Timor | −4.9 | −4.3 |
Ireland | −4.9 | 4.9 |
Guinea | −5.4 | −0.3 |
Saint Vincent and the Grenadines | −5.4 | −1.8 |
Micronesia | −5.7 | −5.4 |
French Polynesia | −5.9 | −3.6 |
Botswana | −7.1 | 1.3 |
Palestine | −7.3 | −2.2 |
Eswatini | −7.7 | −7.4 |
El Salvador | −7.7 | −6.3 |
Kiribati | −7.7 | −6.9 |
Guadeloupe | −7.9 | −3.6 |
Latvia | −8.1 | −7.6 |
U.S. Virgin Islands | −8.5 | −4.3 |
São Tomé and Príncipe | −8.8 | −8.0 |
Guyana | −9.2 | −7.7 |
Zimbabwe | −9.4 | −8.2 |
Albania | −9.4 | −4.9 |
Libya | −9.5 | −0.3 |
Guam | −9.5 | −3.1 |
Lithuania | −9.7 | −11.6 |
Martinique | −11.7 | −2.5 |
Fiji | −12.0 | −7.0 |
Samoa | −12.8 | −14.3 |
Puerto Rico | −13.9 | −31.4 |
Bosnia and Herzegovina | −14.5 | −6.4 |
Eritrea | −15.1 | −11.6 |
Nepal | −15.1 | 1.5 |
Central African Republic | −17.8 | −8.6 |
Tonga | −25.4 | −7.7 |
Syria | −54.7 | −24.1 |
Country | Total population [3] | Total net migration 5 year period (2007–2012) [4] | Net migration per 1,000 inhabitants 5 year period (2007–2012) |
---|---|---|---|
Afghanistan | 29,726,803 | 473,007 | 15.91 |
Albania | 2,900,247 | −91,750 | −31.64 |
Algeria | 37,439,427 | −143,268 | −3.83 |
American Samoa | 55,227 | – | – |
Andorra | 77,281 | 30,000 | 0.71 |
Angola | 25,789,024 | 102,322 | 4.51 |
Antigua and Barbuda | 89,069 | −56 | −0.63 |
Argentina | 43,847,430 | 30,000 | 0.68 |
Armenia | 2,978,339 | −9,876 | −3.32 |
Aruba (Netherlands) | 102,393 | 1,253 | 12.24 |
Australia | 22,728,254 | 1,023,107 | 45.01 |
Austria | 8,429,991 | 147,089 | 17.45 |
Azerbaijan | 9,295,784 | −16,125 | −1.73 |
Bahamas | 372,388 | 9,672 | 25.97 |
Bahrain | 1,333,577 | 29,915 | 22.43 |
Bangladesh | 155,257,387 | −2,226,481 | −14.34 |
Barbados | 281,580 | 2,180 | 7.74 |
Belarus | 9,464,000 | 120,535 | 12.74 |
Belgium | 11,128,246 | 269,998 | 24.26 |
Belize | 336,707 | 7,594 | 22.55 |
Benin | 10,049,792 | −10,000 | −1.00 |
Bermuda (UK) | 64,798 | – | – |
Bhutan | 743,711 | 10,000 | 13.45 |
Bolivia | 10,238,762 | −61,794 | −6.04 |
Bosnia and Herzegovina | 3,828,419 | −2,506 | −0.65 |
Botswana | 2,132,822 | 20,000 | 9.38 |
Brazil | 202,401,584 | 15,924 | 0.08 |
British Virgin Islands | 28,511 | – | – |
Brunei | 405,512 | 2,102 | 5.18 |
Bulgaria | 7,305,888 | −50,000 | −6.84 |
Burkina Faso | 16,590,813 | −125,000 | −7.53 |
Burundi | 10,124,572 | 40,000 | 3.95 |
Cambodia | 14,832,255 | −149,999 | −10.11 |
Cameroon | 21,659,488 | −60,000 | −2.77 |
Canada | 34,751,476 | 1,175,863 | 33.84 |
Cape Verde | 500,870 | −11,052 | −22.07 |
Cayman Islands (UK) | 57,522 | – | – |
Central African Republic | 4,619,500 | 10,000 | 2.16 |
Chad | 12,715,465 | 100,000 | 7.86 |
Chile | 17,388,437 | 80,820 | 4.64 |
China | 1,420,062,022 | −1,800,000 | −1.33 |
Colombia | 46,881,018 | −144,998 | −3.09 |
Comoros | 733,661 | −10,000 | −13.63 |
Congo, Democratic Republic of the | 70,291,160 | −95,920 | −1.36 |
Congo, Republic of the | 4,286,188 | −60,000 | −14.00 |
Costa Rica | 4,654,148 | 19,658 | 4.22 |
Côte d'Ivoire | 21,102,641 | 50,000 | 2.37 |
Croatia | 4,267,558 | −20,000 | −4.69 |
Cuba | 11,342,631 | −79,999 | −7.05 |
Curaçao (Netherlands) | 152,088 | 5,710 | 37.54 |
Cyprus | 1,129,303 | 35,000 | 30.99 |
Czech Republic | 10,510,785 | 29,999 | 2.85 |
Denmark | 5,591,572 | 96,839 | 17.32 |
Djibouti | 853,069 | −15,996 | −18.75 |
Dominica | 71,685 | −390 | −5.44 |
Dominican Republic | 10,155,036 | −153,010 | −15.07 |
Ecuador | 15,419,493 | −38,001 | −2.46 |
Egypt | 85,660,902 | −215,681 | −2.52 |
El Salvador | 6,072,233 | −240,415 | −39.59 |
Equatorial Guinea | 773,729 | 20,000 | 25.85 |
Eritrea | 4,954,645 | -160,001 | −32.29 |
Estonia | 1,322,696 | −11,850 | −8.96 |
Eswatini | 1,231,694 | −6,000 | −4.87 |
Ethiopia | 92,191,211 | −60,001 | −0.65 |
Faroe Islands (Denmark) | 48,393 | – | – |
Fiji | 874,158 | −28,720 | −32.85 |
Finland | 5,413,971 | 107,409 | 19.84 |
France | 65,659,790 | 331,555 | 5.05 |
French Polynesia | 273,775 | −500 | −1.83 |
Gabon | 1,613,489 | 5,000 | 3.10 |
Gambia | 1,807,108 | −13,476 | −7.46 |
Georgia | 3,825,000 | −296,323 | −77.47 |
Germany | 80,425,823 | 1,249,998 | 15.54 |
Ghana | 25,544,565 | −49,999 | −1.96 |
Gibraltar (UK) | 31,402 | – | – |
Greece | 11,045,011 | −136,299 | −12.34 |
Greenland (Denmark) | 56,810 | – | – |
Grenada | 105,476 | −4,274 | −40.52 |
Guam | 162,807 | 0 | 0.00 |
Guatemala | 15,368,759 | −120,001 | −7.81 |
Guinea-Bissau | 1,714,620 | −10,000 | −5.83 |
Guyana | 758,410 | −27,278 | −35.97 |
Haiti | 10,288,828 | −150,000 | −14.58 |
Honduras | 7,736,131 | −80,000 | −10.34 |
Hong Kong (China) | 7,154,600 | 150,000 | 20.97 |
Hungary | 9,920,362 | 29,999 | 3.02 |
Iceland | 320,716 | −378 | −1.18 |
India | 1,370,589,639 | −2,598,218 | −2.06 |
Indonesia | 248,037,853 | −700,000 | −2.82 |
Iran | 76,156,975 | −300,001 | −3.94 |
Iraq | 32,957,622 | 548,666 | 16.65 |
Ireland | 4,586,897 | −140,001 | −30.52 |
Isle of Man | 85,779 | – | – |
Israel | 7,910,500 | 19,497 | 2.46 |
Italy | 59,539,717 | 528,269 | 8.87 |
Jamaica | 2,707,805 | −97,000 | −35.82 |
Japan | 127,561,489 | 350,000 | 2.74 |
Jordan | 6,994,451 | 229,617 | 32.83 |
Kazakhstan | 16,791,425 | 159,807 | 9.52 |
Kenya | 42,542,978 | −50,000 | −1.18 |
Kiribati | 106,620 | −2,130 | −19.98 |
Korea, North | 24,763,353 | −1,486 | −0.06 |
Korea, South | 50,004,441 | 300,000 | 6.00 |
Kosovo | 1,805,200 | – | – |
Kuwait | 3,419,581 | 517,500 | 151.33 |
Kyrgyzstan | 5,607,200 | −113,963 | −20.32 |
Laos | 6,473,050 | −117,700 | −18.18 |
Latvia | 2,034,319 | −73,442 | −36.10 |
Lebanon | 4,924,257 | 1,250,000 | 253.85 |
Lesotho | 2,057,331 | −19,998 | −9.72 |
Liberia | 4,190,155 | −20,000 | −4.77 |
Libya | 6,283,403 | −501,692 | −79.84 |
Liechtenstein | 36,791 | 165 | 4.49 |
Lithuania | 2,987,773 | −169,529 | −56.74 |
Luxembourg | 530,946 | 48,704 | 91.73 |
Macau | 557,763 | 35,000 | 62.75 |
Madagascar | 22,293,720 | −5,000 | −0.22 |
Malawi | 15,700,436 | −30,000 | −1.91 |
Malaysia | 29,021,940 | 450,000 | 15.51 |
Maldives | 385,000 | −53 | −0.14 |
Mali | 16,112,333 | −302,449 | −18.77 |
Malta | 419,455 | 6,252 | 14.91 |
Marshall Islands | 52,663 | 279 | −5.30 |
Mauritania | 3,777,067 | −20,000 | −5.30 |
Mauritius | 1,255,882 | 0 | 0.00 |
Mexico | 122,070,963 | −523,585 | −4.29 |
Micronesia | 103,516 | −8,192 | −79.14 |
Moldova | 3,559,519 | −9,529 | −2.68 |
Monaco | 37,404 | 116 | 3.09 |
Mongolia | 2,808,339 | −15,001 | −5.34 |
Montenegro | 620,601 | −2,412 | −3.89 |
Morocco | 32,984,190 | −310,624 | −9.42 |
Mozambique | 25,732,928 | −25,000 | −0.97 |
Myanmar | 52,543,841 | −474,278 | −9.03 |
Namibia | 2,291,645 | −1,371 | −0.60 |
Nauru | 10,079 | −154 | −15.29 |
Nepal | 27,500,515 | −372,369 | −13.54 |
Netherlands | 16,754,962 | 110,006 | 6.57 |
New Caledonia (France) | 259,000 | 5,660 | 21.85 |
New Zealand | 4,408,100 | 90,895 | 20.62 |
Nicaragua | 5,877,034 | −135,000 | −22.97 |
Niger | 17,635,782 | −28,497 | −1.62 |
Nigeria | 168,240,403 | −300,000 | −1.78 |
North Macedonia | 2,069,270 | −4,999 | −2.42 |
Northern Mariana Islands (US) | 53,314 | – | – |
Norway | 5,018,573 | 235,665 | 46.96 |
Oman | 3,545,192 | 1,211,000 | 341.59 |
Pakistan | 177,392,252 | −1,081,918 | −6.10 |
Palau | 20,756 | 17 | 0.82 |
Panama | 3,743,761 | 28,105 | 7.51 |
Papua New Guinea | 11,628,767 | −10,000 | −0.86 |
Paraguay | 6,379,162 | −86,700 | −13.59 |
Peru | 30,158,768 | −240,000 | −7.96 |
Philippines | 96,017,322 | −700,000 | −7.29 |
Poland | 38,063,164 | −73,809 | −1.94 |
Portugal | 10,514,844 | −140,000 | −13.31 |
Puerto Rico (US) | 3,634,487 | −103,537 | −28.49 |
Qatar | 2,015,624 | 363,500 | 180.34 |
Romania | 20,058,035 | −437,201 | −21.80 |
Russia | 143,201,676 | 1,117,884 | 7.81 |
Rwanda | 10,817,350 | −75,001 | −6.93 |
Saint Kitts and Nevis | 53,650 | 3 | 0.06 |
Saint Lucia | 180,890 | 40 | 0.22 |
Saint Martin (France) | 30,959 | – | – |
Saint Vincent and the Grenadines | 109,334 | −5,000 | −45.73 |
Samoa | 188,901 | −12,690 | −67.18 |
San Marino | 31,172 | 303 | 9.73 |
São Tomé and Príncipe | 178,484 | −5,599 | −31.37 |
Saudi Arabia | 29,496,047 | 850,000 | 28.82 |
Senegal | 13,780,108 | −99,996 | −7.26 |
Serbia | 7,199,077 | −99,999 | −13.89 |
Seychelles | 88,303 | −1,551 | −17.56 |
Sierra Leone | 6,043,157 | −21,000 | −3.48 |
Singapore | 5,312,437 | 397,936 | 74.91 |
Sint Maarten (Netherlands) | 34,640 | – | – |
Slovakia | 5,407,579 | 1,199 | 0.22 |
Slovenia | 2,057,159 | 4,324 | 2.10 |
Solomon Islands | 549,162 | −11,868 | −21.61 |
Somalia | 10,033,630 | −400,000 | −39.87 |
South Africa | 52,356,381 | 600,000 | 11.46 |
South Sudan | 10,980,623 | 865,000 | 78.78 |
Spain | 46,773,055 | −593,069 | −12.68 |
Sri Lanka | 20,424,000 | −484,772 | −23.74 |
Sudan | 37,712,420 | −800,000 | −21.21 |
Suriname | 528,535 | −5,000 | −9.46 |
Sweden | 9,519,374 | 272,626 | 28.64 |
Switzerland | 7,996,861 | 382,267 | 47.80 |
Syria | 19,978,756 | −4,029,996 | −201.71 |
Tajikistan | 7,930,929 | −117,382 | −14.80 |
Tanzania | 48,645,709 | −199,999 | −4.11 |
Thailand | 67,164,130 | 100,000 | 1.49 |
Timor-Leste | 1,148,958 | −50,004 | −43.52 |
Togo | 6,745,581 | −9,994 | −1.48 |
Tonga | 104,769 | −8,078 | −77.10 |
Trinidad and Tobago | 1,341,579 | −5,000 | −3.73 |
Tunisia | 10,777,500 | −32,941 | −3.06 |
Turkey | 74,849,187 | 2,000,003 | 26.72 |
Turkmenistan | 5,172,941 | −25,001 | −4.83 |
Turks and Caicos Islands (UK) | 32,430 | – | – |
Tuvalu | 9,860 | −69 | −7.00 |
Uganda | 35,400,620 | −150,000 | −4.24 |
Ukraine | 45,593,300 | 195,000 | 4.28 |
United Arab Emirates | 8,952,542 | 405,000 | 45.24 |
United Kingdom | 63,700,300 | 900,000 | 14.13 |
United States | 314,102,623 | 5,007,887 | 15.94 |
U.S. Virgin Islands | 105,275 | −3,604 | −34.23 |
Uruguay | 3,396,753 | −30,000 | −8.83 |
Uzbekistan | 29,774,500 | −195,001 | −6.55 |
Vanuatu | 247,498 | 603 | 2.44 |
Venezuela | 29,854,238 | −69,121 | −2.32 |
Vietnam | 88,809,200 | −200,002 | −2.25 |
West Bank and Gaza Strip | 4,046,901 | −43,750 | −10.81 |
Yemen | 24,882,792 | −50,000 | −2.01 |
Zambia | 14,786,581 | −34,490 | −2.33 |
Zimbabwe | 14,565,482 | −219,922 | −15.10 |
Region | Total population [3] | Total net migration [4] | Net migration per 1000 inhabitants |
---|---|---|---|
Arab World | 368,802,611 | −1,168,750 | −3.17 |
Central Europe and the Baltics | 103,935,318 | −770,310 | −7.41 |
Channel Islands | 161,336 | 3,654 | 22.65 |
Caribbean small states | 6,937,108 | −124,122 | −17.89 |
East Asia & Pacific (excluding high income) | 1,991,783,241 | −3,728,059 | −1.87 |
Early-demographic dividend | 2,991,724,468 | −12,621,653 | −4.22 |
East Asia & Pacific | 2,233,936,812 | −1,457,489 | −0.65 |
Europe & Central Asia (excluding high income) | 403,830,537 | 2,121,162 | 5.25 |
Europe & Central Asia | 895,050,287 | 5,547,385 | 6.20 |
Euro area | 336,161,537 | 1,575,613 | 4.69 |
Fragile and conflict affected situations | 452,946,224 | −4,018,991 | −8.87 |
European Union | 505,098,575 | 2,324,066 | 4.60 |
High income | 1,166,574,800 | 15,359,563 | 13.17 |
Heavily indebted poor countries (HIPC) | 664,163,813 | −2,672,487 | −4.02 |
IBRD only | 4,392,620,014 | −3,001,551 | −0.68 |
IDA & IBRD total | 5,947,367,231 | −15,156,043 | −2.55 |
IDA total | 1,554,747,217 | −12,154,492 | −7.82 |
IDA blend | 551,030,216 | −2,758,229 | −5.01 |
IDA only | 1,003,717,001 | −9,396,263 | −9.36 |
Latin America & Caribbean (excluding high income) | 585,536,615 | −2,159,855 | −3.69 |
Latin America & Caribbean | 612,638,376 | −2,081,948 | −3.40 |
Least developed countries: UN classification | 888,606,627 | −4,741,314 | −5.34 |
Low income | 588,316,015 | −1,115,618 | −1.90 |
Lower middle income | 2,801,879,869 | −15,784,815 | −5.63 |
Low & middle income | 5,922,876,751 | −15,350,665 | −2.59 |
Late-demographic dividend | 2,208,629,633 | 1,194,303 | 0.54 |
Middle East & North Africa | 401,032,763 | −213,002 | −0.53 |
Middle income | 5,334,560,736 | −14,235,047 | −2.67 |
Middle East & North Africa (excluding high income) | 343,940,245 | −3,615,666 | −10.51 |
North America | 348,918,897 | 6,183,750 | 17.72 |
OECD members | 1,258,042,183 | 13,138,424 | 10.44 |
Other small states | 27,109,032 | 332,029 | 12.25 |
Pre-demographic dividend | 779,862,983 | −891,831 | −1.14 |
Pacific island small states | 2,267,982 | −71,075 | −31.34 |
Post-demographic dividend | 1,082,692,198 | 12,324,314 | 11.38 |
South Asia | 1,675,019,307 | −6,280,804 | −3.75 |
Sub-Saharan Africa (excluding high income) | 922,766,806 | −1,687,443 | −1.83 |
Sub-Saharan Africa | 922,855,109 | −1,688,994 | −1.83 |
Small states | 36,314,122 | 136,832 | 3.77 |
East Asia & Pacific (IDA & IBRD countries) | 1,966,974,740 | −3,728,059 | −1.90 |
Europe & Central Asia (IDA & IBRD countries) | 446,161,259 | 2,027,353 | 4.54 |
Latin America & the Caribbean (IDA & IBRD countries) | 596,463,472 | −1,913,623 | −3.21 |
Middle East & North Africa (IDA & IBRD countries) | 339,893,344 | −3,571,916 | −10.51 |
South Asia (IDA & IBRD countries) | 1,675,019,307 | −6,280,804 | −3.75 |
Sub-Saharan Africa (IDA & IBRD countries) | 922,855,109 | −1,688,994 | −1.83 |
Upper middle income | 2,532,680,867 | 1,549,768 | 0.61 |
2022 estimates. [5]
This article is about the demographic features of the population of Angola, including population density, ethnicity, education level, health of the populace, economic status, religious affiliations and other aspects of the population.
This article is about the demographic features of the population of Burundi, including population density, ethnicity, education level, health of the populace, economic status, religious affiliations and other aspects of the population.
The demographic profile of Cameroon is complex for a country of its population. Cameroon comprises an estimated 250 distinct ethnic groups, which may be formed into five large regional-cultural divisions:
This is a demography of the population of Costa Rica including population density, ethnicity, education level, health of the populace, economic status, religious affiliations and other aspects of the population.
This article is about the demographic features of the population of the Democratic Republic of the Congo, including ethnicity, education level, health, economic status, religious affiliations and other aspects of the population.
Egypt is the most populous country in North Africa and the fourth-most populous on the African continent, after Nigeria, Ethiopia and Democratic Republic of the Congo. About 95% of the country's 102 million people live along the banks of the Nile and in the Nile Delta, which fans out north of Cairo; and along the Suez Canal. These regions are among the world's most densely populated, containing an average of over 1,540 per km2, as compared to 96 persons per km2 for the country as a whole.
This article is about the demographic features of the population of Equatorial Guinea, including population density, ethnicity, education level, health of the populace, economic status, religious affiliations and other aspects of the population.
Sources disagree as to the current population of Eritrea, with some proposing numbers as low as 3.6 million and others as high as 6.7 million. Eritrea has never conducted an official government census.
This is a demography of the population of Guatemala including population density, ethnicity, education level, health of the populace, economic status, religious affiliations and other aspects of the population.
This article is about the demographic features of the population of Malawi, including population density, ethnicity, education level, health of the populace, economic status, religious affiliations and other aspects of the population.
This article is about the demographic features of the population of Mali, including population density, ethnicity, education level, health of the populace, economic status, religious affiliations and other aspects of the population.
The demographics of North Korea are determined through national censuses and international estimates. The Central Bureau of Statistics of North Korea conducted the most recent census in 2008, where the population reached 24 million inhabitants. The population density is 199.54 inhabitants per square kilometre, and the 2014 estimated life expectancy is 69.81 years. In 1980, the population rose at a near consistent, but low, rate. Since 2000, North Korea's birth rate has exceeded its death rate; the natural growth is positive. In terms of age structure, the population is dominated by the 15–64-year-old segment (68.09%). The median age of the population is 32.9 years, and the gender ratio is 0.95 males to 1.00 female. Since the early 1990s, the birth rate has been fairly stable, with an average of 2 children per woman, down from an average of 3 in the early 1980s.
This is a demography of the population of Namibia including population density, ethnicity, education level, health of the populace, economic status, religious affiliations and other aspects of the population.
This article is about the demographic features of the population of Niger, including population density, ethnicity, education level, health of the populace, economic status, religious affiliations and other aspects of the population.
Saudi Arabia is the fourth largest state in the Arab world, with a reported population of 35,013,414 as of 2018. 38.3% of inhabitants are immigrants. Saudi Arabia has experienced a population explosion in the last 40 years, and continues to grow at a rate of 1.62% per year.
The demographics of Sudan include the Sudanese people and their characteristics, Sudan, including population density, ethnicity, education level, health, economic status, religious affiliations, and other aspects of the population.
The demographics of Uzbekistan are the demographic features of the population of Uzbekistan, including population growth, population density, ethnicity, education level, health, economic status, religious affiliations, and other aspects of the population. The nationality of any person from Uzbekistan is Uzbekistani, while the ethnic Uzbek majority call themselves Uzbeks. Much of the data is estimated because the last census was carried out in Soviet times in 1989.
This article is about the demographic features of the population of Belgium, including ethnicity, education level, health of the populace, economic status, religious affiliations and other aspects of the population. All figures are from the National Institute for Statistics unless otherwise indicated.
The population of Australia is estimated to be 26,003,200 as of 22 November 2022. Australia is the 55th most populous country in the world and the most populous Oceanian country. Its population is concentrated mainly in urban areas, particularly on the Eastern, South Eastern and Southern seaboards, and is expected to exceed 28 million by 2030.
Human migration is the movement of people from one place to another with intentions of settling, permanently or temporarily, at a new location. The movement often occurs over long distances and from one country to another, but internal migration is also possible; indeed, this is the dominant form of human migration globally. Migration is often associated with better human capital at both individual and household level, and with better access to migration networks, facilitating a possible second move. Age is also important for both work and non-work migration. People may migrate as individuals, in family units or in large groups. There are four major forms of migration: invasion, conquest, colonization and emigration/immigration.
This article incorporates public domain material from World Factbook. CIA.