Croydon Central | |
---|---|
Former borough constituency for the House of Commons | |
![]() Boundary of Croydon Central in Greater Londonfor the 2019 general election | |
County | Greater London |
Electorate | 76,980 (December 2010) [1] |
1974–2024 | |
Seats | One |
Created from | Croydon South |
Replaced by | Croydon East, Croydon West |
Croydon Central was a constituency created in 1974 and represented in the House of Commons of the UK Parliament from 2017 until its abolition for the 2024 general election by Labour MP Sarah Jones. [n 1] [n 2] The seat bucked the trend in national results in 2019, with Labour holding the seat with a slightly increased majority.
Under the 2023 Periodic Review of Westminster constituencies, the majority of the constituency was incorporated into the re-established seat of Croydon East. Croydon town centre was included in the re-established seat of Croydon West. [2]
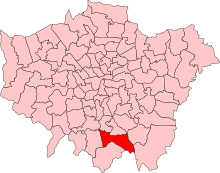
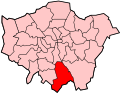
Croydon Central covered a wedge of the London Borough of Croydon to the east of central Croydon and was much more marginal than the other selected two parliamentary divisions constrained to the borough itself; Croydon South (which was safely Conservative) and Croydon North (which was safely Labour).
The northern parts were characterised by terraced houses and urban areas, with small council estates. Labour gained much support from, in particular, Addiscombe, Fieldway, Woodside and Ashburton. The southern area, largely Conservative, consisted of suburban semi-detached houses, populated by commuters, surrounded by golf courses and parkland. The wards of Shirley, Heathfield and Fairfield gave large Conservative votes.
In the south-east corner was a large former council estate, New Addington; home to more than 10,000 people. The estate is largely White and has included the whole or vast bulk of one or two wards of the United Kingdom in its history.
The New Addington wards saw one of the highest turnouts of British National Party supporters during the 2002 and 2006 council elections, which the BNP described as their "heyday decade," however it never elected a local councillor from the party – its slate of councillors has been consistently from the Labour Party. Except on one occasion in 2010, where a Conservative councillor was elected for the first time since 1968. Historically, Labour's strength in the area had been on the council estates, particularly New Addington, but in 2014, Labour support was reduced by UKIP, gauging 24% of the overall vote.
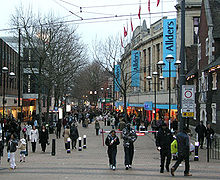
The two major-stop railway stations on the national network, [n 3] most office buildings, businesses and shopping centres of Croydon were within the constituency. A wide range of flats formed a major part of the housing sector unlike neighbouring seats, from upmarket expensively-built apartments with dedicated gym and restaurant facilities to ex-local authority brutalist architecture tower blocks, most of which had been replaced by the 2010s.
The constituency that preceded Croydon Central, Croydon South (1918–1950) and (1955–1974) had the modern borough area's two periods of brief Labour Party parliamentary representation — David Rees-Williams held the forerunner from the 1945 Labour landslide until unfavourable boundary changes in 1950. David Winnick was MP 1966–1970. [n 4] Otherwise, the area at parliamentary level has elected, since 1918, Conservative MPs.
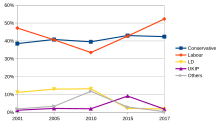
In 1997, Croydon's seats were reduced from four to three and the displaced Conservative members had to face one another for the right to stand in the new Croydon Central seat (Croydon North by then a Labour-held seat). The MP for Croydon North East, David Congdon was chosen over Sir Paul Beresford, the MP for the former Croydon Central seat. However, three years after Labour had taken control of Croydon Council, Labour's Geraint Davies saw off Congdon with a majority of 4,000 votes. He retained the seat with a similar majority in 2001, but lost by just 75 votes to Conservative Andrew Pelling in 2005, with the Liberal Democrats and Green Party gaining a local record of 7,000 votes between them.
The 2015 general election result, gave the seat the third-most marginal majority of the Conservative Party's 331 seats by percentage of majority. [3] In 2017, Labour's Sarah Jones gained the seat with a majority of 5,652 votes, the largest in the seat for any party since 1992. Croydon Central was one of five constituencies, the others being Enfield Southgate, Leeds North West, Peterborough and Reading East; which elected Labour MPs in 2017 having not done so since 2001.
Dates | Local authority | Maps | Wards |
---|---|---|---|
1974–1983 | London Borough of Croydon | ![]() | Broad Green, Central, New Addington, Shirley, and Waddon. |
1983–1997 | ![]() | Fairfield, Fieldway, Heathfield, New Addington, Spring Park, and Waddon. | |
1997–2010 | ![]() | Addiscombe, Ashburton, Fairfield, Fieldway, Heathfield, Monks Orchard, New Addington, Rylands, Spring Park, and Woodside. | |
2010–2024 | ![]() | Addiscombe, Ashburton, Fairfield, Fieldway, Heathfield, New Addington, Shirley, and Woodside. |
Croydon Central covers the central and eastern parts of the London Borough of Croydon, one of the Borough's three seats. It is bordered by Croydon North and Croydon South, as well as Beckenham to the east.
The seat was redrawn in the 1997 redistribution, taking in territory from most of the pre-1997 Croydon Central constituency (losing Waddon ward to the redrawn Croydon South) and part of the abolished Croydon North East constituency. It covered an area that was Croydon South constituency until 1974 when part of Surrey East was incorporated into a new Croydon South constituency, following the creation of the London Borough of Croydon in 1965.
Election | Member [4] | Party | Notes | |
---|---|---|---|---|
February 1974 | John Moore | Conservative | ||
1992 | Sir Paul Beresford | Conservative | Lost preselection following redistribution | |
1997 | Geraint Davies | Labour | ||
2005 | Andrew Pelling | Conservative | ||
2007 | Independent | |||
2010 | Gavin Barwell | Conservative | ||
2017 | Sarah Jones | Labour |
Party | Candidate | Votes | % | ±% | |
---|---|---|---|---|---|
Labour | Sarah Jones | 27,124 | 50.2 | –2.1 | |
Conservative | Mario Creatura | 21,175 | 39.2 | –3.2 | |
Liberal Democrats | Simon Sprague | 3,532 | 6.5 | +4.6 | |
Green | Esther Sutton | 1,215 | 2.2 | +1.2 | |
Brexit Party | Peter Sonnex | 999 | 1.8 | New | |
Majority | 5,949 | 11.0 | +1.1 | ||
Turnout | 54,045 | 66.4 | –4.9 | ||
Registered electors | 81,410 | ||||
Labour hold | Swing | +0.6 |
Party | Candidate | Votes | % | ±% | |
---|---|---|---|---|---|
Labour | Sarah Jones | 29,873 | 52.3 | +9.6 | |
Conservative | Gavin Barwell [9] | 24,221 | 42.4 | –0.6 | |
Liberal Democrats | Gill Hickson | 1,083 | 1.9 | –0.3 | |
UKIP | Peter Staveley | 1,040 | 1.8 | –7.3 | |
Green | Tracey Hague | 626 | 1.1 | –1.7 | |
CPA | John Boadu | 177 | 0.3 | New | |
Independent | Don Locke | 71 | 0.1 | New | |
Majority | 5,652 | 9.9 | N/A | ||
Turnout | 57,091 | 71.3 | +3.6 | ||
Registered electors | 80,045 | ||||
Labour gain from Conservative | Swing | +5.1 |
Party | Candidate | Votes | % | ±% | |
---|---|---|---|---|---|
Conservative | Gavin Barwell | 22,753 | 43.0 | +3.6 | |
Labour | Sarah Jones | 22,588 | 42.7 | +9.1 | |
UKIP | Peter Staveley | 4,810 | 9.1 | +7.1 | |
Green | Esther Sutton [12] | 1,454 | 2.7 | +1.6 | |
Liberal Democrats | James Fearnley | 1,152 | 2.2 | –11.0 | |
TUSC | April Ashley | 127 | 0.2 | New | |
Progressive Democracy | Martin Camden | 57 | 0.1 | New | |
Majority | 165 | 0.3 | –5.5 | ||
Turnout | 52,941 | 67.7 | +2.7 | ||
Registered electors | 78,171 | ||||
Conservative hold | Swing | –2.7 |
Party | Candidate | Votes | % | ±% | |
---|---|---|---|---|---|
Conservative | Gavin Barwell | 19,567 | 39.4 | –1.2 | |
Labour Co-op | Gerry Ryan | 16,688 | 33.6 | –7.5 | |
Liberal Democrats | Peter Lambell | 6,553 | 13.2 | +0.6 | |
Independent | Andrew Pelling | 3,239 | 6.5 | New | |
BNP | Cliff le May | 1,448 | 2.9 | New | |
UKIP | Ralph Atkinson | 997 | 2.0 | –0.2 | |
Green | Bernice Golberg | 581 | 1.2 | –1.0 | |
Christian | James Gitau | 264 | 0.5 | New | |
Monster Raving Loony | John Cartwright | 192 | 0.4 | ±0.0 | |
Independent | Michael Castle | 138 | 0.3 | New | |
Majority | 2,879 | 5.8 | N/A | ||
Turnout | 49,667 | 65.1 | +4.5 | ||
Registered electors | 76,349 | ||||
Conservative gain from Labour (Notional.) | Swing | +3.1 |
2005 notional result | |||
---|---|---|---|
Party | Vote | % | |
Labour | 18,711 | 41.1 | |
Conservative | 18,490 | 40.6 | |
Liberal Democrats | 5,744 | 12.6 | |
Others | 2,585 | 5.7 | |
Turnout | 45,530 | 60.6 | |
Electorate | 75,166 |
Party | Candidate | Votes | % | ±% | |
---|---|---|---|---|---|
Conservative | Andrew Pelling | 19,974 | 40.8 | +2.3 | |
Labour | Geraint Davies | 19,899 | 40.6 | −6.5 | |
Liberal Democrats | Jeremy Hargreaves | 6,384 | 13.0 | +1.8 | |
UKIP | Ian Edwards | 1,066 | 2.2 | +1.0 | |
Green | Bernice Golberg | 1,036 | 2.1 | New | |
Veritas | Marianne Bowness | 304 | 0.6 | New | |
Monster Raving Loony | John Cartwright | 193 | 0.4 | –0.5 | |
The People's Choice! Exclusively For All | Janet Stears | 101 | 0.2 | New | |
Majority | 75 | 0.2 | N/A | ||
Turnout | 48,957 | 60.6 | +1.2 | ||
Registered electors | 81,149 | ||||
Conservative gain from Labour | Swing | +4.4 |
Party | Candidate | Votes | % | ±% | |
---|---|---|---|---|---|
Labour | Geraint Davies | 21,643 | 47.2 | +1.6 | |
Conservative | David Congdon | 17,659 | 38.5 | –0.1 | |
Liberal Democrats | Paul Booth | 5,156 | 11.2 | +0.4 | |
UKIP | James Feisenberger | 545 | 1.2 | +0.7 | |
BNP | Linda Miller | 449 | 1.0 | New | |
Monster Raving Loony | John Cartwright | 408 | 0.9 | New | |
Majority | 3,984 | 8.7 | +1.7 | ||
Turnout | 45,860 | 59.1 | –10.5 | ||
Registered electors | 77,568 | ||||
Labour hold | Swing | +0.9 |
Party | Candidate | Votes | % | ±% | |
---|---|---|---|---|---|
Labour | Geraint Davies | 25,432 | 45.6 | +14.1 | |
Conservative | David Congdon | 21,535 | 38.6 | –16.9 | |
Liberal Democrats | George W. Schlich | 6,061 | 10.9 | –2.1 | |
Referendum | Charles Cook | 1,886 | 3.4 | New | |
Green | Mario−Simon Barnsley | 595 | 1.1 | New | |
UKIP | John Woollcott | 290 | 0.5 | New | |
Majority | 3,897 | 7.0 | N/A | ||
Turnout | 55,799 | 69.6 | –5.2 | ||
Registered electors | 80,152 | ||||
Labour gain from Conservative | Swing | +15.5 |
1992 notional result | |||
---|---|---|---|
Party | Vote | % | |
Conservative | 33,940 | 55.5 | |
Labour | 19,279 | 31.5 | |
Liberal Democrats | 7,934 | 13.0 | |
Turnout | 61,153 | 74.8 | |
Electorate | 81,757 |
Party | Candidate | Votes | % | ±% | |
---|---|---|---|---|---|
Conservative | Paul Beresford | 22,168 | 55.4 | −1.2 | |
Labour | Geraint Davies | 12,518 | 31.3 | +6.9 | |
Liberal Democrats | Deborah Richardson | 5,342 | 13.3 | −5.7 | |
Majority | 9,650 | 24.1 | −8.2 | ||
Turnout | 40,028 | 71.7 | +1.2 | ||
Registered electors | 55,798 | ||||
Conservative hold | Swing | −4.1 |
Party | Candidate | Votes | % | ±% | |
---|---|---|---|---|---|
Conservative | John Moore | 22,133 | 56.6 | +2.8 | |
Labour | Bridget Prentice | 9,516 | 24.4 | +1.0 | |
SDP | Tyrell Burgess | 7,435 | 19.0 | –3.8 | |
Majority | 12,617 | 32.2 | +1.8 | ||
Turnout | 39,084 | 70.5 | +1.9 | ||
Registered electors | 55,410 | ||||
Conservative hold | Swing | +0.9 |
Party | Candidate | Votes | % | ±% | |
---|---|---|---|---|---|
Conservative | John Moore | 20,866 | 53.8 | –1.4 | |
Labour | Andrew MacKinlay | 9,045 | 23.3 | –11.2 | |
SDP | Tyrell Burgess | 8,864 | 22.9 | +13.3 | |
Majority | 11,821 | 30.5 | +14.7 | ||
Turnout | 38,775 | 68.6 | –7.1 | ||
Registered electors | 56,531 | ||||
Conservative hold | Swing | +4.9 |
1979 notional result [24] | |||
---|---|---|---|
Party | Vote | % | |
Conservative | 23,592 | 55.2 | |
Labour | 14,781 | 34.6 | |
Liberal | 4,093 | 9.6 | |
Others | 301 | 0.7 | |
Turnout | 42,767 | ||
Electorate |
Party | Candidate | Votes | % | ±% | |
---|---|---|---|---|---|
Conservative | John Moore | 26,457 | 52.5 | +10.4 | |
Labour | David White [25] | 18,499 | 36.7 | –5.1 | |
Liberal | John Johnson [25] | 5,112 | 10.1 | –6.0 | |
Ind. Conservative | Michael Soper [25] | 238 | 0.5 | New | |
Workers Revolutionary | Peter Gibson [25] | 116 | 0.2 | New | |
Majority | 7,958 | 15.8 | +15.4 | ||
Turnout | 50,422 | 75.7 | +3.09 | ||
Registered electors | 66,629 | ||||
Conservative hold | Swing | +7.7 |
Party | Candidate | Votes | % | ±% | |
---|---|---|---|---|---|
Conservative | John Moore | 20,390 | 42.1 | +1.6 | |
Labour | David Winnick | 20,226 | 41.7 | +3.7 | |
Liberal | Ian Maxwell | 7,834 | 16.2 | –5.3 | |
Majority | 164 | 0.3 | –2.2 | ||
Turnout | 48,450 | 72.6 | –7.1 | ||
Registered electors | 66,746 | ||||
Conservative hold | Swing | –1.1 |
Party | Candidate | Votes | % | ±% | |
---|---|---|---|---|---|
Conservative | John Moore | 21,353 | 40.5 | –6.8 | |
Labour | Richard Rosser | 20,039 | 38.0 | –7.1 | |
Liberal | Ian Maxwell | 11,346 | 21.5 | +14.5 | |
Majority | 1,314 | 2.5 | +0.4 | ||
Turnout | 52,738 | 79.7 | +8.4 | ||
Registered electors | 66,140 | ||||
Conservative win (new seat) |
1970 notional result [26] | |||
---|---|---|---|
Party | Vote | % | |
Conservative | 22,300 | 47.2 | |
Labour | 21,300 | 45.1 | |
Liberal | 3,300 | 7.0 | |
Others | 300 | 0.6 | |
Turnout | 47,200 | 71.4 | |
Electorate | 66,138 |
{{cite web}}
: CS1 maint: archived copy as title (link){{cite web}}
: CS1 maint: archived copy as title (link)