Roberts County, South Dakota

Last updated

Roberts County
Roberts County Courthouse.jpg
Map of South Dakota highlighting Roberts County.svg
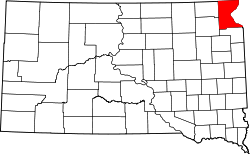
Location within the U.S. state of South Dakota
South Dakota in United States.svg
South Dakota's location within the U.S.
Coordinates: 45°37′N96°57′W / 45.62°N 96.95°W / 45.62; -96.95
CountryFlag of the United States.svg United States
StateFlag of South Dakota.svg  South Dakota
FoundedMarch 8, 1883 (organized) [1]
August 6, 1883 (organized)
Named after S. G. Roberts
Seat Sisseton
Largest citySisseton
Area
  Total
1,136 sq mi (2,940 km2)
  Land1,101 sq mi (2,850 km2)
  Water35 sq mi (90 km2)  3.1%
Population
 (2020)
  Total
10,280
  Estimate 
(2023)
10,206 Decrease2.svg
  Density9.0/sq mi (3.5/km2)
Time zone UTC−6 (Central)
  Summer (DST) UTC−5 (CDT)
Congressional district At-large
Website roberts.sdcounties.org

Roberts County is a county in the U.S. state of South Dakota. As of the 2020 census, the population was 10,280. [2] Its county seat is Sisseton. [3] The county was named either for S. G. Roberts of Fargo, North Dakota, or for Solomon Robar, an early local French fur trader. [1] It was created on March 8, 1883, and fully organized by August 6 of that year. Its boundary was altered once, in 1885. [4]

Contents

Geography

Soils of Roberts County Roberts Co SD Pie Chart No Text Version.pdf
Soils of Roberts County

Roberts County is at South Dakota's northeastern corner. Its eastern boundary abuts Minnesota (across the Bois de Sioux River), and its northern boundary abuts North Dakota. The Cottonwood Slough flows southward, draining the upper portion of the county into the River. The terrain consists of rolling hills, devoted to agriculture. [5] The terrain slopes to the east; its highest point is on its upper western boundary line, at 2,047 ft (624 m) ASL. [6]

Roberts County has an area of 1,136 square miles (2,940 km2), of which 1,101 square miles (2,850 km2) is land and 35 square miles (91 km2) (3.1%) is water. [7] The Traverse Gap is in eastern Roberts County along the Minnesota border. The Lake Traverse Indian Reservation covers most of the county.

Major highways

Transit

Adjacent counties

Protected areas [5]

Lakes and rivers [5]

Demographics

Historical population
CensusPop.Note
1890 1,997
1900 12,216511.7%
1910 14,89721.9%
1920 16,51410.9%
1930 15,782−4.4%
1940 15,8870.7%
1950 14,929−6.0%
1960 13,190−11.6%
1970 11,678−11.5%
1980 10,911−6.6%
1990 9,914−9.1%
2000 10,0161.0%
2010 10,1491.3%
2020 10,2801.3%
2024 (est.)10,283 [8] 0.0%
U.S. Decennial Census [9]
1790-1960 [10] 1900-1990 [11]
1990-2000 [12] 2010-2020 [2]

2020 census

As of the 2020 census, there were 10,280 people, 3,844 households, and 2,568 families residing in the county. [13] The population density was 9.3 inhabitants per square mile (3.6/km2). There were 4,788 housing units.

2010 census

As of the 2010 census, there were 10,149 people, 3,823 households, and 2,655 families residing in the county. The population density was 9.2 inhabitants per square mile (3.6/km2). There were 4,905 housing units at an average density of 4.5 units per square mile (1.7 units/km2). The racial makeup of the county was 61.7% white, 34.5% American Indian, 0.2% Asian, 0.1% black or African American, 0.4% from other races, and 3.0% from two or more races. Those of Hispanic or Latino origin made up 1.2% of the population. In terms of ancestry, 31.3% were German, 19.2% were Norwegian, 6.3% were Irish, and 3.8% were American.

Of the 3,823 households, 34.4% had children under the age of 18 living with them, 49.1% were married couples living together, 13.4% had a female householder with no husband present, 30.6% were non-families, and 27.3% of all households were made up of individuals. The average household size was 2.58 and the average family size was 3.11. The median age was 39.5 years.

The median income for a household in the county was $37,708 and the median income for a family was $46,146. Males had a median income of $34,080 versus $28,423 for females. The per capita income for the county was $19,825. About 14.3% of families and 20.0% of the population were below the poverty line, including 33.9% of those under age 18 and 11.0% of those age 65 or over.

Communities

Cities

Towns

Census-designated places

Unincorporated communities [5]

  • Hammer
  • Hartford Beach
  • Hiawatha Beach
  • Lindon Beach
  • Shady Beach
  • Victor

Townships

  • Agency
  • Alto
  • Becker
  • Bossko
  • Bryant
  • Dry Wood Lake
  • Easter
  • Enterprise
  • Garfield
  • Geneseo
  • Goodwill
  • Grant
  • Harmon
  • Hart
  • Lake
  • Lawrence
  • Lee
  • Lien
  • Lockwood
  • Long Hollow
  • Minnesota
  • Norway
  • One Road
  • Rosholt
  • Ortley
  • Sisseton
  • Springdale
  • Spring Grove
  • Summit
  • Victor
  • White Rock

Notable people

Politics

United States presidential election results for Roberts County, South Dakota [14]
Year Republican Democratic Third party(ies)
No.%No.%No.%
2024 2,51460.59%1,56037.60%751.81%
2020 2,40455.82%1,82842.44%751.74%
2016 2,14455.13%1,54039.60%2055.27%
2012 1,88344.24%2,30254.09%711.67%
2008 1,78139.26%2,67258.91%831.83%
2004 2,39648.09%2,52750.72%591.18%
2000 2,23754.91%1,70041.73%1373.36%
1996 1,64637.99%2,18650.45%50111.56%
1992 1,43734.87%1,71641.64%96823.49%
1988 2,01246.67%2,26752.59%320.74%
1984 2,76757.17%2,06342.62%100.21%
1980 2,90457.98%1,82936.51%2765.51%
1976 1,91539.73%2,89059.96%150.31%
1972 2,18742.29%2,97657.54%90.17%
1968 2,22542.68%2,65150.85%3376.46%
1964 1,93135.12%3,56764.88%00.00%
1960 2,85748.05%3,08951.95%00.00%
1956 2,85446.79%3,24653.21%00.00%
1952 3,56658.56%2,52441.44%00.00%
1948 2,21139.12%3,27757.98%1642.90%
1944 2,72147.36%3,02452.64%00.00%
1940 3,50448.30%3,75051.70%00.00%
1936 1,93432.50%3,82064.19%1973.31%
1932 1,38121.69%4,44069.72%5478.59%
1928 2,96652.73%2,61946.56%400.71%
1924 1,74440.99%2155.05%2,29653.96%
1920 2,33549.73%4479.52%1,91340.75%
1916 1,25947.17%1,19144.62%2198.21%
1912 00.00%81233.02%1,64766.98%
1908 1,56261.02%77730.35%2218.63%
1904 2,28275.02%58419.20%1765.79%
1900 1,87562.11%1,06735.34%772.55%
1896 1,32458.20%92940.84%220.97%
1892 53862.85%687.94%25029.21%

Education

School districts include: [15]

See also

References

  1. 1 2 Legislative Manual, South Dakota, 2005, p. 597
  2. 1 2 "State & County QuickFacts". United States Census Bureau. Retrieved March 20, 2024.
  3. "Find a County". National Association of Counties. Retrieved June 7, 2011.
  4. South Dakota County Histories/Roberts County (accessed February 8, 2019)
  5. 1 2 3 4 Roberts County SD Google Maps (accessed February 8, 2019)
  6. ""Find an Altitude" Google Maps (accessed February 8, 2019)". Archived from the original on May 21, 2019. Retrieved February 8, 2019.
  7. "2010 Census Gazetteer Files". United States Census Bureau. August 22, 2012. Retrieved March 28, 2015.
  8. "County Population Totals and Components of Change: 2020-2024" . Retrieved March 15, 2025.
  9. "U.S. Decennial Census". United States Census Bureau. Retrieved March 28, 2015.
  10. "Historical Census Browser". University of Virginia Library. Retrieved March 28, 2015.
  11. Forstall, Richard L., ed. (March 27, 1995). "Population of Counties by Decennial Census: 1900 to 1990". United States Census Bureau. Retrieved March 28, 2015.
  12. "Census 2000 PHC-T-4. Ranking Tables for Counties: 1990 and 2000" (PDF). United States Census Bureau. April 2, 2001. Archived (PDF) from the original on October 9, 2022. Retrieved March 28, 2015.
  13. "US Census Bureau, Table P16: Household Type". United States Census Bureau. Retrieved March 20, 2024.
  14. Leip, David. "Atlas of US Presidential Elections". uselectionatlas.org. Retrieved September 16, 2018.
  15. "2020 CENSUS - SCHOOL DISTRICT REFERENCE MAP: Roberts County, SD" (PDF). U.S. Census Bureau . Retrieved April 10, 2024. - Text list

45°37′N96°57′W / 45.62°N 96.95°W / 45.62; -96.95