Humphreys County, Mississippi | |
|---|---|
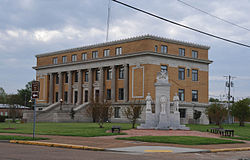 Humphreys County Courthouse | |
 Seal Logo | |
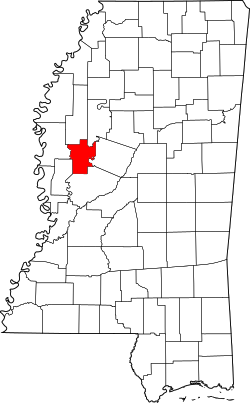 Location within the U.S. state of Mississippi | |
| Coordinates: 33°08′N90°31′W / 33.13°N 90.52°W | |
| Country | |
| State | |
| Founded | 1918 |
| Named after | Benjamin G. Humphreys |
| Seat | Belzoni |
| Largest city | Belzoni |
| Area | |
• Total | 431 sq mi (1,120 km2) |
| • Land | 418 sq mi (1,080 km2) |
| • Water | 13 sq mi (34 km2) 3.0% |
| Population (2020) | |
• Total | 7,785 |
| • Density | 18.6/sq mi (7.19/km2) |
| Time zone | UTC−6 (Central) |
| • Summer (DST) | UTC−5 (CDT) |
| Congressional district | 2nd |
| Website | humphreyscounty |
Humphreys County is a county located in the U.S. state of Mississippi. As of the 2020 census, the population was 7,785. [1] Its county seat is Belzoni. [2] The county is named for Benjamin G. Humphreys. Humphreys County is Mississippi's newest county, having been formed in 1918. Humphreys County is located in the Mississippi Delta region.
Contents
- Geography
- Major highways
- Adjacent counties
- National protected area
- Demographics
- 2020 census
- 2010 census
- 2000 census
- Politics
- Media
- Communities
- City
- Towns
- Unincorporated communities
- Education
- See also
- References
It was named 'Farm-Raised Catfish Capital of the World' in 1976 by then Governor Cliff Finch, since it produced more farm-raised catfish than any other U.S. county. Forty thousand acres (160 square kilometers) of the county are underwater and used to grow catfish. About 60% of U.S. farm-raised catfish is raised within a 65-mile (105 km) radius of the county seat, Belzoni. The title "Catfish Capital" has also been claimed by Savannah, Tennessee, and Des Allemands, Louisiana.
In March 2023, the towns of Rolling Fork, Midnight and Silver City were struck by an EF4, part of the tornado outbreak of March 24–25, 2023.
