Leake County | |
---|---|
![]() Leake County Courthouse in Carthage | |
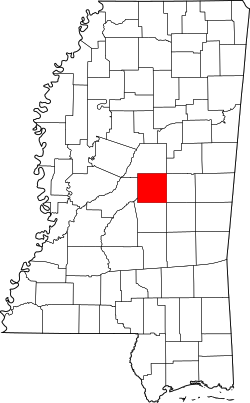
![]() Location within the U.S. state of Mississippi | |
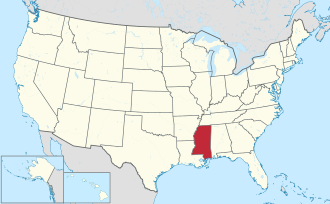
![]() Mississippi's location within the U.S. | |
Coordinates: 32°45′N89°31′W / 32.75°N 89.52°W | |
Country | ![]() |
State | ![]() |
Founded | 1833 |
Named for | Walter Leake |
Seat | Carthage |
Largest city | Carthage |
Area | |
• Total | 585 sq mi (1,520 km2) |
• Land | 583 sq mi (1,510 km2) |
• Water | 2.5 sq mi (6 km2) 0.4% |
Population (2020) | |
• Total | 21,275 |
• Density | 36/sq mi (14/km2) |
Time zone | UTC−6 (Central) |
• Summer (DST) | UTC−5 (CDT) |
Congressional district | 2nd |
Website | www |
Leake County is a county in the center of the U.S. state of Mississippi. As of the 2020 census, the population was 21,275. [1] Its county seat is Carthage. [2] The county is named for Walter Leake, the Governor of Mississippi from 1822 to 1825. [3]
In 2010, the center of population of Mississippi was located in Leake County, near the town of Lena. [4]
According to the U.S. Census Bureau, the county has a total area of 585 square miles (1,520 km2), of which 583 square miles (1,510 km2) is land and 2.5 square miles (6.5 km2) (0.4%) is water. [5]
Census | Pop. | Note | %± |
---|---|---|---|
1840 | 2,162 | — | |
1850 | 5,533 | 155.9% | |
1860 | 9,324 | 68.5% | |
1870 | 8,496 | −8.9% | |
1880 | 13,146 | 54.7% | |
1890 | 14,803 | 12.6% | |
1900 | 17,360 | 17.3% | |
1910 | 18,298 | 5.4% | |
1920 | 16,973 | −7.2% | |
1930 | 21,803 | 28.5% | |
1940 | 24,570 | 12.7% | |
1950 | 21,610 | −12.0% | |
1960 | 18,660 | −13.7% | |
1970 | 17,085 | −8.4% | |
1980 | 18,790 | 10.0% | |
1990 | 18,436 | −1.9% | |
2000 | 20,940 | 13.6% | |
2010 | 23,805 | 13.7% | |
2020 | 21,275 | −10.6% | |
2023 (est.) | 21,258 | [6] | −0.1% |
U.S. Decennial Census [7] 1790-1960 [8] 1900-1990 [9] 1990-2000 [10] 2010-2013 [11] |
Race | Num. | Perc. |
---|---|---|
White | 10,069 | 47.33% |
Black or African American | 8,189 | 38.49% |
Native American | 1,297 | 6.1% |
Asian | 78 | 0.37% |
Pacific Islander | 5 | 0.02% |
Other/Mixed | 407 | 1.91% |
Hispanic or Latino | 1,230 | 5.78% |
As of the 2020 United States census, there were 21,275 people, 8,105 households, and 5,591 families residing in the county.
As of the 2010 United States Census, there were 23,805 people living in the county. 49.5% were White, 40.6% Black or African American, 6.0% Native American, 0.2% Asian, 2.8% of some other race and 0.8% of two or more races. 4.3% were Hispanic or Latino (of any race).
As of the census [13] of 2000, there were 20,940 people, 7,611 households, and 5,563 families living in the county. The population density was 36 people per square mile (14 people/km2). There were 8,585 housing units at an average density of 15 units per square mile (5.8 units/km2). The racial makeup of the county was 56.14% White, 37.42% Black or African American, 4.56% Native American, 0.15% Asian, 0.03% Pacific Islander, 1.14% from other races, and 0.57% from two or more races. 2.10% of the population were Hispanic or Latino of any race.
There were 7,611 households, out of which 34.30% had children under the age of 18 living with them, 52.20% were married couples living together, 16.50% had a female householder with no husband present, and 26.90% were non-families. 24.30% of all households were made up of individuals, and 11.70% had someone living alone who was 65 years of age or older. The average household size was 2.65 and the average family size was 3.13. In the county, the population was spread out, with 26.90% under the age of 18, 10.10% from 18 to 24, 27.00% from 25 to 44, 21.70% from 45 to 64, and 14.30% who were 65 years of age or older. The median age was 35 years. For every 100 females there were 98.00 males. For every 100 females age 18 and over, there were 94.20 males.
The median income for a household in the county was $27,055, and the median income for a family was $32,147. Males had a median income of $27,367 versus $18,307 for females. The per capita income for the county was $13,365. About 18.10% of families and 23.30% of the population were below the poverty line, including 31.90% of those under age 18 and 23.90% of those age 65 or over.
The county is quite rural, with Carthage the only city and three towns.
The Mississippi Department of Corrections contracted for development of the Walnut Grove Youth Correctional Facility, which opened in 2001 in the town of Walnut Grove. [14] The facility was operated by the private Management and Training Corporation (MTC). [15]
By 2006, the Town of Walnut Grove annexed the land of the prison, resulting in an apparent increase in population, which was chiefly associated with prisoners. [16] MTC was repeatedly cited for problems with poor treatment of prisoners, and abuses within the facility. The state closed it in 2016. [17]
The Leake County School District is the sole school district of the county. [18] It includes Leake Central High School.
Choctaw Tribal School System has two tribal schools in the county: Red Water Elementary School and Standing Pine Elementary School. [19] [20]
East Central Community College is the area community college, including Carthage Career Advancement Center in Leake County.[ citation needed ]
Most white students attend private schools while black and Hispanic children attend the local public schools. Although, children of all races have the same opportunity to private school as well.[ citation needed ]
School | Total Students | White Students | Black Students | Hispanic Students | Note |
---|---|---|---|---|---|
Leake County | 24,000 | 56% | 37% | 2% | 2010 Census |
Leake Academy (private) | 578 | 571 (99%) | 0 (0%) | 3 (>1%) | [21] |
Leake Central High School (public) | 562 | 132 (20%) | 373 (66%) | 57 (10%) |
Year | Republican | Democratic | Third party(ies) | |||
---|---|---|---|---|---|---|
No. | % | No. | % | No. | % | |
2024 | 5,143 | 61.37% | 3,182 | 37.97% | 55 | 0.66% |
2020 | 5,228 | 56.83% | 3,897 | 42.36% | 75 | 0.82% |
2016 | 4,782 | 56.60% | 3,584 | 42.42% | 83 | 0.98% |
2012 | 4,863 | 54.14% | 4,079 | 45.41% | 41 | 0.46% |
2008 | 5,148 | 55.01% | 4,151 | 44.35% | 60 | 0.64% |
2004 | 4,962 | 60.41% | 3,212 | 39.10% | 40 | 0.49% |
2000 | 4,114 | 59.18% | 2,793 | 40.18% | 45 | 0.65% |
1996 | 3,017 | 47.60% | 2,902 | 45.79% | 419 | 6.61% |
1992 | 3,943 | 50.64% | 3,333 | 42.81% | 510 | 6.55% |
1988 | 4,168 | 59.86% | 2,787 | 40.03% | 8 | 0.11% |
1984 | 4,663 | 62.04% | 2,845 | 37.85% | 8 | 0.11% |
1980 | 3,624 | 46.83% | 4,033 | 52.12% | 81 | 1.05% |
1976 | 2,952 | 45.36% | 3,415 | 52.47% | 141 | 2.17% |
1972 | 4,217 | 79.13% | 1,053 | 19.76% | 59 | 1.11% |
1968 | 453 | 7.17% | 1,295 | 20.50% | 4,568 | 72.32% |
1964 | 4,343 | 96.23% | 170 | 3.77% | 0 | 0.00% |
1960 | 286 | 8.80% | 953 | 29.32% | 2,011 | 61.88% |
1956 | 220 | 7.34% | 2,475 | 82.53% | 304 | 10.14% |
1952 | 603 | 18.44% | 2,667 | 81.56% | 0 | 0.00% |
1948 | 12 | 0.46% | 180 | 6.97% | 2,392 | 92.57% |
1944 | 24 | 0.85% | 2,800 | 99.15% | 0 | 0.00% |
1940 | 17 | 0.60% | 2,802 | 99.26% | 4 | 0.14% |
1936 | 8 | 0.31% | 2,566 | 99.30% | 10 | 0.39% |
1932 | 14 | 0.73% | 1,903 | 98.81% | 9 | 0.47% |
1928 | 212 | 11.12% | 1,695 | 88.88% | 0 | 0.00% |
1924 | 48 | 3.68% | 1,255 | 96.32% | 0 | 0.00% |
1920 | 121 | 9.85% | 1,082 | 88.11% | 25 | 2.04% |
1916 | 31 | 2.08% | 1,434 | 96.05% | 28 | 1.88% |
1912 | 11 | 1.05% | 910 | 86.91% | 126 | 12.03% |
107 Braves Boulevard Carthage, MS 39051
538 Highway 487 East Carthage, MS 39051