Lawrence County, Mississippi | |
|---|---|
| | |
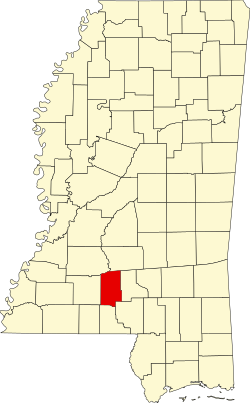
| Location within the U.S. state of Mississippi | |
| Coordinates: 31°33′N90°07′W / 31.55°N 90.11°W | |
| Country | |
| State | |
| Founded | 1814 |
| Named after | James Lawrence |
| Seat | Monticello |
| Largest town | Monticello |
| Area | |
• Total | 436 sq mi (1,130 km2) |
| • Land | 431 sq mi (1,120 km2) |
| • Water | 5.1 sq mi (13 km2) 1.2% |
| Population (2020) | |
• Total | 12,016 |
| • Density | 27.9/sq mi (10.8/km2) |
| Time zone | UTC−6 (Central) |
| • Summer (DST) | UTC−5 (CDT) |
| Congressional district | 3rd |
| Website | lawrencecountyms |
Lawrence County is a county located in the U.S. state of Mississippi. As of the 2020 census, the population was 12,016. [1] Its county seat is Monticello. [2] The county is named for the naval hero James Lawrence. [3]
According to the U.S. Census Bureau, the county has a total area of 436 square miles (1,130 km2), of which 431 square miles (1,120 km2) is land and 5.1 square miles (13 km2) (1.2%) is water. [4]
| Census | Pop. | Note | %± |
|---|---|---|---|
| 1820 | 4,916 | — | |
| 1830 | 5,293 | 7.7% | |
| 1840 | 5,920 | 11.8% | |
| 1850 | 6,478 | 9.4% | |
| 1860 | 9,213 | 42.2% | |
| 1870 | 6,720 | −27.1% | |
| 1880 | 9,420 | 40.2% | |
| 1890 | 12,318 | 30.8% | |
| 1900 | 15,103 | 22.6% | |
| 1910 | 13,080 | −13.4% | |
| 1920 | 12,663 | −3.2% | |
| 1930 | 12,471 | −1.5% | |
| 1940 | 13,983 | 12.1% | |
| 1950 | 12,639 | −9.6% | |
| 1960 | 10,215 | −19.2% | |
| 1970 | 11,137 | 9.0% | |
| 1980 | 12,518 | 12.4% | |
| 1990 | 12,458 | −0.5% | |
| 2000 | 13,258 | 6.4% | |
| 2010 | 12,929 | −2.5% | |
| 2020 | 12,016 | −7.1% | |
| 2024 (est.) | 11,672 | [5] | −2.9% |
| U.S. Decennial Census [6] 1790-1960 [7] 1900-1990 [8] 1990-2000 [9] 2010-2013 [10] | |||
As of the 2020 census, the county had a population of 12,016. The median age was 41.6 years. 24.8% of residents were under the age of 18 and 18.8% of residents were 65 years of age or older. For every 100 females there were 90.2 males, and for every 100 females age 18 and over there were 88.0 males age 18 and over. [11] [12]
The racial makeup of the county was 65.3% White, 30.8% Black or African American, 0.1% American Indian and Alaska Native, 0.3% Asian, <0.1% Native Hawaiian and Pacific Islander, 0.7% from some other race, and 2.7% from two or more races. Hispanic or Latino residents of any race comprised 1.7% of the population. [12]
<0.1% of residents lived in urban areas, while 100.0% lived in rural areas. [13]
There were 4,823 households in the county, of which 31.7% had children under the age of 18 living in them. Of all households, 45.4% were married-couple households, 18.5% were households with a male householder and no spouse or partner present, and 31.4% were households with a female householder and no spouse or partner present. About 28.7% of all households were made up of individuals and 14.0% had someone living alone who was 65 years of age or older. [11]
There were 5,717 housing units, of which 15.6% were vacant. Among occupied housing units, 80.8% were owner-occupied and 19.2% were renter-occupied. The homeowner vacancy rate was 0.9% and the rental vacancy rate was 11.1%. [11]
Public education is governed by the Lawrence County School District, which encompasses the entire county. [14]
It is in the district of Copiah–Lincoln Community College, and has been since 1965. [15]
Lawrence County, like most of Mississippi, was reliably Democratic until 1960, when a majority of voters elected a slate of unpledged Democratic electors nominated by segregationist governor Ross Barnett. Afterward, the county became increasingly Republican. The last Democrat to carry the county was Jimmy Carter in 1976; Bill Clinton won the county in 1996 with an 89-vote plurality.
| Year | Republican | Democratic | Third party(ies) | |||
|---|---|---|---|---|---|---|
| No. | % | No. | % | No. | % | |
| 1912 | 9 | 2.43% | 332 | 89.49% | 30 | 8.09% |
| 1916 | 18 | 2.41% | 725 | 97.18% | 3 | 0.40% |
| 1920 | 131 | 19.88% | 526 | 79.82% | 2 | 0.30% |
| 1924 | 55 | 7.54% | 674 | 92.46% | 0 | 0.00% |
| 1928 | 210 | 21.67% | 759 | 78.33% | 0 | 0.00% |
| 1932 | 31 | 3.21% | 933 | 96.68% | 1 | 0.10% |
| 1936 | 34 | 2.57% | 1,286 | 97.35% | 1 | 0.08% |
| 1940 | 37 | 2.95% | 1,218 | 97.05% | 0 | 0.00% |
| 1944 | 45 | 2.85% | 1,535 | 97.15% | 0 | 0.00% |
| 1948 | 13 | 0.97% | 66 | 4.92% | 1,262 | 94.11% |
| 1952 | 556 | 33.23% | 1,117 | 66.77% | 0 | 0.00% |
| 1956 | 276 | 18.17% | 1,025 | 67.48% | 218 | 14.35% |
| 1960 | 259 | 15.69% | 469 | 28.41% | 923 | 55.91% |
| 1964 | 2,373 | 90.95% | 236 | 9.05% | 0 | 0.00% |
| 1968 | 329 | 8.45% | 740 | 19.00% | 2,825 | 72.55% |
| 1972 | 3,394 | 81.70% | 709 | 17.07% | 51 | 1.23% |
| 1976 | 2,109 | 47.54% | 2,242 | 50.54% | 85 | 1.92% |
| 1980 | 2,781 | 50.02% | 2,692 | 48.42% | 87 | 1.56% |
| 1984 | 3,970 | 63.49% | 2,274 | 36.37% | 9 | 0.14% |
| 1988 | 3,682 | 59.17% | 2,517 | 40.45% | 24 | 0.39% |
| 1992 | 2,689 | 44.12% | 2,582 | 42.36% | 824 | 13.52% |
| 1996 | 2,392 | 44.54% | 2,481 | 46.19% | 498 | 9.27% |
| 2000 | 3,674 | 55.78% | 2,841 | 43.13% | 72 | 1.09% |
| 2004 | 3,956 | 62.73% | 2,308 | 36.60% | 42 | 0.67% |
| 2008 | 4,369 | 62.33% | 2,587 | 36.91% | 53 | 0.76% |
| 2012 | 4,192 | 62.59% | 2,468 | 36.85% | 38 | 0.57% |
| 2016 | 4,091 | 64.28% | 2,195 | 34.49% | 78 | 1.23% |
| 2020 | 4,285 | 64.80% | 2,260 | 34.18% | 68 | 1.03% |
| 2024 | 4,113 | 67.95% | 1,899 | 31.37% | 41 | 0.68% |