George County, Mississippi | |
|---|---|
| George County Courthouse in Lucedale | |
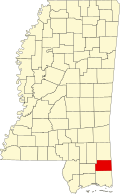
| Location within the U.S. state of Mississippi | |
| Coordinates: 30°52′N88°38′W / 30.87°N 88.64°W | |
| Country | |
| State | |
| Founded | 1910 |
| Named after | James Z. George |
| Seat | Lucedale |
| Largest city | Lucedale |
| Area | |
• Total | 484 sq mi (1,250 km2) |
| • Land | 479 sq mi (1,240 km2) |
| • Water | 4.9 sq mi (13 km2) 1.0% |
| Population (2020) | |
• Total | 24,350 |
• Estimate (2024) | 25,880 |
| • Density | 50.8/sq mi (19.6/km2) |
| Time zone | UTC−6 (Central) |
| • Summer (DST) | UTC−5 (CDT) |
| Congressional district | 4th |
| Website | www |
George County is a county located in the U.S. state of Mississippi. As of the 2020 census, the population was 24,350. [1] Its county seat is Lucedale. [2] The county is named for James Z. George, US Senator from Mississippi. George County was included in the Pascagoula, MS Metropolitan Statistical Area. The county is located adjacent to the Alabama state line.
George County was named after Senator James Z. George and was formed on March 16, 1910, from parts of land formerly included in Jackson and Greene Counties. [3]
The Gulf, Mobile and Ohio Railroad ran through Lucedale on its way to Mobile.
According to the U.S. Census Bureau, the county has a total area of 484 square miles (1,250 km2), of which 479 square miles (1,240 km2) is land and 4.9 square miles (13 km2) (1.0%) is water. [4]
| Census | Pop. | Note | %± |
|---|---|---|---|
| 1910 | 6,599 | — | |
| 1920 | 5,564 | −15.7% | |
| 1930 | 7,523 | 35.2% | |
| 1940 | 8,704 | 15.7% | |
| 1950 | 10,012 | 15.0% | |
| 1960 | 11,098 | 10.8% | |
| 1970 | 12,459 | 12.3% | |
| 1980 | 15,927 | 27.8% | |
| 1990 | 16,673 | 4.7% | |
| 2000 | 19,144 | 14.8% | |
| 2010 | 22,578 | 17.9% | |
| 2020 | 24,350 | 7.8% | |
| 2024 (est.) | 25,880 | [5] | 6.3% |
| U.S. Decennial Census [6] 1790-1960 [7] 1900-1990 [8] 1990-2000 [9] 2010-2013 [10] | |||
| Race | Num. | Perc. |
|---|---|---|
| White (non-Hispanic) | 20,929 | 85.95% |
| Black or African American (non-Hispanic) | 1,774 | 7.29% |
| Native American | 85 | 0.35% |
| Asian | 77 | 0.32% |
| Pacific Islander | 1 | 0.0% |
| Other/Mixed | 812 | 3.33% |
| Hispanic or Latino | 672 | 2.76% |
As of the 2020 census, the county had a population of 24,350. The median age was 38.5 years. 25.0% of residents were under the age of 18 and 16.3% of residents were 65 years of age or older. For every 100 females there were 101.5 males, and for every 100 females age 18 and over there were 100.6 males age 18 and over. [12] [13]
The racial makeup of the county was 86.7% White, 7.3% Black or African American, 0.4% American Indian and Alaska Native, 0.3% Asian, <0.1% Native Hawaiian and Pacific Islander, 1.5% from some other race, and 3.8% from two or more races. Hispanic or Latino residents of any race comprised 2.8% of the population. [13]
<0.1% of residents lived in urban areas, while 100.0% lived in rural areas. [14]
There were 8,916 households in the county, of which 34.8% had children under the age of 18 living in them. Of all households, 55.1% were married-couple households, 17.0% were households with a male householder and no spouse or partner present, and 23.0% were households with a female householder and no spouse or partner present. About 23.1% of all households were made up of individuals and 10.6% had someone living alone who was 65 years of age or older. [12]
There were 10,280 housing units, of which 13.3% were vacant. Among occupied housing units, 81.6% were owner-occupied and 18.4% were renter-occupied. The homeowner vacancy rate was 1.0% and the rental vacancy rate was 13.3%. [12]
The county has gone solidly Republican in the last ten Presidential elections. [15] In past Presidential elections third-party candidates sometimes did well here. In 1968, George Wallace won the county with over 90 percent of the vote, [16] which was the second highest percentage he received in any county. In 1988, the county gave David Duke 4.21%, his best performance in the nation. [17] In that election it also gave more support to Lenora Fulani than she received in most of the nation. In 2012, President Obama only received 14 percent of the vote, [18] and Hillary Clinton received barely ten percent in 2016. [19] In 2020, George County was only one of two counties that voted against replacing the state flag. The other was neighbouring Greene County.
The county is located in Mississippi's 4th congressional district, which has a Cook Partisan Voting Index of R+21 and is represented by Republican Mike Ezell.
| Year | Republican | Democratic | Third party(ies) | |||
|---|---|---|---|---|---|---|
| № | % | № | % | № | % | |
| 1912 | 5 | 1.72% | 231 | 79.38% | 55 | 18.90% |
| 1916 | 32 | 7.96% | 341 | 84.83% | 29 | 7.21% |
| 1920 | 56 | 16.67% | 263 | 78.27% | 17 | 5.06% |
| 1924 | 68 | 11.93% | 502 | 88.07% | 0 | 0.00% |
| 1928 | 369 | 52.34% | 336 | 47.66% | 0 | 0.00% |
| 1932 | 19 | 2.25% | 824 | 97.63% | 1 | 0.12% |
| 1936 | 24 | 2.61% | 892 | 97.17% | 2 | 0.22% |
| 1940 | 38 | 3.87% | 945 | 96.13% | 0 | 0.00% |
| 1944 | 92 | 8.05% | 1,051 | 91.95% | 0 | 0.00% |
| 1948 | 25 | 2.14% | 108 | 9.26% | 1,033 | 88.59% |
| 1952 | 603 | 30.86% | 1,351 | 69.14% | 0 | 0.00% |
| 1956 | 403 | 24.26% | 1,150 | 69.24% | 108 | 6.50% |
| 1960 | 310 | 14.97% | 844 | 40.75% | 917 | 44.28% |
| 1964 | 2,797 | 92.04% | 242 | 7.96% | 0 | 0.00% |
| 1968 | 171 | 3.91% | 214 | 4.89% | 3,992 | 91.20% |
| 1972 | 3,979 | 92.90% | 270 | 6.30% | 34 | 0.79% |
| 1976 | 1,957 | 37.43% | 3,072 | 58.75% | 200 | 3.82% |
| 1980 | 3,052 | 51.45% | 2,757 | 46.48% | 123 | 2.07% |
| 1984 | 4,346 | 72.10% | 1,655 | 27.46% | 27 | 0.45% |
| 1988 | 4,545 | 58.40% | 2,435 | 31.29% | 802 | 10.31% |
| 1992 | 4,141 | 43.55% | 2,650 | 27.87% | 2,718 | 28.58% |
| 1996 | 3,311 | 55.71% | 1,888 | 31.77% | 744 | 12.52% |
| 2000 | 5,143 | 70.61% | 1,977 | 27.14% | 164 | 2.25% |
| 2004 | 6,223 | 77.78% | 1,724 | 21.55% | 54 | 0.67% |
| 2008 | 7,700 | 82.49% | 1,532 | 16.41% | 103 | 1.10% |
| 2012 | 8,376 | 84.98% | 1,359 | 13.79% | 121 | 1.23% |
| 2016 | 8,696 | 87.92% | 1,027 | 10.38% | 168 | 1.70% |
| 2020 | 9,713 | 87.91% | 1,218 | 11.02% | 118 | 1.07% |
| 2024 | 9,858 | 89.06% | 1,138 | 10.28% | 73 | 0.66% |
The sole school district is George County School District. [21]