Adams County, Mississippi | |
|---|---|
| Adams County Courthouse | |
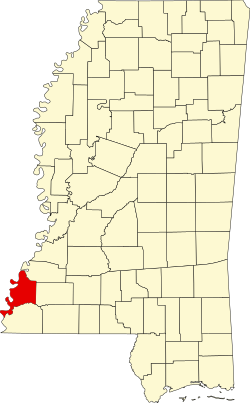
| Location within the U.S. state of Mississippi | |
| Coordinates: 31°29′N91°21′W / 31.48°N 91.35°W | |
| Country | |
| State | |
| Founded | 1799 |
| Named after | John Adams |
| Seat | Natchez |
| Largest city | Natchez |
| Area | |
• Total | 488 sq mi (1,260 km2) |
| • Land | 462 sq mi (1,200 km2) |
| • Water | 25 sq mi (65 km2) 5.2% |
| Population (2020) | |
• Total | 29,538 |
• Estimate (2024) | 28,674 |
| • Density | 63.9/sq mi (24.7/km2) |
| Time zone | UTC−6 (Central) |
| • Summer (DST) | UTC−5 (CDT) |
| Congressional district | 2nd |
| Website | www |
Adams County is a county located in the U.S. state of Mississippi. As of the 2020 United States census, the population was 29,538. [1] The county seat is Natchez. [2] The county is the first to have been organized in the former Mississippi Territory. It is named for the second President of the United States, John Adams, who held that office when the county was organized in 1799. Adams County is part of the Natchez micropolitan area which consists of Adams County, Mississippi and Concordia Parish, Louisiana.
Adams County was created on April 2, 1799, from part of Pickering Territorial County. The county was organized eighteen years before Mississippi became a state. Five Mississippi governors have come from Adams County: David Holmes, George Poindexter, John A. Quitman, Gerard Brandon, and William Allain.
In 1860, before the US Civil War, Adams County was the richest county in the United States. [3]
According to the U.S. Census Bureau, the county has a total area of 488 square miles (1,260 km2), of which 462 square miles (1,200 km2) is land and 25 square miles (65 km2) (5.2%) is water. [4]
| Census | Pop. | Note | %± |
|---|---|---|---|
| 1800 | 4,660 | — | |
| 1810 | 10,002 | 114.6% | |
| 1820 | 12,076 | 20.7% | |
| 1830 | 14,937 | 23.7% | |
| 1840 | 19,434 | 30.1% | |
| 1850 | 18,601 | −4.3% | |
| 1860 | 20,165 | 8.4% | |
| 1870 | 19,084 | −5.4% | |
| 1880 | 22,649 | 18.7% | |
| 1890 | 26,031 | 14.9% | |
| 1900 | 30,111 | 15.7% | |
| 1910 | 25,265 | −16.1% | |
| 1920 | 22,183 | −12.2% | |
| 1930 | 23,564 | 6.2% | |
| 1940 | 27,238 | 15.6% | |
| 1950 | 32,256 | 18.4% | |
| 1960 | 37,730 | 17.0% | |
| 1970 | 37,293 | −1.2% | |
| 1980 | 38,035 | 2.0% | |
| 1990 | 35,356 | −7.0% | |
| 2000 | 34,340 | −2.9% | |
| 2010 | 32,297 | −5.9% | |
| 2020 | 29,538 | −8.5% | |
| 2024 (est.) | 28,674 | [5] | −2.9% |
| U.S. Decennial Census [6] 1790-1960 [7] 1900-1990 [8] 1990-2000 [9] 2010-2013 [10] | |||
As of the 2020 census, the county had a population of 29,538. The median age was 43.7 years. 20.3% of residents were under the age of 18 and 21.6% of residents were 65 years of age or older. For every 100 females there were 90.8 males, and for every 100 females age 18 and over there were 89.0 males age 18 and over. [11] [12]
The racial makeup of the county was 37.2% White, 56.8% Black or African American, 0.2% American Indian and Alaska Native, 0.6% Asian, <0.1% Native Hawaiian and Pacific Islander, 2.6% from some other race, and 2.6% from two or more races. Hispanic or Latino residents of any race comprised 3.4% of the population. [12]
63.5% of residents lived in urban areas, while 36.5% lived in rural areas. [13]
There were 12,686 households in the county, of which 26.0% had children under the age of 18 living in them. Of all households, 31.5% were married-couple households, 21.3% were households with a male householder and no spouse or partner present, and 42.0% were households with a female householder and no spouse or partner present. About 36.0% of all households were made up of individuals and 16.5% had someone living alone who was 65 years of age or older. [11]
There were 14,885 housing units, of which 14.8% were vacant. Among occupied housing units, 66.7% were owner-occupied and 33.3% were renter-occupied. The homeowner vacancy rate was 2.7% and the rental vacancy rate was 10.0%. [11]
| Race | Num. | Perc. |
|---|---|---|
| White | 10,926 | 36.99% |
| Black or African American | 16,709 | 56.57% |
| Native American | 56 | 0.19% |
| Asian | 165 | 0.56% |
| Pacific Islander | 7 | 0.02% |
| Other/Mixed | 663 | 2.24% |
| Hispanic or Latino | 1,012 | 3.43% |
As of the 2010 census, there were 32,297 people, 11,237 households, and 6,650 families residing in the county. In 2010, 53.5% were Black or African American, 42.7% White, 0.4% Asian, 0.3% Native American, 1.7% of some other race and 1.4% of two or more races. 6.7% were Hispanic or Latino (of any race).
All residents of the county are in the Natchez-Adams School District. [15]
Alcorn State University, a historically black college that was designated as a land-grant institution, has its School of Business and School of Nursing at Natchez. The School of Business offers Masters of Business Administration degree and some undergraduate classes at the School of Business, Natchez campus.
It is in the district of Copiah–Lincoln Community College, and has been since 1971. [16] There is a campus in Natchez. [17] This is adjacent to the Natchez campus of Alcorn State University.
Adams County Correctional Center, a private prison operated by the Corrections Corporation of America on behalf of the Federal Bureau of Prisons, is in an unincorporated area in the county. [18]
The top employers of Adams County are as follows:
1. Natchez-Adams School District (620)
2. Merit Health Natchez (425)
3. Adams County Correctional Center (380)
4. Walmart (365)
5. City of Natchez (275)
6. Magnolia Bluffs Casino (250)
7. Jordan Carriers (250)
8. Supermarket Operations (250)
9. Adams County Government (220)
10. Energy Drilling (220)
| Year | Republican | Democratic | Third party(ies) | |||
|---|---|---|---|---|---|---|
| № | % | № | % | № | % | |
| 1912 | 31 | 4.06% | 491 | 64.35% | 241 | 31.59% |
| 1916 | 42 | 5.88% | 671 | 93.98% | 1 | 0.14% |
| 1920 | 114 | 15.02% | 642 | 84.58% | 3 | 0.40% |
| 1924 | 304 | 26.30% | 836 | 72.32% | 16 | 1.38% |
| 1928 | 840 | 38.59% | 1,337 | 61.41% | 0 | 0.00% |
| 1932 | 384 | 21.11% | 1,420 | 78.06% | 15 | 0.82% |
| 1936 | 124 | 6.67% | 1,732 | 93.12% | 4 | 0.22% |
| 1940 | 166 | 8.15% | 1,869 | 91.80% | 1 | 0.05% |
| 1944 | 282 | 14.69% | 1,638 | 85.31% | 0 | 0.00% |
| 1948 | 95 | 4.32% | 71 | 3.23% | 2,034 | 92.45% |
| 1952 | 2,372 | 58.29% | 1,697 | 41.71% | 0 | 0.00% |
| 1956 | 1,664 | 40.64% | 1,279 | 31.24% | 1,151 | 28.11% |
| 1960 | 1,227 | 23.57% | 1,452 | 27.90% | 2,526 | 48.53% |
| 1964 | 5,900 | 84.37% | 1,093 | 15.63% | 0 | 0.00% |
| 1968 | 1,475 | 10.93% | 5,214 | 38.62% | 6,812 | 50.46% |
| 1972 | 8,500 | 67.16% | 3,697 | 29.21% | 460 | 3.63% |
| 1976 | 6,431 | 46.40% | 6,619 | 47.75% | 811 | 5.85% |
| 1980 | 7,523 | 48.97% | 7,228 | 47.05% | 612 | 3.98% |
| 1984 | 9,440 | 54.32% | 7,849 | 45.17% | 89 | 0.51% |
| 1988 | 8,116 | 50.74% | 7,732 | 48.34% | 146 | 0.91% |
| 1992 | 5,831 | 36.73% | 8,255 | 51.99% | 1,791 | 11.28% |
| 1996 | 5,378 | 37.29% | 8,218 | 56.99% | 825 | 5.72% |
| 2000 | 6,691 | 44.97% | 8,065 | 54.20% | 123 | 0.83% |
| 2004 | 6,996 | 45.20% | 8,423 | 54.42% | 60 | 0.39% |
| 2008 | 6,566 | 41.83% | 9,021 | 57.47% | 109 | 0.69% |
| 2012 | 6,293 | 40.74% | 9,061 | 58.66% | 93 | 0.60% |
| 2016 | 5,874 | 42.45% | 7,757 | 56.06% | 205 | 1.48% |
| 2020 | 5,696 | 41.40% | 7,917 | 57.54% | 146 | 1.06% |
| 2024 | 5,081 | 42.60% | 6,743 | 56.53% | 104 | 0.87% |
Adams County, typical of other counties in the Solid South, was heavily Democratic during the first half of the 20th century. After supporting Dixiecrat Strom Thurmond in 1948, it began to lean more Republican, and remained that way until the 1980s. Since 1992, Adams County has returned to the Democratic fold.