Kentucky's 4th congressional district | |
---|---|
Interactive map of district boundaries since January 3, 2023 | |
Representative | |
Distribution |
|
Population (2023) | 768,776 [2] |
Median household income | $77,227 [2] |
Ethnicity |
|
Cook PVI | R+19 [3] |
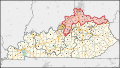
Kentucky's 4th congressional district is a congressional district in the U.S. state of Kentucky. Located in the northeastern portion of the state, it is a long district that follows the Ohio River. However, the district is dominated by its far western portion, comprising the eastern suburbs of Louisville and Northern Kentucky, the Kentucky side of the Cincinnati area. It is the richest congressional district in the state of Kentucky. [4]
The majority of voters live in the suburban Cincinnati counties of Boone, Kenton, and Campbell, which includes such suburbs as Fort Mitchell, Covington, Florence, Newport, and Fort Thomas. The next-largest population center is the northeastern suburbs of Louisville. It stretches as far south as northern portions of the city of Bardstown.
The district is currently represented by Republican Thomas Massie, who was elected in a special election in 2012 to succeed Republican Geoff Davis, who resigned on July 31, 2012, citing family concerns.
The 4th was one of the first areas of Kentucky to turn Republican outside of traditionally Republican south-central Kentucky; it has been in GOP hands for all but six years since 1967. Its politics are dominated by Republicans in the wealthy Cincinnati suburbs, which have swelled with former Cincinnati residents since the early 1960s. Between them, Boone, Kenton and Campbell counties have as many people as the rest of the district combined. As a measure of how much the Cincinnati suburbs have dominated the district, when Massie took office, he became the first congressman from the district's eastern portion in 45 years. Nonetheless, Democrats still hold state and local offices in rural counties.
Voter registration and party enrollment as of December 2024 [5] | |||||
---|---|---|---|---|---|
Party | Number of voters | Percentage | |||
Republican | 322,515 | 51.2% | |||
Democratic | 222,626 | 35.35% | |||
Other | 48,212 | 7.65% | |||
Independent | 36,495 | 5.79% | |||
Total | 629,845 | 100.00% |
Until January 1, 2006, Kentucky did not track party affiliation for registered voters who were neither Democratic nor Republican. [6] The Kentucky voter registration card does not explicitly list anything other than Democratic Party, Republican Party, or Other, with the "Other" option having a blank line and no instructions on how to register as something else. [7]
Year | Office | Results [8] [9] [10] |
---|---|---|
2008 | President | McCain 61% - 37% |
2012 | President | Romney 65% - 35% |
2016 | President | Trump 66% - 29% |
Senate | Paul 66% - 34% | |
2019 | Governor | Bevin 53% - 45% |
Attorney General | Cameron 63% - 37% | |
2020 | President | Trump 65% - 33% |
Senate | McConnell 61% - 35% | |
2022 | Senate | Paul 66% - 34% |
2023 | Governor | Cameron 52% - 48% |
Attorney General | Coleman 62% - 38% | |
Auditor of Public Accounts | Ball 64% - 36% | |
Secretary of State | Adams 63% - 37% | |
Treasurer | Metcalf 62% - 38% | |
2024 | President | Trump 67% - 31% |
For the 118th and successive Congresses (based on redistricting following the 2020 census), the district contains all or portions of the following counties and communities: [11]
BooneCounty (11)
BrackenCounty (3)
CampbellCounty (16)
CarrollCounty (5)
CarterCounty (0)
GallatinCounty (3)
GrantCounty (4)
GreenupCounty (8)
HarrisonCounty (2)
HenryCounty (5)
KentonCounty (16)
LewisCounty (3)
MasonCounty (5)
NelsonCounty (4)
OldhamCounty (9)
OwenCounty (4)
PendletonCounty (2)
ShelbyCounty (3)
SpencerCounty (2)
TrimbleCounty (2)
Party | Candidate | Votes | % | |
---|---|---|---|---|
Democratic | Ken Lucas* | 87,776 | 51.11 | |
Republican | Geoff Davis | 81,651 | 47.55 | |
Libertarian | John Grote | 2,308 | 1.34 | |
Total votes | 171,735 | 100.00 | ||
Turnout | ||||
Democratic hold |
Party | Candidate | Votes | % | |||
---|---|---|---|---|---|---|
Republican | Geoff Davis | 160,982 | 54.40 | |||
Democratic | Nick Clooney | 129,876 | 43.89 | |||
Independent | Michael Slider | 5,069 | 1.71 | |||
Total votes | 295,927 | 100.00 | ||||
Turnout | ||||||
Republican gain from Democratic |
Party | Candidate | Votes | % | |
---|---|---|---|---|
Republican | Geoff Davis* | 105,845 | 51.69 | |
Democratic | Ken Lucas | 88,822 | 43.38 | |
Libertarian | Brian Houillion | 10,100 | 4.93 | |
Total votes | 204,765 | 100.00 | ||
Turnout | ||||
Republican hold |
Party | Candidate | Votes | % | |
---|---|---|---|---|
Republican | Geoff Davis* | 190,210 | 63.03 | |
Democratic | Michael Kelley | 111,549 | 36.97 | |
Total votes | 301,759 | 100.00 | ||
Turnout | ||||
Republican hold |
Party | Candidate | Votes | % | |
---|---|---|---|---|
Republican | Geoff Davis* | 151,774 | 69.48 | |
Democratic | John Waltz | 66,675 | 30.52 | |
Total votes | 218,449 | 100.00 | ||
Turnout | ||||
Republican hold |
Party | Candidate | Votes | % | |
---|---|---|---|---|
Republican | Thomas Massie | 186,026 | 62.13 | |
Democratic | William Adkins | 104,731 | 34.98 | |
Independent | David Lewis | 8,673 | 2.90 | |
Total votes | 299,430 | 100.00 | ||
Turnout | ||||
Republican hold |
Party | Candidate | Votes | % | |
---|---|---|---|---|
Republican | Thomas Massie (Incumbent) | 150,464 | 67.7 | |
Democratic | Peter Newberry | 71,694 | 32.3 | |
Total votes | 222,158 | 100 | ||
Republican hold |
Party | Candidate | Votes | % | |
---|---|---|---|---|
Republican | Thomas Massie (Incumbent) | 233,922 | 71.32 | |
Democratic | Calvin Sidle | 94,065 | 28.68 | |
Total votes | 327,987 | 100 | ||
Republican hold |
Party | Candidate | Votes | % | |
---|---|---|---|---|
Republican | Thomas Massie (Incumbent) | 162,946 | 62.2 | |
Democratic | Seth Hall | 90,536 | 34.6 | |
Independent | Mike Moffett | 8,318 | 2.2 | |
Independent | David Goodwin (write-in) | 12 | 0.0 | |
Total votes | 261,812 | 100 | ||
Republican hold |
Party | Candidate | Votes | % | |
---|---|---|---|---|
Republican | Thomas Massie (Incumbent) | 256,613 | 67.1 | |
Democratic | Alexandra Owensby | 125,896 | 32.9 | |
Total votes | 382,509 | 100 | ||
Republican hold |
Party | Candidate | Votes | % | |
---|---|---|---|---|
Republican | Thomas Massie (incumbent) | 167,541 | 65.0 | |
Democratic | Matthew Lehman | 79,977 | 31.0 | |
Pirate Party | Ethan Osborne [a] | 10,111 | 3.9 | |
Total votes | 257,629 | 100.0 | ||
Republican hold |
38°33′57″N84°25′40″W / 38.56583°N 84.42778°W