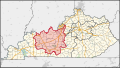
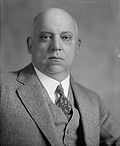
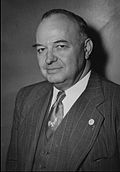
Member Party Years Cong Electoral history Location District created November 8, 1792 Alexander D. Orr (Maysville ) Anti-Administration November 8, 1792 – 2nd 3rd 4th Elected September 7, 1792 .Re-elected in 1793 .Re-elected in 1795 . 1792–1797 :Bourbon , Fayette , Mason , Scott , and Woodford counties Democratic-Republican March 4, 1795 – John Fowler (Lexington ) Democratic-Republican March 4, 1797 – 5th 6th 7th Elected in 1797 .Re-elected in 1799 .Re-elected in 1801 . 5th district . 1797–1803 :Bourbon , Campbell , Clark , Fayette , Franklin , Harrison , Mason , Scott , and Woodford counties John Boyle (Lancaster ) Democratic-Republican March 4, 1803 – 8th 9th 10th Elected in 1803 .Re-elected in 1804 .Re-elected in 1806 . 1803–1813 [ data missing ] Samuel McKee (Lancaster ) Democratic-Republican March 4, 1809 – 11th 12th Elected in 1808 .Re-elected in 1810 . 7th district . Henry Clay (Lexington ) Democratic-Republican March 4, 1813 – 13th Redistricted from the 5th district and re-elected in 1812 . 1813–1823 [ data missing ] Vacant January 19, 1814 – Joseph H. Hawkins (Lexington ) Democratic-Republican March 29, 1814 – Elected to finish Clay's term . Vacant March 3, 1815 – 14th Henry Clay was re-elected in 1814 , but the Governor declared the seat vacant as Clay was out of the country. Henry Clay (Lexington ) Democratic-Republican October 30, 1815 – 14th 15th 16th Elected to finish his vacant term .Re-elected in 1816 .Re-elected in 1818 . Samuel H. Woodson (Lexington ) Democratic-Republican March 4, 1821 – 17th Elected in 1820 . 7th district and lost re-election. Thomas Metcalfe (Carlisle ) Democratic-Republican March 3, 1823 – 18th 19th 20th Redistricted from the 4th district and re-elected in 1822 .Re-elected in 1824 .Re-elected in 1827 .run for Governor of Kentucky . 1823–1833 Bourbon , Bracken , Mason , Nicholas counties Anti-Jacksonian March 4, 1825 – Vacant June 1, 1828 – 20th John Chambers (Washington ) Anti-Jacksonian December 1, 1828 – Elected to finish Metcalfe's term . Nicholas D. Coleman (Washington ) Jacksonian March 4, 1829 – 21st Elected in 1829 . Thomas A. Marshall (Paris ) Anti-Jacksonian March 4, 1831 – 22nd Elected in 1831 . 12th district . Albert G. Hawes (Hawesville ) Jacksonian March 4, 1833 – 23rd 24th Redistricted from the 11th district and re-elected in 1833 .Re-elected in 1835 . 1833–1843 [ data missing ] Edward Rumsey (Greenville ) Whig March 4, 1837 – 25th Elected in 1837 . Philip Triplett (Owensboro ) Whig March 4, 1839 – 26th 27th Elected in 1839 .Re-elected in 1841 . Willis Green (Green ) Whig March 4, 1843 – 28th Redistricted from the 6th district and re-elected in 1843 . 1843–1853 [ data missing ] John H. McHenry (Hartford ) Whig March 4, 1845 – 29th Elected in 1845 . Beverly L. Clarke (Franklin ) Democratic March 4, 1847 – 30th Elected in 1847 .state constitutional convention . James L. Johnson (Owensboro ) Whig March 4, 1849 – 31st Elected in 1849 . Benjamin E. Grey (Hopkinsville ) Whig March 4, 1851 – 32nd 33rd Elected in 1851 .Re-elected in 1853 . 1853–1863 [ data missing ] John P. Campbell Jr. (Belleview ) Know Nothing March 4, 1855 – 34th Elected in 1855 . Samuel Peyton (Hartford ) Democratic March 4, 1857 – 35th 36th Elected in 1857 .Re-elected in 1859 . James S. Jackson (Hopkinsville ) Union Democratic March 4, 1861 – 37th Elected in 1861 .Union Army . Vacant December 13, 1861 – George H. Yeaman (Owensboro ) Union Democratic December 1, 1862 – 37th 38th Elected to finish Jackson's term .Re-elected in 1863 . 1863–1873 [ data missing ] Burwell C. Ritter (Hopkinsville ) Democratic March 4, 1865 – 39th Elected in 1865 . Vacant March 4, 1867 – 40th John Y. Brown was elected in 1867 but the seat was declared vacant due to Brown's alleged disloyalty during the Civil War, and the district refused to elect anyone to fill the vacancy. William N. Sweeney (Owensboro ) Democratic March 4, 1869 – 41st Elected in 1868 . Henry D. McHenry (Hartford ) Democratic March 4, 1871 – 42nd Elected in 1870 . John Y. Brown (Henderson ) Democratic March 4, 1873 – 43rd 44th Elected in 1872 .Re-elected in 1874 . 1873–1883 [ data missing ] James A. McKenzie (Long View ) Democratic March 4, 1877 – 45th 46th 47th Elected in 1876 .Re-elected in 1878 .Re-elected in 1880 . James F. Clay (Henderson ) Democratic March 4, 1883 – 48th Elected in 1882 . 1883–1893 [ data missing ] Polk Laffoon (Madisonville ) Democratic March 4, 1885 – 49th 50th Elected in 1884 .Re-elected in 1886 . William T. Ellis (Owensboro ) Democratic March 4, 1889 – 51st 52nd 53rd Elected in 1888 .Re-elected in 1890 .Re-elected in 1892 . 1893–1903 [ data missing ] John D. Clardy (Newstead ) Democratic March 4, 1895 – 54th 55th Elected in 1894 .Re-elected in 1896 . Henry D. Allen (Morganfield ) Democratic March 4, 1899 – 56th 57th Elected in 1898 .Re-elected in 1900 . Augustus O. Stanley (Henderson ) Democratic March 4, 1903 – 58th 59th 60th 61st 62nd 63rd Elected in 1902 .Re-elected in 1904 .Re-elected in 1906 .Re-elected in 1908 .Re-elected in 1910 .Re-elected in 1912 .run for U.S. Senator . 1903–1913 [ data missing ] 1913–1933 David H. Kincheloe (Madisonville ) Democratic March 4, 1915 – 64th 65th 66th 67th 68th 69th 70th 71st Elected in 1914 .Re-elected in 1916 .Re-elected in 1918 .Re-elected in 1920 .Re-elected in 1922 .Re-elected in 1924 .Re-elected in 1926 .Re-elected in 1928 .U.S. Customs Court . Vacant October 5, 1930 – 71st John L. Dorsey Jr. (Henderson ) Democratic November 4, 1930 – Elected to finish Kincheloe's term . Glover H. Cary (Owensboro ) Democratic March 4, 1931 – 72nd Elected in 1930 . at-large district . District inactive March 4, 1933 – 73rd Glover H. Cary (Owensboro ) Democratic March 4, 1935 – 74th Redistricted from the at-large district and re-elected in 1934 . 1935–1953 Vacant December 5, 1936 – Beverly M. Vincent (Brownsville ) Democratic March 2, 1937 – 74th 75th 76th 77th 78th Elected to finish Cary's term .Also elected to the next full term .Re-elected in 1938 .Re-elected in 1940 .Re-elected in 1942 . Earle Clements (Morganfield ) Democratic January 3, 1945 – 79th 80th Elected in 1944 .Re-elected in 1946 .elected Governor of Kentucky . Vacant January 6, 1948 – 80th John A. Whitaker (Russellville ) Democratic April 17, 1948 – 80th 81st 82nd Elected to finish Clements's term .Re-elected in 1948 .Re-elected in 1950 . Vacant December 15, 1951 – 82nd Garrett Withers (Dixon ) Democratic August 2, 1952 – 82nd 83rd Elected to finish Whitaker's term .Re-elected later in 1952 . 1953–1957 Vacant April 30, 1953 – 83rd William Natcher (Bowling Green ) Democratic August 1, 1953 – 83rd 84th 85th 86th 87th 88th 89th 90th 91st 92nd 93rd 94th 95th 96th 97th 98th 99th 100th 101st 102nd 103rd Elected to finish Wither's term .Re-elected in 1954 .Re-elected in 1956 .Re-elected in 1958 .Re-elected in 1960 .Re-elected in 1962 .Re-elected in 1964 .Re-elected in 1966 .Re-elected in 1968 .Re-elected in 1970 .Re-elected in 1972 .Re-elected in 1974 .Re-elected in 1976 .Re-elected in 1978 .Re-elected in 1980 .Re-elected in 1982 .Re-elected in 1984 .Re-elected in 1986 .Re-elected in 1988 .Re-elected in 1990 .Re-elected in 1992 . 1957–1963 1963–1967 1967–1973 1973–1983 1983–1993 1993–1997 Vacant March 29, 1994 – 103rd Ron Lewis (Cecilia ) Republican May 24, 1994 – 103rd 104th 105th 106th 107th 108th 109th 110th Elected to finish Natcher's term .Re-elected in 1994 .Re-elected in 1996 .Re-elected in 1998 .Re-elected in 2000 .Re-elected in 2002 .Re-elected in 2004 .Re-elected in 2006 . 1997–2003 2003–2013 Brett Guthrie (Bowling Green ) Republican January 3, 2009 – 111th 112th 113th 114th 115th 116th 117th 118th 119th Elected in 2008 .Re-elected in 2010 .Re-elected in 2012 .Re-elected in 2014 .Re-elected in 2016 .Re-elected in 2018 .Re-elected in 2020 .Re-elected in 2022 .Re-elected in 2024 . 2013–2023 [ a] 2023–present