Quitman County, Georgia | |
|---|---|
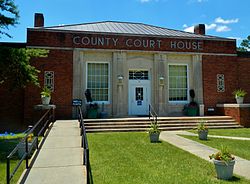
| Quitman County Courthouse in Georgetown | |
| Location within the U.S. state of Georgia | |
| Coordinates: 31°52′N85°01′W / 31.86°N 85.01°W | |
| Country | |
| State | |
| Founded | December 10, 1858 |
| Named after | John A. Quitman |
| Seat | Georgetown |
| Largest city | Georgetown |
| Area | |
• Total | 161 sq mi (420 km2) |
| • Land | 151 sq mi (390 km2) |
| • Water | 9.3 sq mi (24 km2) 5.8% |
| Population (2020) | |
• Total | 2,235 |
• Estimate (2024) | 2,323 |
| • Density | 14.8/sq mi (5.71/km2) |
| Time zone | UTC−5 (Eastern) |
| • Summer (DST) | UTC−4 (EDT) |
| Congressional district | 2nd |
| Website | gqc-ga.org |
Quitman County is a county located in the southwestern part of the U.S. state of Georgia. As of the 2020 census, the population was 2,235, [1] making it the second-least populous county in Georgia. The county seat is Georgetown. [2] The county was created on December 10, 1858, and named after General John A. Quitman, leader in the Mexican–American War, and once Governor of Mississippi. In November 2006, residents voted to consolidate the city government of Georgetown and the county government of Quitman into a consolidated city-county.
According to the U.S. Census Bureau, the county has a total area of 161 square miles (420 km2), of which 151 square miles (390 km2) is land and 9.3 square miles (24 km2) (5.8%) is water. [3] The entirety of Quitman County is located in the Middle Chattahoochee River–Walter F. George Lake sub-basin of the ACF River Basin (Apalachicola-Chattahoochee-Flint River Basin). [4]
| Census | Pop. | Note | %± |
|---|---|---|---|
| 1860 | 3,499 | — | |
| 1870 | 4,150 | 18.6% | |
| 1880 | 4,392 | 5.8% | |
| 1890 | 4,471 | 1.8% | |
| 1900 | 4,701 | 5.1% | |
| 1910 | 4,594 | −2.3% | |
| 1920 | 3,417 | −25.6% | |
| 1930 | 3,820 | 11.8% | |
| 1940 | 3,435 | −10.1% | |
| 1950 | 3,015 | −12.2% | |
| 1960 | 2,432 | −19.3% | |
| 1970 | 2,180 | −10.4% | |
| 1980 | 2,357 | 8.1% | |
| 1990 | 2,209 | −6.3% | |
| 2000 | 2,598 | 17.6% | |
| 2010 | 2,513 | −3.3% | |
| 2020 | 2,235 | −11.1% | |
| 2024 (est.) | 2,323 | [5] | 3.9% |
| U.S. Decennial Census [6] 1790-1880 [7] 1890-1910 [8] 1920-1930 [9] 1930-1940 [10] 1940-1950 [11] 1960-1980 [12] 1980-2000 [13] 2010 [14] | |||
| Race / Ethnicity (NH = Non-Hispanic) | Pop 2000 [15] | Pop 2010 [16] | Pop 2020 [17] | % 2000 | % 2010 | % 2020 |
|---|---|---|---|---|---|---|
| White alone (NH) | 1,351 | 1,265 | 1,190 | 52.00% | 50.34% | 53.24% |
| Black or African American alone (NH) | 1,213 | 1,198 | 917 | 46.69% | 47.67% | 41.03% |
| Native American or Alaska Native alone (NH) | 5 | 3 | 13 | 0.19% | 0.12% | 0.58% |
| Asian alone (NH) | 1 | 2 | 12 | 0.04% | 0.08% | 0.54% |
| Pacific Islander alone (NH) | 0 | 0 | 0 | 0.00% | 0.00% | 0.00% |
| Other race alone (NH) | 1 | 0 | 9 | 0.04% | 0.00% | 0.40% |
| Mixed race or Multiracial (NH) | 14 | 11 | 63 | 0.54% | 0.44% | 2.82% |
| Hispanic or Latino (any race) | 13 | 34 | 31 | 0.50% | 1.35% | 1.39% |
| Total | 2,598 | 2,513 | 2,235 | 100.00% | 100.00% | 100.00% |
As of the 2020 census, the county had a population of 2,235 and a median age of 53.7 years, with 16.3% of residents under the age of 18 and 31.1% aged 65 or older; for every 100 females there were 98.0 males and for every 100 females age 18 and over there were 99.4 males age 18 and over. [18]
As of the 2020 census, 26.3% of residents lived in urban areas while 73.7% lived in rural areas. [19]
As of the 2020 census, the racial makeup of the county was 53.2% White, 41.1% Black or African American, 0.6% American Indian and Alaska Native, 0.5% Asian, 0.0% Native Hawaiian and Pacific Islander, 0.4% from some other race, and 4.1% from two or more races; Hispanic or Latino residents of any race comprised 1.4% of the population. [20]
As of the 2020 census, there were 998 households in the county, of which 22.0% had children under age 18 living with them and 30.5% had a female householder with no spouse or partner present; about 32.9% of all households were made up of individuals and 17.8% had someone living alone who was 65 years of age or older. [18]
As of the 2020 census, there were 1,678 housing units, of which 40.5% were vacant; among occupied housing units, 77.6% were owner-occupied and 22.4% were renter-occupied, with homeowner and rental vacancy rates of 4.5% and 9.9%, respectively. [18]
Quitman County School District operates area public schools, including Quitman County High School.
County students attended Stewart-Quitman High School (now Stewart County High School) from 1978, until Quitman County High opened, [21] in 2009.[ citation needed ]
| Year | Republican | Democratic | Third party(ies) | |||
|---|---|---|---|---|---|---|
| № | % | № | % | № | % | |
| 1912 | 7 | 4.27% | 152 | 92.68% | 5 | 3.05% |
| 1916 | 15 | 10.56% | 125 | 88.03% | 2 | 1.41% |
| 1920 | 4 | 2.88% | 135 | 97.12% | 0 | 0.00% |
| 1924 | 8 | 5.33% | 138 | 92.00% | 4 | 2.67% |
| 1928 | 41 | 19.07% | 174 | 80.93% | 0 | 0.00% |
| 1932 | 0 | 0.00% | 239 | 98.35% | 4 | 1.65% |
| 1936 | 19 | 5.08% | 355 | 94.92% | 0 | 0.00% |
| 1940 | 19 | 5.54% | 324 | 94.46% | 0 | 0.00% |
| 1944 | 16 | 4.31% | 355 | 95.69% | 0 | 0.00% |
| 1948 | 19 | 5.26% | 246 | 68.14% | 96 | 26.59% |
| 1952 | 93 | 21.88% | 332 | 78.12% | 0 | 0.00% |
| 1956 | 31 | 8.03% | 355 | 91.97% | 0 | 0.00% |
| 1960 | 67 | 14.73% | 388 | 85.27% | 0 | 0.00% |
| 1964 | 377 | 62.11% | 230 | 37.89% | 0 | 0.00% |
| 1968 | 90 | 12.05% | 198 | 26.51% | 459 | 61.45% |
| 1972 | 502 | 78.19% | 140 | 21.81% | 0 | 0.00% |
| 1976 | 313 | 31.62% | 677 | 68.38% | 0 | 0.00% |
| 1980 | 240 | 28.67% | 589 | 70.37% | 8 | 0.96% |
| 1984 | 361 | 42.42% | 490 | 57.58% | 0 | 0.00% |
| 1988 | 296 | 40.11% | 436 | 59.08% | 6 | 0.81% |
| 1992 | 284 | 30.80% | 523 | 56.72% | 115 | 12.47% |
| 1996 | 224 | 28.11% | 514 | 64.49% | 59 | 7.40% |
| 2000 | 348 | 38.50% | 542 | 59.96% | 14 | 1.55% |
| 2004 | 409 | 42.38% | 543 | 56.27% | 13 | 1.35% |
| 2008 | 509 | 45.61% | 597 | 53.49% | 10 | 0.90% |
| 2012 | 510 | 45.21% | 612 | 54.26% | 6 | 0.53% |
| 2016 | 575 | 55.08% | 461 | 44.16% | 8 | 0.77% |
| 2020 | 604 | 54.61% | 497 | 44.94% | 5 | 0.45% |
| 2024 | 656 | 57.54% | 480 | 42.11% | 4 | 0.35% |
| Year | Republican | Democratic | Third party(ies) | |||
|---|---|---|---|---|---|---|
| № | % | № | % | № | % | |
| 2022 | 477 | 59.11% | 330 | 40.89% | 0 | 0.00% |
As of the 2020s, Quitman County is a Republican stronghold, voting 57% for Donald Trump in 2024. From the 1940s to 1960s Joe Hurst dominated politics in Quitman County, delivering votes for statewide officials, state judges, and prosecuting attorneys, under the County unit system which gave Quitman two units, a third as many as the biggest counties in the state. He hand-delivered state welfare checks and prevented secret ballots. In 1962 he stuffed the ballot box for future President Jimmy Carter's opponent in a state senate primary. Carter won a series of court cases to remove his Democratic primary opponent's name from the general election ballot. There was no Republican candidate. Both candidates used radio ads to ask voters to vote by write-in, and Carter won the general election. Hurst was later convicted of fraud in an earlier primary, for which he had a fine and three years probation. He was also convicted of selling moonshine, for which he went to prison. [24] [25]
For elections to the United States House of Representatives, Quitman County is part of Georgia's 2nd congressional district, currently represented by Sanford Bishop. For elections to the Georgia State Senate, Quitman County is part of District 12. [26] For elections to the Georgia House of Representatives, Quitman County is part of District 154. [27]
{{citation}}: CS1 maint: location missing publisher (link)