Results of the 2013 Australian federal election (House of Representatives) Last updated April 10, 2025 Australia Results by winning party by division for the House of Representatives. Government (90) Coalition Liberal (58) LNP (22) National (9) CLP (1) Opposition (55) Labor (55) Crossbench (5) Green (1) Palmer (1) Katter (1) Independent (2) House of Representatives (IRV )CV ) — Informal 5.91% [ 2] Party Votes % Swing Seats Change Labor 4,311,365 33.38 −4.61 55 Coalition 5,882,818 45.55 +2.23 90 Liberal 4,134,865 32.02 +1.56 58 Liberal National 1,152,217 8.92 −0.20 22 National 554,268 4.29 +0.56 9 Country Liberal (NT) 41,468 0.32 +0.01 1 Greens 1,116,918 8.65 −3.11 1 Palmer United 709,035 5.49 +5.49 1 Family First 181,820 1.41 −0.84 Katter's Australian 134,226 1.04 +0.73 1 Christian Democrats 88,576 0.69 +0.02 Sex Party 78,571 0.61 +0.52 Rise Up Australia 48,582 0.38 +0.38 Australian Christians 42,498 0.33 +0.33 Democratic Labour 36,086 0.28 +0.24 One Nation 22,046 0.17 −0.05 Bullet Train 19,801 0.15 +0.15 Citizens Electoral Council 10,400 0.08 +0.02 Australia First 7,412 0.06 +0.03 Socialist Alliance 5,032 0.04 −0.04 Secular 4,834 0.04 −0.06 Liberal Democrats 4,716 0.04 −0.16 Country Alliance 4,708 0.04 +0.04 Australian Independents 4,163 0.03 +0.03 Stable Population 3,954 0.03 +0.03 Democrats 3,614 0.03 −0.15 Animal Justice 1,878 0.01 +0.01 First Nations 1,810 0.01 +0.01 Australian Voice 1,681 0.01 +0.01 Non-Custodial Parents 1,547 0.01 −0.01 Australian Sports 1,324 0.01 +0.01 Future 1,174 0.01 +0.01 Protectionist 1,079 0.01 +0.01 Voluntary Euthanasia 597 0.00 +0.00 Uniting Australia 386 0.00 +0.00 Senator Online 209 0.00 +0.00 Independents 177,217 1.37 −1.15 2 Non Affiliated 4,850 0.04 +0.02 Total 12,914,927 150 Two-party-preferred vote Liberal/National Coalition 6,908,710 53.49 +3.61 90 Labor 6,006,217 46.51 −3.61 55 Invalid/blank votes 811,143 5.91 +0.36 Registered voters/turnout 14,723,385 93.23 Source: Federal Election 2013
Preference flows Greens − Labor 83.0% (+4.2) to Coalition 17.0% (−4.2) Palmer − Coalition 53.7% to Labor 46.3% Family First − Coalition 58.3% (−1.5) to Labor 41.7% (+1.5) Katter − Coalition 54.0% to Labor 46.0% Independent candidates − Labor 57.1% (+13.6) to Coalition 42.9% (−13.6) [ 3] New South Wales 2013 Australian federal election Results outside Sydney Results in Sydney
Turnout 93.33% (CV ) — Informal 6.83% [ 4] Party Votes % Swing Seats Change Coalition Liberal 1,551,436 37.35 +0.68 23 National 414,772 9.99 +2.06 7 Labor 1,433,842 34.52 −2.76 18 Greens 330,050 7.95 –2.29 Palmer United 174,551 4.20 +4.20 Christian Democrats 88,576 2.13 +0.77 One Nation 19,517 0.47 –0.01 Democratic Labour 16,909 0.41 +0.41 Katter's Australian 16,534 0.40 +0.40 Bullet Train 8,174 0.20 +0.20 Australia First 6,084 0.15 +0.07 Rise Up Australia 5,449 0.13 +0.13 Citizens Electoral Council 4,057 0.10 +0.07 Sex Party 3,292 0.08 +0.00 Stable Population 2,245 0.05 +0.05 Australian Independents 2,092 0.05 +0.05 Non-Custodial Parents 1,332 0.03 –0.04 Socialist Alliance 1,229 0.03 –0.06 Future 693 0.02 +0.02 Secular 602 0.01 –0.08 Australian Voice 545 0.01 +0.01 Independents 71,848 1.73 −2.58 0 Total 4,153,829 48 Two-party-preferred vote Liberal/National Coalition 2,257,654 54.35 +3.19 30 Labor 1,896,175 45.65 –3.19 18
Labor to Liberal: Banks , Barton , Eden-Monaro , Lindsay , Reid , Robertson
Labor to National: Page
Independent to Liberal: Dobell (Labor at last election)
Independent to National: Lyne , New England
Victoria 2013 Australian federal election Winning Party by Electorate First Preference Vote Two-Candidate Preferred Vote
Electoral divisions: Victoria Electoral divisions: Melbourne area Turnout 93.42% (CV ) — Informal 5.19% [ 5] Party Votes % Swing Seats Change Coalition Liberal 1,320,417 40.08 +3.63 14 National 86,045 2.61 –0.58 2 Labor 1,146,894 34.81 –8.00 19 Greens 355,698 10.80 –1.86 1 Palmer United 119,623 3.63 +3.63 Australian Sex Party 67,460 2.05 +1.86 Family First 59,288 1.80 –1.34 Rise Up Australia 18,124 0.55 +0.55 Democratic Labour 16,714 0.51 +0.51 Australian Christians 15,886 0.48 +0.48 Katter's Australian 15,409 0.47 +0.47 Liberal Democrats 4,716 0.14 –0.11 Country Alliance 4,708 0.14 +0.14 Animal Justice 1,878 0.06 +0.06 Bullet Train 1,772 0.05 +0.05 Socialist Alliance 1,703 0.05 –0.02 Stable Population 856 0.03 +0.03 Secular 776 0.02 –0.14 Citizens Electoral Council 557 0.03 −0.01 Non-Custodial Parents 215 0.01 +0.01 Australia First 212 0.01 +0.00 Senator Online 209 0.01 +0.01 Australian Independents 170 0.01 +0.01 Protectionist 156 0.00 +0.00 Independents 53,307 1.62 +0.79 1 Non Affiliated 1,886 0.06 +0.04 Total 3,294,659 37 Two-party-preferred vote Labor 1,653,977 50.20 −5.11 19 Liberal/National Coalition 1,640,682 49.80 +5.11 16
Independents: Cathy McGowan
Labor to Liberal: Corangamite , Deakin , La Trobe
Liberal to Independent: Indi
Queensland 2013 Australian federal election Winning Party by Electorate First Preference Vote Two-Candidate Preferred Vote
Electoral divisions: Queensland Electoral divisions: Brisbane area Turnout 93.55% (CV ) — Informal 5.13% [ 6] Party Votes % Swing Seats Change Liberal National 1,152,217 45.66 –1.76 22 Labor 751,230 29.77 –3.81 6 Palmer United 278,125 11.02 +11.02 1 Greens 156,884 6.22 –4.70 Katter's Australian 94,540 3.75 +2.15 1 Family First 51,375 2.04 –1.85 Rise Up Australia 9,889 0.39 +0.39 Australian Sex Party 2,859 0.11 +0.11 One Nation 2,529 0.10 −0.06 Citizens Electoral Council 2,292 0.09 +0.03 Australian Independents 1,901 0.08 +0.08 Secular 1,808 0.07 +0.05 Australian Voice 1,136 0.05 +0.05 Democratic Labour 1,075 0.04 −0.15 Stable Population 729 0.03 +0.03 Future 481 0.02 +0.02 Uniting Australia 386 0.02 +0.02 Socialist Alliance 377 0.01 −0.02 Independents 10,435 0.41 −1.48 0 Non Affiliated 2,984 0.12 +0.09 Total 2,523,252 30 Two-party-preferred vote Liberal National 1,437,803 56.98 +1.84 22 Labor 1,085,449 43.02 –1.84 6
Labor to LNP: Capricornia , Petrie
LNP to Palmer United: Fairfax
Western Australia 2013 Australian federal election Results by electorate
Electoral divisions: Western Australia Turnout 92.07% (CV ) — Informal 5.38% [ 7] Party Votes % Swing Seats Change Liberal 599,153 47.31 +0.29 12 Labor 364,252 28.76 –2.42 3 Greens 123,370 9.74 –2.42 Palmer United 67,332 5.32 +5.32 National Party (WA) 49,430 3.90 +0.32 0 Australian Christians 25,649 2.03 +2.03 Family First 11,777 0.93 –0.79 Rise Up Australia 9,153 0.72 +0.72 Katter's Australian 4,997 0.39 +0.39 Australian Sex Party 2,236 0.18 +0.01 Citizens Electoral Council 1,638 0.13 +0.02 Australian Sports 1,324 0.10 +0.10 Democrats 1,170 0.09 +0.09 Protectionist 923 0.07 +0.07 Socialist Alliance 743 0.06 −0.05 Independents 3,357 0.27 –0.15 Total 1,266,504 15 Two-party-preferred vote Liberal/National Coalition 738,110 58.28 +1.87 12 Labor 528,394 41.72 –1.87 3
WA National to Liberal: O'Connor
South Australia Electoral divisions: South Australia Turnout 93.47% (CV ) — Informal 4.85% [ 8] Party Votes % Swing Seats Change Liberal 447,286 44.49 +4.28 6 Labor 359,273 35.73 –5.01 5 Greens 83,252 8.28 –3.70 Family First 54,409 5.41 +0.45 Palmer United 37,981 3.78 +3.78 National Party (SA) 4,021 0.40 +0.40 Katter's Australian 2,268 0.23 +0.23 Rise Up Australia 1,191 0.12 +0.12 Australia First 1,116 0.11 +0.11 Socialist Alliance 980 0.10 +0.02 Democratic Labour 834 0.08 +0.08 Independents 12,834 1.28 +0.76 Total 1,005,445 11 Two-party-preferred vote Liberal/National Coalition 526,493 52.36 +5.54 6 Labor 478,952 47.64 –5.54 5
Labor to Liberal: Hindmarsh
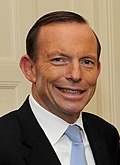
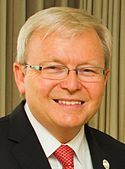
Tasmania 2013 Australian federal election First party Second party Leader Tony Abbott Kevin Rudd Party Liberal Labor Last election 0 seats 4 seats Seats won 3 seats 1 seat Seat change Popular vote 132,961 114,977 Percentage 40.26% 34.81% Swing TPP 48.77% 51.23% TPP swing
Electoral divisions: Tasmania Turnout 94.78% (CV ) — Informal 4.04% [ 9] Party Votes % Swing Seats Change Liberal 132,961 40.26 +6.66 3 Labor 114,977 34.81 –9.14 1 Greens 27,467 8.32 –8.50 Palmer United 20,026 6.06 +6.06 Family First 4,971 1.51 +1.51 Rise Up Australia 1,824 0.55 +0.55 Australian Christians 963 0.29 +0.29 Australian Sex Party 877 0.27 +0.27 Democratic Labour 554 0.17 +0.17 Katter's Australian 478 0.14 +0.14 Secular 384 0.12 –0.21 Stable Population 124 0.04 +0.04 Independents 24,688 7.47 +2.69 1 Total 330,294 5 Two-party-preferred vote Labor 169,208 51.23 –9.39 1 Liberal/National Coalition 161,086 48.77 +9.39 3
Independents: Andrew Wilkie
Labor to Liberal: Bass , Braddon , Lyons
Territories Australian Capital Territory 2013 Australian federal election First party Second party Leader Kevin Rudd Tony Abbott Party Labor Liberal Last election 2 seats 0 seats Seats won 2 seats 0 seats Seat change Popular vote 103,676 96,815 Percentage 42.93% 34.62% Swing TPP 59.91% 40.09% TPP swing
Turnout 94.59% (CV ) — Informal 3.83% [ 10] Party Votes % Swing Seats Change Labor 103,676 42.93 –2.09 2 Liberal 83,612 34.62 −0.19 0 Greens 32,356 13.40 –5.80 Bullet Train 9,855 4.08 +4.08 Palmer United 6,788 2.81 +2.81 Democrats 2,444 1.01 +1.01 Rise Up Australia 1,508 0.62 +0.62 Secular 1,264 0.52 −0.45 Total 241,503 2 Two-party-preferred vote Labor 144,688 59.91 –1.76 2 Liberal/National Coalition 96,815 40.09 +1.76 0
Northern Territory 2013 Australian federal election Electorate Results
Turnout 82.14% (CV ) — Informal 6.30% [ 11] Party Votes % Swing Seats Change Country Liberal 41,468 41.70 +0.87 1 Labor 37,221 37.43 –0.48 1 Greens 7,841 7.89 –5.08 Palmer United 4,609 4.63 +4.63 Citizens Electoral Council 1,856 1.87 −0.61 Australian Sex Party 1,847 1.86 +1.86 First Nations 1,810 1.82 +1.82 Rise Up Australia 1,444 1.45 +1.45 Voluntary Euthanasia 597 0.60 +0.60 Independents 748 0.75 −3.46 Total 99,441 2 Two-party-preferred vote Liberal/National Coalition 50,067 50.35 +1.09 1 Labor 49,374 49.65 –1.09 1
Two party preferred preference flow House of Representatives (IRV – votes Party Liberal National coalition Labor Party Votes %± Votes %± Greens 189,524 16.97% 927,394 83.03% One Nation 12,147 55.10% 9,899 44.90% United Australia Party 380,532 53.67% 328,503 46.33% Family First Party 106,063 58.33% 75,757 41.67% Liberal Democratic Party 3,752 79.56% 964 20.44% Christian Democratic Party 63,344 71.51% 25,232 28.49% Democratic Labour Party 15,700 43.51% 20,386 56.49% Rise Up Australia Party 29,262 60.23% 19,320 39.77% Australia First Party 4,427 59.73% 2,985 40.27% Animal Justice Party 594 31.63% 1,284 68.37% Katter's Australian 72,483 54.00% 61,743 46.00%
Australian Christians 29,769 70.05% 12,729 29.95% Citizens Electoral Council 5,136 49.38% 5,264 50.62% Socialist Alliance 956 19.00% 4,076 81.00% Australian Protectionist Party 790 73.22% – 289 26.78% – Australian Sex Party 29,360 37.37% 49,211 62.63% Stable Population Party 1,919 48.53% – 2,035 51.47% – Bullet Train for Australia 8,541 43.13% – 11,260 56.87% – Secular Party of Australia 1,440 29.79% 3,394 70.21 Australian Democrats 1,709 47.29% 1,905 52.71% Non-Custodial Parents Party 630 40.72% 917 59.28% – Future Party 399 33.99% 775 66.01% Senator Online 126 60.29% 83 39.71% Australian Sports Party 705 53.25% – 619 46.75% – Uniting Australia Party 212 54.92% – 174 45.08% – Voluntary Euthanasia Party 248 41.54% – 349 58.46% – Australian Voice Party 842 50.09% – 839 49.91% – Country Alliance 2,971 63.11% – 1,737 36.89% – Australia's First Nations Political Party 729 40.28% – 1,081 59.72% – Independents 76,032 42.90% 101,185 57.10%
Total 14,659,042 100.00 151 Two-party-preferred vote Liberal/National Coalition 6,908,710 53.49% Labor 6,006,217 46.51% Invalid/blank votes – – – Turnout – – – Registered voters – – – – – Source: AEC for both votes
References ↑ Members Elected , AEC ↑ Barber, Stephen (8 September 2014). "Federal Election 2013" (PDF) . Research Paper 2014–15 . Parliamentary Library. ISSN 2203-5249 . ↑ 2013 nationwide 2PP preference flows and 2010 flows : AEC ↑ First Preferences by Party – NSW , AEC ↑ First Preferences by Party – VIC , AEC ↑ First Preferences by Party - QLD , AEC ↑ First Preferences by Party - WA , AEC ↑ First Preferences by Party - SA , AEC ↑ First Preferences by Party - TAS , AEC ↑ First Preferences by Party - ACT , AEC ↑ First Preferences by Party - NT , AEC
This page is based on this
Wikipedia article Text is available under the
CC BY-SA 4.0 license; additional terms may apply.
Images, videos and audio are available under their respective licenses.


