Saffir–Simpson scale

Last updated

SSHWS redirects here.

Saffir–Simpson scale, 1-minute maximum sustained winds
Category m/s knots mph km/h
5≥ 70 ≥ 137≥ 157≥ 252
458–70113–136130–156209–251
350–5896–112111–129178–208
243–4983–9596–110154–177
133–4264–8274–95119–153
TS18–3234–6339–7363–118
TD≤ 17≤ 33≤ 38≤ 62

The Saffir–Simpson hurricane wind scale (SSHWS) classifies hurricanes—which in the Western Hemisphere are tropical cyclones that exceed the intensities of tropical depressions and tropical storms—into five categories distinguished by the intensities of their sustained winds. This measuring system was formerly known as the Saffir–Simpson hurricane scale, or SSHS.

Contents

To be classified as a hurricane, a tropical cyclone must have one-minute-average maximum sustained winds at 10 m above the surface of at least 74 mph (64 kn, 119 km/h; Category 1). [1] The highest classification in the scale, Category 5, consists of storms with sustained winds of at least 157 mph (137 kn, 252 km/h). The classifications can provide some indication of the potential damage and flooding a hurricane will cause upon landfall.

The Saffir–Simpson hurricane wind scale is based on the highest wind speed averaged over a one-minute interval 10 m above the surface. Although the scale shows wind speeds in continuous speed ranges, the US National Hurricane Center and the Central Pacific Hurricane Center assign tropical cyclone intensities in 5-knot (kn) increments (e.g., 100, 105, 110, 115 kn, etc.) because of the inherent uncertainty in estimating the strength of tropical cyclones. Wind speeds in knots are then converted to other units and rounded to the nearest 5 mph or 5 km/h. [2]

The Saffir–Simpson hurricane wind scale is used officially only to describe hurricanes that form in the Atlantic Ocean and northern Pacific Ocean east of the International Date Line. Other areas use different scales to label these storms, which are called cyclones or typhoons, depending on the area. These areas (except the JTWC) use three-minute or ten-minute averaged winds to determine the maximum sustained wind speed, creating an important difference which frustrates direct comparison between maximum wind speeds of storms measured using the Saffir–Simpson hurricane wind scale (usually 14% more intense) and those measured using a ten-minute interval (usually 12% less intense). [3]

There is some criticism of the SSHWS for not accounting for rain, storm surge, and other important factors, but SSHWS defenders say that part of the goal of SSHWS is to be straightforward and simple to understand. There have also been proposals for the addition of higher categories to the scale (which would then set a maximum cutoff for Category 5), but none have been adopted as of July 2024.

History

The scale was developed in 1971 by civil engineer Herbert Saffir and meteorologist Robert Simpson, who at the time was director of the U.S. National Hurricane Center (NHC). [4] The scale was introduced to the general public in 1973, [5] and saw widespread use after Neil Frank replaced Simpson at the helm of the NHC in 1974. [6]

The scale was created by Herbert Saffir, a structural engineer, who in 1969 was commissioned by the United Nations to study low-cost housing in hurricane-prone areas. [7] While conducting the study, Saffir realized there was no simple scale for describing the likely effects of a hurricane. Mirroring the utility of the Richter magnitude scale for describing earthquakes, he devised a 1–5 scale based on wind speed that showed expected damage to structures. Saffir gave the scale to the NHC, and Simpson added the effects of storm surge and flooding.

In 2009, the NHC eliminated pressure and storm surge ranges from the categories, transforming it into a pure wind scale, called the Saffir–Simpson Hurricane Wind Scale (Experimental) [SSHWS]. [8] The updated scale became operational on May 15, 2010. [9] The scale excludes flood ranges, storm surge estimations, rainfall, and location, which means a Category 2 hurricane that hits a major city will likely do far more cumulative damage than a Category 5 hurricane that hits a rural area. [10] The agency cited examples of hurricanes as reasons for removing "scientifically inaccurate" information, including Hurricane Katrina (2005) and Hurricane Ike (2008), which both had stronger than estimated storm surges, and Hurricane Charley (2004), which had weaker than estimated storm surge. [11] Since being removed from the Saffir–Simpson hurricane wind scale, storm surge prediction and modeling is handled by computer numerical models such as ADCIRC and SLOSH.

In 2012, the NHC expanded the windspeed range for Category 4 by 1 mph in both directions, to 130–156 mph, with corresponding changes in the other units (113–136 kn, 209–251 km/h), instead of 131–155 mph (114–135 kn, 210–249 km/h). The NHC and the Central Pacific Hurricane Center assign tropical cyclone intensities in 5 knot increments, and then convert to mph and km/h with a similar rounding for other reports. So an intensity of 115 kn is rated Category 4, but the conversion to miles per hour (132.3 mph) would round down to 130 mph, making it appear to be a Category 3 storm. Likewise, an intensity of 135 kn (~155 mph, and thus Category 4) is 250.02 km/h, which, according to the definition used before the change would be Category 5. To resolve these issues, the NHC had been obliged to incorrectly report storms with wind speeds of 115 kn as 135 mph, and 135 kn as 245 km/h. The change in definition allows storms of 115 kn to be correctly rounded down to 130 mph, and storms of 135 kn to be correctly reported as 250 km/h, and still qualify as Category 4. Since the NHC had previously rounded incorrectly to keep storms in Category 4 in each unit of measure, the change does not affect the classification of storms from previous years. [8] The new scale became operational on May 15, 2012. [12]

Categories

Saffir–Simpson scale
TDTSC1C2C3C4C5

The scale separates hurricanes into five different categories based on wind. The U.S. National Hurricane Center classifies hurricanes of Category 3 and above as major hurricanes, and the Joint Typhoon Warning Center classifies typhoons of 150 mph (240 km/h) or greater (strong Category 4 and Category 5) as super typhoons. Most weather agencies use the definition for sustained winds recommended by the World Meteorological Organization (WMO), which specifies measuring winds at a height of 33 ft (10.1 m) for 10 minutes, and then taking the average. By contrast, the U.S. National Weather Service, Central Pacific Hurricane Center and the Joint Typhoon Warning Center define sustained winds as average winds over a period of one minute, measured at the same 33 ft (10.1 m) height, [13] [14] and that is the definition used for this scale.

The five categories are described in the following subsections, in order of increasing intensity. [15] Intensity of example hurricanes is from both the time of landfall and the maximum intensity.

Category 1

Category 1
Sustained windsMost recent landfall
33–42 m/s
64–82 kn
119–153 km/h
74–95 mph
Debby 2024-08-05 0655Z.jpg Debby in 2024 at landfall in Florida

Very dangerous winds will produce some damage

Category 1 storms usually cause no significant structural damage to most well-constructed permanent structures; however, they can topple unanchored mobile homes, as well as uproot or snap weak trees. Poorly attached roof shingles or tiles can blow off. Coastal flooding and pier damage are often associated with Category 1 storms. Power outages are typically widespread to extensive, sometimes lasting several days. Even though it is the least intense type of hurricane, they can still produce widespread damage and can be life-threatening storms. [8]

Hurricanes that peaked at Category 1 intensity and made landfall at that intensity include: Juan (1985), Ismael (1995), Danny (1997), Stan (2005), Humberto (2007), Isaac (2012), Manuel (2013), Earl (2016), Newton (2016), Nate (2017), Barry (2019), Lorena (2019), Hanna (2020), Isaias (2020), Gamma (2020), Nicholas (2021), Pamela (2021), Julia (2022), Lisa (2022), Nicole (2022), and Debby (2024).

Category 2

Category 2
Sustained windsMost recent landfall
43–49 m/s
83–95 kn
154–177 km/h
96–110 mph
Francine 2024-09-11 1746Z.jpg
Francine in 2024 at landfall near Morgan City, Louisiana

Extremely dangerous winds will cause extensive damage

Storms of Category 2 intensity often damage roofing material (sometimes exposing the roof) and inflict damage upon poorly constructed doors and windows. Poorly constructed signs and piers can receive considerable damage and many trees are uprooted or snapped. Mobile homes, whether anchored or not, are typically damaged and sometimes destroyed, and many manufactured homes also suffer structural damage. Small craft in unprotected anchorages may break their moorings. Extensive to near-total power outages and scattered loss of potable water are likely, possibly lasting many days. [8]

Hurricanes that peaked at Category 2 intensity and made landfall at that intensity include: Alice (1954), Ella (1958), Ginny (1963), Fifi (1974), Diana (1990), Gert (1993), Rosa (1994), Erin (1995), Alma (1996), Marty (2003), Juan (2003), Alex (2010), Richard (2010), Tomas (2010), Carlotta (2012), Arthur (2014), Sally (2020), Olaf (2021), Rick (2021), Agatha (2022), and Francine (2024).

Category 3

Category 3
Sustained windsMost recent landfall
50–58 m/s
96–112 kn
178–208 km/h
111–129 mph
Grace 2021-08-21 0610Z.jpg
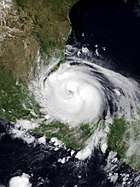
Grace in 2021 just prior to its Veracruz landfall

Devastating damage will occur

Tropical cyclones of Category 3 and higher are described as major hurricanes in the Atlantic, Eastern Pacific, and Central Pacific basins. These storms can cause some structural damage to small residences and utility buildings, particularly those of wood frame or manufactured materials with minor curtain wall failures. Buildings that lack a solid foundation, such as mobile homes, are usually destroyed, and gable-end roofs are peeled off. Manufactured homes usually sustain severe and irreparable damage. Flooding near the coast destroys smaller structures, while larger structures are struck by floating debris. A large number of trees are uprooted or snapped, isolating many areas. Additionally, terrain may be flooded well inland. Near-total to total power loss is likely for up to several weeks and water will likely also be lost or contaminated. [8]

Hurricanes that peaked at Category 3 intensity and made landfall at that intensity include: Easy (1950), Carol (1954), Hilda (1955), Audrey (1957), Olivia (1967), Ella (1970), Caroline (1975), Eloise (1975), Olivia (1975), Alicia (1983), Elena (1985), Roxanne (1995), Fran (1996), Isidore (2002), Jeanne (2004), Lane (2006), Karl (2010),Otto (2016), Zeta (2020), and Grace (2021).

Category 4

Category 4
Sustained windsMost recent landfall
58–70 m/s
113–136 kn
209–251 km/h
130–156 mph
Lidia 2023-10-10 2120Z.jpg Lidia in 2023 just prior to its Jalisco landfall

Catastrophic damage will occur

Category 4 hurricanes tend to produce more extensive curtainwall failures, with some complete structural failure on small residences. Heavy, irreparable damage and near-complete destruction of gas station canopies and other wide span overhang type structures are common. Mobile and manufactured homes are often flattened. Most trees, except for the hardiest, are uprooted or snapped, isolating many areas. These storms cause extensive beach erosion, while terrain may be flooded far inland. Total and long-lived electrical and water losses are to be expected, possibly for many weeks. [8]

The 1900 Galveston hurricane, the deadliest natural disaster to hit the United States, peaked at an intensity that corresponds to a modern-day Category 4 storm. Other examples of storms that peaked at Category 4 intensity and made landfall at that intensity include: Hazel (1954), Gracie (1959), Donna (1960), Carla (1961), Flora (1963), Betsy (1965), Celia (1970),Carmen (1974) Madeline (1976), Frederic (1979), Joan (1988), Iniki (1992), Charley (2004), Dennis (2005), Ike (2008), Harvey (2017), Laura (2020), Eta (2020), Iota (2020), Ida (2021), and Lidia (2023).

Category 5

Category 5
Sustained windsMost recent landfall
≥ 70 m/s
≥ 137 kn
≥ 252 km/h
≥ 157 mph
Otis 2023-10-25 0431Z.png 
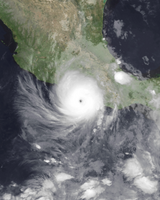
Otis in 2023 nearing its landfall in Acapulco, Mexico

Catastrophic damage will occur

Category 5 is the highest category of the Saffir–Simpson scale. These storms cause complete roof failure on many residences and industrial buildings, and some complete building failures with small utility buildings blown over or away. The collapse of many wide-span roofs and walls, especially those with no interior supports, is common. Very heavy and irreparable damage to many wood-frame structures and total destruction to mobile/manufactured homes is prevalent. Only a few types of structures are capable of surviving intact, and only if located at least 3 to 5 miles (5 to 8 km) inland. They include office, condominium and apartment buildings and hotels that are of solid concrete or steel frame construction, multi-story concrete parking garages, and residences that are made of either reinforced brick or concrete/cement block and have hipped roofs with slopes of no less than 35 degrees from horizontal and no overhangs of any kind, and if the windows are either made of hurricane-resistant safety glass or covered with shutters. Unless most of these requirements are met, the catastrophic destruction of a structure may occur. [8]

The storm's flooding causes major damage to the lower floors of all structures near the shoreline, and many coastal structures can be completely flattened or washed away by the storm surge. Virtually all trees are uprooted or snapped and some may be debarked, isolating most affected communities. Massive evacuation of residential areas may be required if the hurricane threatens populated areas. Total and extremely long-lived power outages and water losses are to be expected, possibly for up to several months. [8]

Historical examples of storms that made landfall at Category 5 status include: "Cuba" (1924), "Okeechobee" (1928), "Bahamas" (1932), "Cuba–Brownsville" (1933), "Labor Day" (1935), Janet (1955), Inez (1966), Camille (1969), Edith (1971), Anita (1977), David (1979), Gilbert (1988), Andrew (1992), Dean (2007), Felix (2007), Irma (2017), [16] Maria (2017), [17] Michael (2018), [18] Dorian (2019), and Otis (2023) (the only Pacific hurricane to make landfall at Category 5 intensity).

Criticism

Some scientists, including Kerry Emanuel and Lakshmi Kantha, have criticized the scale as being too simplistic, namely that the scale takes into account neither the physical size of a storm nor the amount of precipitation it produces. [10] Additionally, they and others point out that the Saffir–Simpson scale, unlike the moment magnitude scale used to measure earthquakes, is not continuous, and is quantized into a small number of categories. Proposed replacement classifications include the Hurricane Intensity Index, which is based on the dynamic pressure caused by a storm's winds, and the Hurricane Hazard Index, which is based on surface wind speeds, the radius of maximum winds of the storm, and its translational velocity. [19] [20] Both of these scales are continuous, akin to the Richter scale; [21] however, neither of these scales have been used by officials.[ citation needed ]

Proposed extensions

After the series of powerful storm systems of the 2005 Atlantic hurricane season, as well as after Hurricane Patricia, a few newspaper columnists and scientists brought up the suggestion of introducing Category 6, and they have suggested pegging Category 6 to storms with winds greater than 174 or 180 mph (78 or 80 m/s; 151 or 156 kn; 280 or 290 km/h). [10] [22] Fresh calls were made for consideration of the issue after Hurricane Irma in 2017, [23] which was the subject of a number of seemingly credible false news reports as a "Category 6" storm, [24] partly in consequence of so many local politicians using the term. Only a few storms of this intensity have been recorded. Of the 41 hurricanes currently considered to have attained Category 5 status in the Atlantic, 18 had wind speeds at 175 mph (78 m/s; 152 kn; 282 km/h) or greater and only 8 had wind speeds at 180 mph (80.5 m/s; 156 kn; 290 km/h) or greater (the 1935 Labor Day hurricane, Allen, Gilbert, Mitch, Rita, Wilma, Irma, and Dorian). Of the 20 hurricanes currently considered to have attained Category 5 status in the eastern Pacific, only 5 had wind speeds at 175 mph (78 m/s; 152 kn; 282 km/h) or greater (Patsy, John, Linda, Rick, and Patricia), and only 3 had wind speeds at 180 mph (80.5 m/s; 156 kn; 290 km/h) or greater (Linda, Rick, and Patricia). Most storms which would be eligible for this category were typhoons in the western Pacific, most notably typhoons Tip, Halong, Mawar, and Bolaven in 1979, 2019, 2023 and 2023 respectively, each with sustained winds of 190 mph (305 km/h), [25] and typhoons Haiyan, Meranti, Goni, and Surigae in 2013, 2016, 2020 and 2021 respectively, each with sustained winds of 195 mph (315 km/h). Occasionally, suggestions of using even higher wind speeds as the cutoff have been made. In a newspaper article published in November 2018, NOAA research scientist Jim Kossin said that the potential for more intense hurricanes was increasing as the climate warmed, and suggested that Category 6 would begin at 195 mph (85 m/s; 170 kn; 315 km/h), with a further hypothetical Category 7 beginning at 230 mph (105 m/s; 200 kn; 370 km/h). [26] In 2024 another proposal to add "Category 6" was made, with a minimum wind speed of 192 mph (309 km/h), with risk factors such as the effects of climate change and warming ocean temperatures part of that research. [27] In the NHC area of responsibility, only Patricia had winds greater than 190 mph (85 m/s; 165 kn; 305 km/h).

According to Robert Simpson, co-creator of the scale, there are no reasons for a Category 6 on the Saffir–Simpson scale because it is designed to measure the potential damage of a hurricane to human-made structures. Simpson explained that "... when you get up into winds in excess of 155 mph (249 km/h) you have enough damage if that extreme wind sustains itself for as much as six seconds on a building it's going to cause rupturing damages that are serious no matter how well it's engineered." [6] Nonetheless, the counties of Broward and Miami-Dade in Florida have building codes which require that critical infrastructure buildings be able to withstand Category 5 winds. [28]

See also

Related Research Articles

<span class="mw-page-title-main">Typhoon Tip</span> Pacific typhoon in 1979

Typhoon Tip, known in the Philippines as Super Typhoon Warling, was a large, extremely powerful, and long-lived tropical cyclone that traversed the Western Pacific for 20 days. The forty-third tropical depression, nineteenth tropical storm, twelfth typhoon, and third super typhoon of the 1979 Pacific typhoon season, Tip developed out of a disturbance within the monsoon trough on October 4 near Pohnpei in Micronesia. Initially, Tropical Storm Roger to the northwest hindered the development and motion of Tip, though after the storm tracked farther north, Tip was able to intensify. After passing Guam, Tip rapidly intensified and reached peak sustained winds of 305 km/h (190 mph) and a worldwide record-low sea-level pressure of 870 hPa (25.69 inHg) on October 12. At its peak intensity, Tip was the largest tropical cyclone on record, with a wind diameter of 2,220 km (1,380 mi). Tip slowly weakened as it continued west-northwestward and later turned to the northeast, in response to an approaching trough. The typhoon made landfall in southern Japan on October 19, and became an extratropical cyclone shortly thereafter. Tip's extratropical remnants continued moving east-northeastward, until they dissipated near the Aleutian Islands on October 24.

<span class="mw-page-title-main">1971 Pacific hurricane season</span>

The 1971 Pacific hurricane season began on May 15, 1971 in the eastern Pacific, and on June 1, 1971 in the Central Pacific ; both ended on November 30, 1971. These dates, adopted by convention, historically describe the period in each year when most tropical cyclogenesis occurs in these regions of the Pacific. It was the first year that continuous Weather satellite coverage existed over the entire Central Pacific. As such, this season is often viewed as the start year for modern reliable tropical cyclone data in the Pacific Ocean.

<span class="mw-page-title-main">Tropical cyclone scales</span> Scales of the intensity of tropical cyclones

Tropical cyclones are ranked on one of five tropical cyclone intensity scales, according to their maximum sustained winds and which tropical cyclone basins they are located in. Only a few classifications are used officially by the meteorological agencies monitoring the tropical cyclones, but other scales also exist, such as accumulated cyclone energy, the Power Dissipation Index, the Integrated Kinetic Energy Index, and the Hurricane Severity Index.

<span class="mw-page-title-main">Typhoon Nancy (1961)</span> Pacific typhoon in 1961

Super Typhoon Nancy, also known as the 2nd Muroto Typhoon, was an extremely powerful tropical cyclone of the 1961 Pacific typhoon season and one of the most intense tropical cyclones on record. The system possibly had the strongest winds ever measured in a tropical cyclone, with 345 km/h (215 mph) winds, tied with Hurricane Patricia of 2015. Nancy caused extensive damage, as well as at least 202 deaths and nearly 5,000 injuries in Japan and elsewhere, in September 1961.

<span class="mw-page-title-main">Typhoon Rose (1971)</span> Pacific typhoon in 1971

Typhoon Rose, known in the Philippines as Typhoon Uring, was the most violent and intense tropical cyclone to strike Hong Kong since Typhoon Wanda in 1962. The 21st named storm of the 1971 Pacific typhoon season, Rose developed from an area of disturbed weather while west of Guam on August 9. Moving west-northwestward, the storm briefly became a typhoon on the following day. After weakening to a tropical storm on August 11, Rose re-intensified into a typhoon several hours later. The system then curved westward and reached a primary peak intensity with winds of 205 km/h (127 mph) on August 13. Later that day, the typhoon made landfall near Palanan, Isabela in the Philippines. Rose weakened significantly while crossing the island of Luzon and was a minimal typhoon upon reaching the South China Sea on August 14.

<span class="mw-page-title-main">Tropical cyclone wind speed climatology</span>

Tropical cyclone wind speed climatology is the study of wind distribution among tropical cyclones, a significant threat to land and people. Since records began in 1851, winds from hurricanes, typhoons and cyclones have been responsible for fatalities and damage in every basin. Major hurricanes usually cause the most wind damage. Hurricane Andrew for example caused $45 billion in damage, most of it wind damage.

The maximum sustained wind associated with a tropical cyclone is a common indicator of the intensity of the storm. Within a mature tropical cyclone, it is found within the eyewall at a distance defined as the radius of maximum wind, or RMW. Unlike gusts, the value of these winds are determined via their sampling and averaging the sampled results over a period of time. Wind measuring has been standardized globally to reflect the winds at 10 metres (33 ft) above mean sea level, and the maximum sustained wind represents the highest average wind over either a one-minute (US) or ten-minute time span, anywhere within the tropical cyclone. Surface winds are highly variable due to friction between the atmosphere and the Earth's surface, as well as near hills and mountains over land.

<span class="mw-page-title-main">Cyclone Orson</span> Category 5 Australian region cyclone in 1989

Severe Tropical Cyclone Orson was the fourth most intense cyclone ever recorded in the Australian region. Forming out of a tropical low on 17 April 1989, Orson gradually intensified as it tracked towards the west. After attaining Category 5 intensity on 20 April, the storm began to track southward and accelerated. The following day, the cyclone reached its peak intensity with winds of 250 km/h (160 mph) and a barometric pressure of 904 hPa (mbar). Orson maintained this intensity for nearly two days before making landfall near Dampier. The cyclone rapidly weakened after landfall as it accelerated to the southeast. After moving into the Great Australian Bight on 24 April, the storm dissipated.

<span class="mw-page-title-main">Typhoon Elsie (1989)</span> Pacific typhoon in 1989

Typhoon Elsie, known in the Philippines as Typhoon Tasing, was one of the most intense known tropical cyclones to make landfall in the Philippines. A powerful Category 5 super typhoon, Elsie formed out of a tropical disturbance on October 13, 1989, and initially moved relatively slowly in an area of weak steering currents. On October 15, the storm underwent a period of rapid intensification, attaining an intensity that corresponds to a Category 3 hurricane on the Saffir–Simpson hurricane scale. After taking a due west track towards the northern Philippines, the storm intensified further, becoming a Category 5 super typhoon hours before making landfall in Luzon. After moving inland, the typhoon rapidly weakened to a tropical storm. Once back over water in the South China Sea, wind shear prevented re-intensifcation. Elsie eventually made landfall in Vietnam on October 22 and dissipated the following day over Laos.

<span class="mw-page-title-main">Cyclone Gwenda</span> Category 5 Australian region cyclone in 1999

Severe Tropical Cyclone Gwenda is tied with Cyclone Inigo as the most intense Australian tropical cyclone on record, with a barometric pressure of 900 hPa (mbar) and was the most intense storm worldwide in 1999. Forming out of a tropical disturbance over the Arafura Sea on 2 April 1999, the precursor to Gwenda tracked slowly westward and gradually became more organised. On 4 April, the system developed into a Category 1 cyclone and was named Gwenda. It began to undergo explosive intensification the following day, and in a 30-hour span ending early on 7 April, the storm's maximum 10-minute sustained wind speed increased from 75 to 225 km/h and its barometric pressure decreased to 900 hPa (mbar). The Joint Typhoon Warning Center reported that the storm had peaked as a high-end Category 4 equivalent on the Saffir–Simpson hurricane scale.

<span class="mw-page-title-main">Tropical cyclones in 2010</span>

During 2010, tropical cyclones formed within seven different tropical cyclone basins, located within various parts of the Atlantic, Pacific and Indian Oceans. During the year, a total of 111 tropical cyclones developed, with 64 of them being named by either a Regional Specialized Meteorological Center (RSMC) or a Tropical Cyclone Warning Center (TCWC). The most active basin was the North Atlantic, which documented 19 named systems, while the North Indian Ocean, despite only amounting to five named systems, was its basin's most active since 1998. Conversely, both the West Pacific typhoon and East Pacific hurricane seasons experienced the fewest cyclones reaching tropical storm intensity in recorded history, numbering 14 and 8, respectively. Activity across the southern hemisphere's three basins—South-West Indian, Australian, and South Pacific—was spread evenly, with each region recording 7 named storms apiece. The southern hemisphere's strongest tropical cyclone was Cyclone Edzani, which bottomed out with a barometric pressure of 910 mbar in the South-West Indian Ocean. Nineteen Category 3 tropical cyclones formed, including four Category 5 tropical cyclones in the year. The accumulated cyclone energy (ACE) index for the 2010, as calculated by Colorado State University was 573.8 units.

<span class="mw-page-title-main">Glossary of tropical cyclone terms</span>

The following is a glossary of tropical cyclone terms.

<span class="mw-page-title-main">Typhoon Andy (1982)</span> Pacific typhoon in 1982

Typhoon Andy, known in the Philippines as Typhoon Iliang, was an intense tropical cyclone that made landfall in Taiwan. Andy formed along the northern edge of the monsoon trough south of Guam on July 22, 1982. It became a tropical storm the next day, although this system was initially poorly organized. Andy moved steadily west during the first few days of its life. After looping south of Guam, the cyclone moved northwest and strengthened. Andy turned westward near the 18th parallel on July 25. The system became a strong typhoon for a prolonged period on July 27 and July 28 while attaining a peak intensity of 185 km/h (115 mph). However, the typhoon struck Southern Taiwan on July 29. Continuing westward through the Formosa Strait, the storm made its final landfall in southern China on July 30 and dissipated inland two days later.

<span class="mw-page-title-main">1984–85 South Pacific cyclone season</span> Tropical cyclone season

The 1984–85 South Pacific cyclone season was an above-average tropical cyclone season, with nine tropical cyclones occurring within the basin between 160°E and 120°W. The season ran from November 1, 1984, to April 30, 1985, with tropical cyclones officially monitored by the Fiji Meteorological Service (FMS), Australian Bureau of Meteorology (BoM) and New Zealand's MetService. The United States Joint Typhoon Warning Center (JTWC) and other national meteorological services including Météo-France and NOAA also monitored the basin during the season. During the season there was nine tropical cyclones occurring within the basin, including three that moved into the basin from the Australian region. The BoM, MetService and RSMC Nadi all estimated sustained wind speeds over a period of 10-minutes, which are subsequently compared to the Australian tropical cyclone intensity scale, while the JTWC estimated sustained winds over a 1-minute period, which are subsequently compared to the Saffir–Simpson hurricane wind scale (SSHWS).

<span class="mw-page-title-main">Typhoon Nancy (1982)</span> Pacific typhoon in 1982

Typhoon Nancy, known in the Philippines as Typhoon Weling, was a destructive typhoon that moved through Vietnam and the Philippines during October 1982. The typhoon originated from an area of convection and was first classified as a tropical cyclone on October 10. The system attained gale-force winds the next day, and slowly deepened thereafter. Although Nancy initially moved west, the system maintained a general westward course for much of its duration, striking Luzon on October 14 at peak intensity of 215 km/h (130 mph). It weakened to tropical storm strength overland, but re-intensified to typhoon intensity over the South China Sea. Nancy hit northern Vietnam on the October 18, and weakened almost immediately thereafter, before dissipating on October 20 inland over Vietnam.

The 1888 Louisiana hurricane was a major hurricane that caused significant flooding and wind damage to the Mississippi River Delta and the Mississippi Valley in late August 1888. It was the third tropical cyclone and second hurricane of the 1888 Atlantic hurricane season.

<span class="mw-page-title-main">Cyclone Ernie</span> Category 5 Australian region cyclone in 2017

Severe Tropical Cyclone Ernie was one of the quickest strengthening tropical cyclones on record. Ernie was the first Category 5 severe tropical cyclone in the Australian region since Cyclone Marcia in 2015, and also the strongest tropical cyclone in the Australian region since Cyclone Ita in 2014. Ernie developed from a tropical low into a cyclone south of Indonesia in the northeast Indian Ocean on 6 April 2017, and proceeded to intensify extremely rapidly to a Category 5 severe tropical cyclone. A few days later, on 10 April, the system was downgraded below cyclone intensity following a period of rapid weakening, located southwest of its original position. Ernie had no known impacts on any land areas.

<span class="mw-page-title-main">Meteorological history of Hurricane Dorian</span>

Hurricane Dorian was the strongest hurricane to affect The Bahamas on record, causing catastrophic damage on the islands of Abaco Islands and Grand Bahama, in early September 2019. The cyclone's intensity, as well as its slow forward motion near The Bahamas, broke numerous records. The fifth tropical cyclone, fourth named storm, second hurricane, and first major hurricane of the 2019 Atlantic hurricane season, Dorian originated from a westward-traveling tropical wave, that departed from the western coast of Africa on August 19. The system organized into a tropical depression and later a tropical storm, both on August 24.

<span class="mw-page-title-main">Cyclone Ilsa</span> Category 5 Australian region cyclone in 2023

Severe Tropical Cyclone Ilsa was a powerful tropical cyclone that struck Western Australia in April 2023. The sixth named storm, and the fifth severe tropical cyclone of the 2022–23 Australian region cyclone season, Ilsa formed from a tropical low off the coast of Indonesia on 6 April. It fluctuated in intensity and became a Category 1 tropical cyclone on 11 April, after deep convection became symmetric around the low-level circulation center. Ilsa then rapidly intensified the following day and reached its peak intensity as a Category 5 severe tropical cyclone on the Australian tropical cyclone intensity scale. Ten-minute sustained winds were estimated as 230 km/h (145 mph), with a central barometric pressure of 915 hPa (27.02 inHg). One-minute sustained winds reached 260 km/h (160 mph) at this time, equivalent to a Category 5 hurricane on the Saffir–Simpson hurricane wind scale. Additionally, record-breaking ten-minute sustained wind speed of 219 km/h (136 mph) were measured at Bedout Island, beating the previous record of Cyclone George in 2007. Ilsa made landfall roughly 120 km (75 mi) northeast of Port Hedland, Western Australia. Inland, Ilsa weakened to a low-end tropical cyclone with 85 km/h (50 mph) winds. Overall, Ilsa caused around A$4 million in damage, and caused 8 deaths after two boats capsized off the coast of Western Australia.

References

  1. "Saffir-Simpson Hurricane Wind Scale". National Hurricane Center. 2018. Retrieved November 14, 2020.
  2. "Minor Modification to Saffir-Simpson Hurricane Wind Scale For the 2012 Hurricane Season" (PDF). National Hurricane Center. 2012. Retrieved November 14, 2020.
  3. United States Navy: "Section 2. Intensity Observations and Forecast Errors". Archived from the original on September 16, 2007. Retrieved July 4, 2008. For US Navy interests, the factor 0.88 is used in going from a 1-minute system to a 10-minute system such that TEN-MINUTE MEAN = 0.88 * ONE-MINUTE MEAN or ONE-MINUTE MEAN = 1.14 * TEN-MINUTE MEAN. Retrieved on 2018-10-07.
  4. Williams, Jack (May 17, 2005). "Hurricane scale invented to communicate storm danger". USA Today . Retrieved February 25, 2007.
  5. Staff writer (May 9, 1973). "'73, Hurricanes to be Graded". Associated Press. Archived from the original on May 19, 2016. Retrieved December 8, 2007.
  6. 1 2 Debi Iacovelli (July 2001). "The Saffir/Simpson Hurricane Scale: An Interview with Dr. Robert Simpson". Sun-Sentinel . Fort Lauderdale, FL. Archived from the original on October 23, 2009. Retrieved September 10, 2006.
  7. Press Writer (August 23, 2001). "Hurricanes shaped life of scale inventor". Archived from the original on April 17, 2016. Retrieved March 20, 2016.
  8. 1 2 3 4 5 6 7 8 The Saffir–Simpson Hurricane Wind Scale National Hurricane Center. Accessed 2009-05-15.
  9. National Hurricane Operations Plan Archived July 8, 2011, at the Wayback Machine , NOAA. Accessed July 3, 2010.
  10. 1 2 3 Ker Than (October 20, 2005). "Wilma's Rage Suggests New Hurricane Categories Needed". LiveScience . Retrieved October 20, 2005.
  11. "Experimental Saffir–Simpson Hurricane Wind Scale" (PDF). National Hurricane Center. 2009. Archived from the original (PDF) on August 6, 2009. Retrieved August 17, 2009.
  12. Public Information Statement, NOAA. Accessed March 9, 2012.
  13. Tropical Cyclone Weather Services Program (June 1, 2006). "Tropical cyclone definitions" (PDF). National Weather Service. Retrieved November 30, 2006.
  14. Federal Emergency Management Agency (2004). "Hurricane Glossary of Terms". Archived from the original on December 14, 2005. Retrieved March 24, 2006. Accessed through the Wayback Machine.
  15. "Name That Hurricane: Famous Examples of the 5 Hurricane Categories". Live Science. Retrieved September 11, 2017.
  16. "Famous Hurricanes of the 20th and 21st Century in the United States" (PDF). www.weather.gov/crh/.
  17. Blake, Eric (September 20, 2017). Hurricane Maria Tropical Cyclone Update (Report). Miami, Florida: National Hurricane Center. Retrieved September 20, 2017.
  18. John L. Beven II; Robbie Berg; Andrew Hagen (April 19, 2019). Tropical Cyclone Report: Hurricane Michael (PDF) (Technical report). National Hurricane Center. Retrieved April 19, 2019.
  19. Kantha, L. (January 2006). "Time to Replace the Saffir–Simpson Hurricane Scale?". Eos . 87 (1): 3, 6. Bibcode:2006EOSTr..87....3K. doi: 10.1029/2006eo010003 .
  20. Kantha, Lakshmi (February 2008). "Tropical Cyclone Destructive Potential by Integrated Kinetic Energy". Bulletin of the American Meteorological Society . 89 (2): 219–221. Bibcode:2008BAMS...89..219K. CiteSeerX   10.1.1.693.5083 . doi:10.1175/BAMS-89-2-219.
  21. Benfield Hazard Research Centre (2006). "Atmospheric Hazards". Hazard & Risk Science Review 2006. University College London. Archived from the original on 7 August 2008. Retrieved 8 December 2007.
  22. Bill Blakemore (May 21, 2006). "Category 6 Hurricanes? They've Happened: Global Warming Winds Up Hurricane Scientists as NOAA Issues Its Atlantic Hurricane Predictions for Summer 2006". ABC News . Retrieved September 10, 2006.
  23. "Climate scientists mull Category 6 storm classification, report says". ABC News. February 22, 2018.
  24. "Hurricane Irma: Will Irma become world's first CATEGORY 6 hurricane with 200mph winds?". Daily Express . September 5, 2017.
  25. Debi Iacovelli and Tim Vasquez (1998). "Supertyphoon Tip: Shattering all records" (PDF). Monthly Weather Log. National Oceanic and Atmospheric Administration. Retrieved September 19, 2010.
  26. "Category 6? Scientists warn hurricanes could keep getting stronger". Tampa Bay Times. November 30, 2018. Retrieved November 30, 2018.
  27. Wehner, Michael F.; Kossin, James P. (2024). "The growing inadequacy of an open-ended Saffir–Simpson hurricane wind scale in a warming world". PNAS. Vol. 121, no. 7. doi:10.1073/pnas.2308901121 . Retrieved February 5, 2024.
  28. Jennifer Kay (September 2017). "Irma could test strength of Florida's strict building codes". The Washington Post . Washington, DC. Archived from the original on September 17, 2017. Retrieved September 16, 2017.