List of Colorado statistical areas

Last updated
An enlargeable map of the 17 core-based statistical areas in the State of Colorado. Colorado CBSAs 2020.png
An enlargeable map of the 17 core-based statistical areas in the State of Colorado.

The U.S. State of Colorado currently has 21 statistical areas that have been delineated by the Office of Management and Budget (OMB). On March 6, 2020, the OMB delineated four combined statistical areas, seven metropolitan statistical areas, and ten micropolitan statistical areas in Colorado. [1] The most populous of these statistical areas is the Denver–Aurora, CO Combined Statistical Area with a 2020 Census population of 3,623,560. [2]

Contents

Statistical areas

The Office of Management and Budget (OMB) has designated more than 1,000 statistical areas for the United States and Puerto Rico. [3] These statistical areas are important geographic delineations of population clusters used by the OMB, the United States Census Bureau, planning organizations, and federal, state, and local government entities.

The OMB defines a core-based statistical area (commonly referred to as a CBSA) as "a statistical geographic entity consisting of the county or counties (or county-equivalents) associated with at least one core [lower-alpha 1] of at least 10,000 population, plus adjacent counties having a high degree of social and economic integration with the core as measured through commuting ties with the counties containing the core." [3] The OMB further divides core-based statistical areas into metropolitan statistical areas (MSAs) that have "a population of at least 50,000" and micropolitan statistical areas (μSAs) that have "a population of at least 10,000, but less than 50,000." [3]

The OMB defines a combined statistical area (CSA) as "a geographic entity consisting of two or more adjacent core-based statistical areas with employment interchange measures [lower-alpha 2] of at least 15%." [3] The primary statistical areas (PSAs) include all combined statistical areas and any core-based statistical area that is not a constituent of a combined statistical area.

Table of counties and statistical areas

The following table displays the 2020 Census population of all 64 counties and 21 statistical areas of Colorado. This table is initially sorted by (1) the most populous primary statistical area, then by (2) the most populous core-based statistical area, and finally by (3) the most populous county.

The 64 counties and 21 statistical areas of the State of Colorado

County [4] 2020 Census [2] Core-based statistical area [1] 2020 Census [2] Combined statistical area [1] 2020 Census [2]
City and County of Denver 715,522 Denver-Aurora-Lakewood, CO Metropolitan Statistical Area 2,963,821 Denver–Aurora, CO Combined Statistical Area 3,623,560
Arapahoe County 655,070
Jefferson County 582,910
Adams County 519,572
Douglas County 357,978
City and County of Broomfield 74,112
Elbert County 26,062
Park County 17,390
Clear Creek County 9,397
Gilpin County 5,808
Boulder County 330,758 Boulder, CO Metropolitan Statistical Area 330,758
Weld County 328,981 Greeley, CO Metropolitan Statistical Area 328,981
El Paso County 730,395 Colorado Springs, CO Metropolitan Statistical Area 755,105none
Teller County 24,710
Larimer County 359,066 Fort Collins, CO Metropolitan Statistical Area 359,066
Pueblo County 168,162 Pueblo, CO Metropolitan Statistical Area 168,162 Pueblo-Cañon City, CO Combined Statistical Area 217,101
Fremont County 48,939 Cañon City, CO Micropolitan Statistical Area 48,939
Mesa County 155,703 Grand Junction, CO Metropolitan Statistical Area 155,703none
Garfield County 61,685 Glenwood Springs, CO Micropolitan Statistical Area [lower-alpha 3] 79,043 Edwards-Glenwood Springs, CO Combined Statistical Area 134,774
Pitkin County 17,358
Eagle County 55,731 Edwards, CO Micropolitan Statistical Area [lower-alpha 3] 55,731
La Plata County 55,638 Durango, CO Micropolitan Statistical Area [lower-alpha 3] 55,638none
Montrose County 42,679 Montrose, CO Micropolitan Statistical Area 47,553
Ouray County 4,874
Routt County 24,829 Steamboat Springs, CO Micropolitan Statistical Area 24,829 Steamboat Springs-Craig, CO Combined Statistical Area 38,121
Moffat County 13,292 Craig, CO Micropolitan Statistical Area 13,292
Delta County 31,196nonenone
Summit County 31,055 Breckenridge, CO Micropolitan Statistical Area 31,055
Morgan County 29,111 Fort Morgan, CO Micropolitan Statistical Area 29,111
Montezuma County 25,849none
Logan County 21,528 Sterling, CO Micropolitan Statistical Area 21,528
Chaffee County 19,476none
Otero County 18,690
Gunnison County 16,918
Alamosa County 16,376
Grand County 15,717
Las Animas County 14,555
Archuleta County 13,359
Prowers County 11,999
Rio Grande County 11,539
Yuma County 9,988
San Miguel County 8,072
Conejos County 7,461
Lake County 7,436
Kit Carson County 7,087
Huerfano County 6,820
Rio Blanco County 6,529
Saguache County 6,368
Crowley County 5,922
Lincoln County 5,675
Bent County 5,650
Washington County 4,817
Custer County 4,704
Phillips County 4,530
Baca County 3,506
Costilla County 3,499
Sedgwick County 2,404
Dolores County 2,326
Cheyenne County 1,748
Kiowa County 1,446
Jackson County 1,379
Mineral County 865
Hinsdale County 788
San Juan County 705
All 64 counties5,773,714The 17 core-based statistical areas5,468,315The 4 combined statistical areas4,013,556

Table of primary statistical areas

Of the 21 statistical areas of Colorado, 12 are primary statistical areas comprising four combined statistical areas, three metropolitan statistical areas, and five micropolitan statistical areas. The following table shows the population trends in these areas.

The 12 primary statistical areas of the State of Colorado

2020 rank [2] Primary statistical area [1] Population [2]
2020 Census Change 2010 Census Change 2000 Census
1 Denver–Aurora, CO Combined Statistical Area 3,623,560+17.23%3,090,874+17.52%2,629,980
2 Colorado Springs, CO Metropolitan Statistical Area 755,105+16.96%645,613+20.12%537,489
3 Fort Collins, CO Metropolitan Statistical Area 359,066+19.84%299,630+19.14%251,494
4 Pueblo-Cañon City, CO Combined Statistical Area 217,101+5.45%205,887+9.73%187,635
5 Grand Junction, CO Metropolitan Statistical Area 155,703+6.12%146,723+26.21%116,255
6 Edwards-Glenwood Springs, CO Combined Statistical Area 134,774+7.19%125,734+25.36%100,298
7 Durango, CO Micropolitan Statistical Area [lower-alpha 3] 55,638+8.38%51,334+16.82%43,941
8 Montrose, CO Micropolitan Statistical Area 47,553+4.03%45,712+22.93%37,185
9 Steamboat Springs-Craig, CO Combined Statistical Area 38,121+2.19%37,304+13.53%32,857
10 Breckenridge, CO Micropolitan Statistical Area 31,055+10.93%27,994+18.88%23,548
11 Fort Morgan, CO Micropolitan Statistical Area 29,111+3.38%28,159+3.64%27,171
12 Sterling, CO Micropolitan Statistical Area 21,528−5.20%22,709+10.75%20,504
TotalThe 12 primary statistical areas5,468,315+15.67%4,727,673+17.95%4,008,357

See also

Notes

  1. The OMB defines a core as "a densely settled concentration of population, comprising an Urban Area (of 10,000 or more population) delineated by the Census Bureau, around which a core-based statistical area is delineated." [3]
  2. The OMB defines the employment interchange measure as "the sum of the percentage of workers living in the smaller entity who work in the larger entity plus the percentage of employment in the smaller entity that is accounted for by workers who reside in the larger entity." [3]
  3. 1 2 3 4 The OMB may upgrade the Glenwood Springs, CO Micropolitan Statistical Area, the Edwards, CO Micropolitan Statistical Area, and the Durango, CO Micropolitan Statistical Area to metropolitan statistical areas at the next statistical areas update.

Related Research Articles

Wyoming statistical areas Wyoming statistical areas

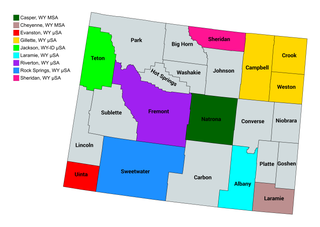
The U.S. State of Wyoming currently has nine statistical areas that have been delineated by the Office of Management and Budget (OMB). On March 6, 2020, the OMB delineated two metropolitan statistical areas and seven micropolitan statistical areas in Wyoming.

Illinois statistical areas Illinois statistical areas

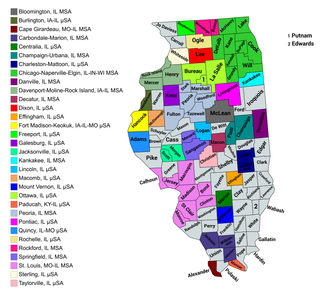
The U.S. State of Illinois currently has 43 statistical areas that have been delineated by the Office of Management and Budget (OMB). On March 6, 2020, the OMB delineated 11 combined statistical areas, 13 metropolitan statistical areas, and 19 micropolitan statistical areas in Illinois.

Ohio statistical areas Ohio statistical areas

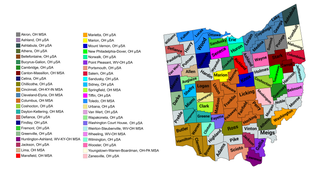
The U.S. State of Ohio currently has 57 statistical areas that have been delineated by the Office of Management and Budget (OMB). On March 6, 2020, the OMB delineated 11 combined statistical areas, 14 metropolitan statistical areas, and 32 micropolitan statistical areas in Ohio.

New York statistical areas New York statistical areas

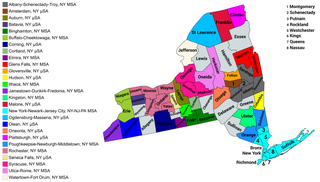
The U.S. State of New York currently has 34 statistical areas that have been delineated by the Office of Management and Budget (OMB). On March 6, 2020, the OMB delineated seven combined statistical areas, 14 metropolitan statistical areas, and 13 micropolitan statistical areas in New York.

Wisconsin statistical areas Wisconsin statistical areas

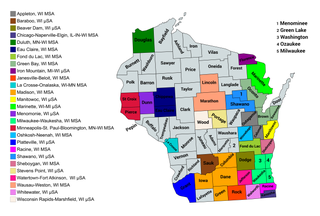
The U.S. State of Wisconsin currently has 36 statistical areas that have been delineated by the Office of Management and Budget (OMB). On March 6, 2020, the OMB delineated nine combined statistical areas, 15 metropolitan statistical areas, and 12 micropolitan statistical areas in Wisconsin.

Montana statistical areas Montana statistical areas

The U.S. State of Montana currently has seven statistical areas that have been delineated by the Office of Management and Budget (OMB). On March 6, 2020, the OMB delineated three metropolitan statistical areas and four micropolitan statistical areas in Montana.

Arkansas statistical areas Arkansas statistical areas

The U.S. State of Arkansas currently has 27 statistical areas that have been delineated by the Office of Management and Budget (OMB). On March 6, 2020, the OMB delineated four combined statistical areas, eight metropolitan statistical areas, and 15 micropolitan statistical areas in Arkansas.

Iowa statistical areas Iowa statistical areas

The U.S. State of Iowa currently has 30 statistical areas that have been delineated by the Office of Management and Budget (OMB). On March 6, 2020, the OMB delineated six combined statistical areas, nine metropolitan statistical areas, and 15 micropolitan statistical areas in Iowa.

Kansas statistical areas Kansas statistical areas

The U.S. State of Kansas currently has 23 statistical areas that have been delineated by the Office of Management and Budget (OMB). On March 6, 2020, the OMB delineated two combined statistical areas, six metropolitan statistical areas, and 15 micropolitan statistical areas in Kansas.

Virginia statistical areas Virginia statistical areas

The United States Commonwealth of Virginia currently has 19 statistical areas that have been delineated by the Office of Management and Budget (OMB). On March 6, 2020, the OMB delineated four combined statistical areas, 11 metropolitan statistical areas, and four micropolitan statistical areas in Virginia.

The U.S. State of Maryland currently has 12 statistical areas that have been delineated by the Office of Management and Budget (OMB). On March 6, 2020, the OMB delineated three combined statistical areas, seven metropolitan statistical areas, and two micropolitan statistical areas in Maryland.

West Virginia statistical areas West Virginia statistical areas

The U.S. State of West Virginia currently has 22 statistical areas that have been delineated by the Office of Management and Budget (OMB). On March 6, 2020, the OMB delineated five combined statistical areas, 11 metropolitan statistical areas, and six micropolitan statistical areas in West Virginia.

Louisiana statistical areas Louisiana statistical areas

The U.S. State of Louisiana currently has 25 statistical areas that have been delineated by the Office of Management and Budget (OMB). On March 6, 2020, the OMB delineated six combined statistical areas, nine metropolitan statistical areas, and ten micropolitan statistical areas in Louisiana.

Maine statistical areas Maine statistical areas

The U.S. State of Maine currently has five statistical areas that have been delineated by the Office of Management and Budget (OMB). On March 6, 2020, the OMB delineated one combined statistical area, three metropolitan statistical areas, and one micropolitan statistical area in Maine.

Minnesota statistical areas Minnesota statistical areas

The U.S. State of Minnesota currently has 30 statistical areas that have been delineated by the Office of Management and Budget (OMB). On March 6, 2020, the OMB delineated four combined statistical areas, eight metropolitan statistical areas, and 18 micropolitan statistical areas in Minnesota.

Nebraska statistical areas Nebraska statistical areas

The U.S. State of Nebraska currently has 15 statistical areas that have been delineated by the Office of Management and Budget (OMB). On March 6, 2020, the OMB delineated two combined statistical areas, four metropolitan statistical areas, and nine micropolitan statistical areas in Nebraska.

New Mexico statistical areas New Mexico statistical areas

The U.S. State of New Mexico currently has 22 statistical areas that have been delineated by the Office of Management and Budget (OMB). On March 6, 2020, the OMB delineated three combined statistical areas, four metropolitan statistical areas, and 15 micropolitan statistical areas in New Mexico.

North Carolina statistical areas North Carolina statistical areas

The U.S. State of North Carolina currently has 49 statistical areas that have been delineated by the Office of Management and Budget (OMB). On March 6, 2020, the OMB delineated ten combined statistical areas, 17 metropolitan statistical areas, and 22 micropolitan statistical areas in North Carolina.

Oregon statistical areas Oregon statistical areas

The U.S. State of Oregon currently has 24 statistical areas that have been delineated by the Office of Management and Budget (OMB). On March 6, 2020, the OMB delineated four combined statistical areas, eight metropolitan statistical areas, and 12 micropolitan statistical areas in Oregon.

South Carolina statistical areas South Carolina statistical areas

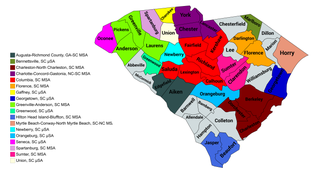
The U.S. State of South Carolina currently has 22 statistical areas that have been delineated by the Office of Management and Budget (OMB). On March 6, 2020, the OMB delineated four combined statistical areas, ten metropolitan statistical areas, and eight micropolitan statistical areas in South Carolina.

References

  1. 1 2 3 4 5 Revised Delineations of Metropolitan Statistical Areas, Micropolitan Statistical Areas, and Combined Statistical Areas, and Guidance on Uses of the Delineations of These Areas (March 6, 2020). "0MB BULLETIN NO. 20-01" (PDF). Office of Management and Budget . Retrieved December 6, 2021.CS1 maint: multiple names: authors list (link)
  2. 1 2 3 4 5 6 "QuickFacts for Colorado". United States Census Bureau . Retrieved December 6, 2021.
  3. 1 2 3 4 5 6 "2020 Standards for Delineating Core Based Statistical Areas". Office of Management and Budget. July 16, 2021. Retrieved December 6, 2021.
  4. "Colorado Counties". Colorado Department of Local Affairs. 2021. Retrieved December 6, 2021.

Coordinates: 38°59′50″N105°32′52″W / 38.9972°N 105.5478°W / 38.9972; -105.5478 (State of Colorado)