List of cities in Botswana

Last updated

Map of Botswana Botswana map.png
Map of Botswana
Selibe Phikwe Phikwe 27.05541E 22.29853S.jpg
Selibe Phikwe
Kanye KanyeApproach.jpg
Kanye
Mahalapye Mahalapye.jpg
Mahalapye

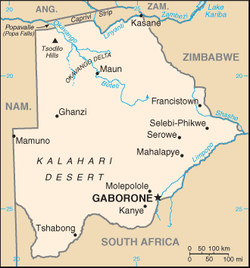
The following is a list of cities and towns or villages in Botswana with population of over 1,000 citizens in the year 2022. [1] [2] Capitals of the administrative divisions (cities, towns or districts) are shown in boldface.

RankNameCity, Town or DistrictPopulation 2011 [1] Population 2022 [2] Change
1. Gaborone Gaborone 231,592246,325+6.36%
2. Francistown Francistown 98,961103,417+4.50%
3. Mogoditshane Kweneng District 58,63288,004+50.10%
4. Maun North-West District 65,69385,350+29.92%
5. Molepolole Kweneng District 73,10374,861+2.40%
6. Serowe Central District 57,58855,676−3.32%
7. Tlokweng South-East District 37,36455,508+48.56%
8. Palapye Central District 41,10252,636+28.06%
9. Mochudi Kgatleng District 47,00150,321+7.06%
10. Mahalapye Central District 46,41848,431+4.34%
11. Kanye Southern District 52,21448,028−8.02%
12. Selibe Phikwe Selibe Phikwe 49,41142,488−14.01%
13. Letlhakane Central District 26,39336,404+37.93%
14. Ramotswa South-East District 30,38133,271+9.51%
15. Lobatse Lobatse 29,00729,772+2.64%
16. Mmopane Kweneng District 17,84525,460+42.67%
17. Thamaga Kweneng District 23,09625,300+9.54%
18. Moshupa Southern District 24,23123,858−1.54%
19. Tonota Central District 24,00723,296−2.96%
20. Bobonong Central District 22,48321,216−5.64%
21. Gabane Kweneng District 16,67120,027+20.13%
22. Ghanzi Ghanzi District 16,27619,012+16.81%
23. Jwaneng Jwaneng 18,00818,784+4.31%
24. Tutume Central District 18,29518,582+1.57%
25. Kopong Kweneng District 11,09913,823+24.54%
26. Mmadinare Central District 15,17713,198−13.04%
27. Tati Siding North-East District 8,19712,404+51.32%
28. Tshabong Kgalagadi District 9,48911,651+22.78%
29. Metsimotlhabe Kweneng District 9,27011,617+25.32%
30. Gumare North-West District 8,97011,572+29.01%
31. Shakawe North-West District 7,42010,589+42.71%
32. Oodi Kgatleng District 5,87410,257+74.62%
33. Bokaa Kgatleng District 6,4629,146+41.54%
34. Kasane Chobe District 9,2449,143−1.09%
35. Borolong Central District 5,2698,917+69.24%
36. Shoshong Central District 11,8848,887−25.22%
37. Molapowabojang Southern District 9,4338,722−7.54%
38. Kazungula Chobe District 4,3208,704+101.48%
39. Orapa Orapa 9,5318,648−9.26%
40. Letlhakeng Kweneng District 9,8718,343−15.48%
41. Nata Central District 7,7327,779+0.61%
42. Rakops Central District 7,2407,439+2.75%
43. Mmankgodi Kweneng District 7,4597,396−0.84%
44. Lerala Central District 7,4557,204−3.37%
45. Otse South-East District 7,9766,986−12.41%
46. Kumakwane Kweneng District 5,9016,826+15.68%
47. Sese Southern District 2,7216,798+149.83%
48. Kang Kgalagadi District 6,5706,764+2.95%
49. Lentsweletau Kweneng District 7,4676,653−10.90%
50. Ramotswa station/Taung South-East District 4,2506,286+47.91%
51. Masunga North-East District 5,6666,216+9.71%
52. Lotlhakane Southern District 5,2106,045+16.03%
53. Sefophe Central District 6,9386,001−13.51%
54. Rasesa Kgatleng District 4,4915,966+32.84%
55. Maitengwe Central District 6,2165,929−4.62%
56. Mathangwane Central District 5,9835,918−1.09%
57. Shashe-Mooke Central District 4,0285,897+46.40%
58. Good Hope Southern District 6,3775,672−11.06%
59. Gweta Central District 7,0165,548−20.92%
60. Mmathethe Southern District 6,9285,421−21.75%
61. Sefhare Central District 5,2955,381+1.62%
62. Chadibe Central District 5,2185,371+2.93%
63. Tsetsebjwe Central District 4,8485,248+8.25%
64. Hukuntsi Kgalagadi District 4,7515,224+9.96%
65. Charles Hill Ghanzi District 3,7915,164+36.22%
66. Morwa Kgatleng District 3,5664,988+39.88%
67. Mandunyane Central District 3,5894,584+27.72%
68. Etsha 6 North-West District 3,1304,570+46.01%
69. Digawana Southern District 3,2964,356+32.16%
70. Mokatse Kgatleng District 04,321NA
71. Pitsane Siding Southern District 3,6544,312+18.01%
72. Mopipi Central District 3,9124,115+5.19%
73. Dukwi Central District 3,4384,075+18.53%
74. Nkange Central District 3,5504,006+12.85%
75. Matshelagabedi North-East District 2,8713,987+38.87%
76. Ramokgonami Central District 4,4863,932−12.35%
77. Sebina Central District 3,2763,865+17.98%
78. Maunatlala Central District 4,5523,862−15.16%
79. Shashe-Mooke Central District 3,1363,805+21.33%
80. Manyana Southern District 3,5503,752+5.69%
81. Chadibe Central District 2,9733,678+23.71%
82. Modipane Kgatleng District 3,1973,624+13.36%
83. Takatokwane Kweneng District 2,7283,444+26.25%
84. Etsha 13 North-West District 2,3773,401+43.08%
85. Lecheng Central District 3,3443,352+0.24%
86. Werda Kgalagadi District 3,2613,349+2.70%
87. Moiyabana Central District 3,5713,264−8.60%
88. Gakuto Kweneng District 1,3503,227+139.04%
89. Pilane Kgatleng District 1,7953,222+79.50%
90. Ranaka Southern District 2,4093,207+33.13%
91. Matebeleng Kgatleng District 2,1963,198+45.63%
92. Radisele Central District 2,9853,164+6.00%
93. Khudumelapye Kweneng District 2,0803,135+50.72%
94. Khakhea Southern District 2,9443,084+4.76%
95. Serule Central District 3,2413,062−5.52%
96. Matlapana North-West District 1,4493,043+110.01%
97. Mogorosi Central District 2,7163,027+11.45%
98. Tobane Central District 2,0753,001+44.63%
99. Mookane Central District 2,9833,001+0.60%
100. Mmashoro Central District 2,8342,939+3.71%
101. Thebephatshwa Air Base (BDFCamp) Kweneng District 2,6902,929+8.88%
102. Mogobane South-East District 2,4002,926+21.92%
103. Sowa Sowa 3,5982,914−19.01%
104. Thabala Central District 2,4292,911+19.84%
105. Ntlhantlhe Southern District 2,3422,842+21.35%
106. Dekar Ghanzi District 1,6682,814+68.71%
107. Malolwane Kgatleng District 2,4062,806+16.63%
108. Seronga North-West District 2,6742,796+4.56%
109. Machaneng Central District 2,5372,786+9.81%
110. Pandamatenga Chobe District 1,7982,750+52.95%
111. Paje Central District 2,5072,735+9.09%
112. Molalatau Central District 2,3962,703+12.81%
113. Sehithwa North-West District 2,7482,703−1.64%
114. Tumasera Central District 3,1362,636−15.94%
115. Ditshegwane Kweneng District 2,1142,607+23.32%
116. Salajwe Kweneng District 2,4402,602+6.64%
117. Mokoboxane Central District 1,5942,598+62.99%
118. Mathathane Central District 2,6722,587−3.18%
119. Mmathubudukwane Kgatleng District 2,2032,517+14.25%
120. Nokaneng North-West District 2,0672,510+21.43%
121. Mabutsane Southern District 2,3862,507+5.07%
122. Mohembo West North-West District 1,7702,500+41.24%
123. Marapong Central District 2,2832,493+9.20%
124. Nshakashokwe Central District 2,1682,491+14.90%
125. Senete Central District 2,4402,457+0.70%
126. Artisia Kgatleng District 2,3652,422+2.41%
127. Sojwe Kweneng District 3,9832,419−39.27%
128. Mabeleapudi Central District 2,2472,407+7.12%
129. Lesenepole Central District 3,0482,403−21.16%
130. Mosolotshane Central District 2,0172,375+17.75%
131. Tshesebe North-East District 2,2772,375+4.30%
132. Matsiloje North-East District 2,3802,368−0.50%
133. Otse Central District 1,7872,360+32.06%
134. Kalamare Central District 2,1962,350+7.01%
135. Ratholo Central District 2,2362,338+4.56%
136. Mokobeng Central District 2,5352,257−10.97%
137. Ncojane Ghanzi District 1,9582,242+14.50%
138. Nswazwi Central District 2,1852,239+2.47%
139. Lorolwana Southern District 1,5682,225+41.90%
140. Mogapi Central District 1,9392,214+14.18%
141. Makobo Central District 1,2682,191+72.79%
142. Tsamaya North-East District 2,3872,190−8.25%
143. Tsau North-West District 2,0002,144+7.20%
144. Mmatseta Kweneng District 4742,120+347.26%
145. Seleka Central District 1,1572,115+82.80%
146. Maokane Southern District 2,0442,098+2.64%
147. Sepopa North-West District 2,2832,090−8.45%
148. Mabesekwa Central District 1,5282,085+36.45%
149. Moletemane Central District 1,6642,077+24.82%
150. Tshimoyapula Central District 1,6262,073+27.49%
151. Mosetse Central District 1,7872,064+15.50%
152. Lotlhakane West Southern District 1,6372,056+25.60%
153. Mokubilo Central District 1,9172,047+6.78%
154. Xhumo Central District 1,6842,041+21.20%
155. Lehututu Kgalagadi District 1,9562,035+4.04%
156. Sesung Kweneng District 7522,014+167.82%
157. Moroka North-East District 1,6922,000+18.20%
158. Gobojango Central District 2,1381,981−7.34%
159. Rakhuna Southern District 1,3551,980+46.13%
160. Marobela Central District 1,6721,970+17.82%
161. Moshaneng Southern District 1,5121,961+29.70%
162. Themashanga North-East District 1,6481,955+18.63%
163. Tsootsha Ghanzi District 1,8481,911+3.41%
164. Gojwane Central District 1,4111,888+33.81%
165. Kauxwhi North-West District 2,0401,888−7.45%
166. Kudumatse Central District 2,0301,876−7.59%
167. Malatswai Central District 1,4821,867+25.98%
168. Mmanoko Kweneng District 9321,861+99.68%
169. Toteng North-West District 9021,854+105.54%
170. Mabule Southern District 2,2601,835−18.81%
171. Maboane Kweneng District 1,0851,811+66.91%
172. Makwate Central District 1,6111,806+12.10%
173. Lokgwabe Kgalagadi District 1,4171,792+26.46%
174. Motlhabaneng Central District 1,4561,790+22.94%
175. Dimajwe Central District 1,4231,788+25.65%
176. Makopong Kgalagadi District 1,6971,788+5.36%
177. Majwaneng Central District 1,9031,779−6.52%
178. Zwenshambe North-East District 1,9431,776−8.59%
179. Ditladi North-East District 1,3441,756+30.65%
180. Mogapinyana Central District 1,5281,754+14.79%
181. Magotlhwane Southern District 1,4331,751+22.19%
182. Selokolela Southern District 1,6101,750+8.70%
183. Lorwana Southern District 1,1771,721+46.22%
184. Motokwe Kweneng District 1,4131,720+21.73%
185. Mmatshumo Central District 1,1221,719+53.21%
186. Moshaweng Kweneng District 1,2221,700+39.12%
187. Mosu Central District 1,7921,697−5.30%
188. Kokotsha Kgalagadi District 1,2241,696+38.56%
189. Kgomokasitwa Southern District 1,4231,669+17.29%
190. Samochema North-West District 1,1491,667+45.08%
191. Goshwe Central District 1,5731,640+4.26%
192. Natale Central District 1,2881,638+27.17%
193. Phitshane Molopo Southern District 1,9451,625−16.45%
194. New Xade Ghanzi District 1,2691,619+27.58%
195. Gamodubu Kweneng District 5011,613+221.96%
196. Topisi Central District 1,5451,607+4.01%
197. Seolwane Central District 1,2801,596+24.69%
198. Xakao North-West District 1,5651,594+1.85%
199. Kgagodi Central District 1,7561,593−9.28%
200. Zoroga Central District 1,3581,592+17.23%
201. Makalamabedi Central District 1,6741,591−4.96%
202. Kodibeleng Central District 1,2981,589+22.42%
203. Ramatlabama Southern District 1,3281,588+19.58%
204. Tshokwe Central District 1,0701,586+48.22%
205. Mafongo Central District 1,1511,583+37.53%
206. Sikwane Kgatleng District 1,4661,580+7.78%
207. Ramokgwebana North-East District 1,5481,565+1.10%
208. Kedia Central District 1,2371,563+26.35%
209. Etsha 1 North-West District 9651,554+61.04%
210. Matobo Central District 1,1361,553+36.71%
211. Nlakhwane North-East District 1,5831,547−2.27%
212. Damochojena Central District 9931,527+53.78%
213. Pitseng Southern District 1,0741,526+42.09%
214. Khwee Central District 1,1961,509+26.17%
215. Matsitama Central District 1,3091,502+14.74%
216. Beetsha North-West District 9411,502+59.62%
217. Nxamasere North-West District 1,5841,501−5.24%
218. Semolale Central District 1,2881,497+16.23%
219. Botlhapatlou Kweneng District 1,2231,493+22.08%
220. Senyawe North-East District 1,3391,481+10.60%
221. Sekoma Southern District 1,1901,471+23.61%
222. Dutlwe Kweneng District 1,0551,464+38.77%
223. Makaleng North-East District 1,2561,463+16.48%
224. Mapoka North-East District 1,7891,457−18.56%
225. Gootau Central District 1,4011,455+3.85%
226. Tamasane Central District 1,1441,426+24.65%
227. Malwelwe Kweneng District 1,1461,414+23.39%
228. Phepheng Kgalagadi District 9941,411+41.95%
229. Boatlaname Kweneng District 1,0491,405+33.94%
230. Dibete Station Central District 1,0831,403+29.55%
231. Kutamogree Central District 1,0351,397+34.98%
232. Dinokwe Central District 1,2291,392+13.26%
233. Borotsi Central District 1,5011,388−7.53%
234. Jackalas 2 North-East District 1,2221,388+13.58%
235. Sorilatholo Kweneng District 8971,373+53.07%
236. Siviya North-East District 1,2891,366+5.97%
237. Kareng North-West District 1,2591,361+8.10%
238. Jackalas 1 North-East District 1,0931,352+23.70%
239. Pilikwe Central District 1,2821,346+4.99%
240. Mmaphashalala Central District 1,0441,342+28.54%
241. Ngarange North-West District 9881,336+35.22%
242. Lekgolobotlo Southern District 1,1771,334+13.34%
243. Tloaneng Kweneng District 8681,326+52.76%
244. Hatsalatladi Kweneng District 7261,314+80.99%
245. Maape Central District 1,3371,314−1.72%
246. Moralane Central District 8661,310+51.27%
247. Khawa Kgalagadi District 8171,299+59.00%
248. Bray Kgalagadi District 1,0411,286+23.54%
249. Kaudwane Kweneng District 1,0841,283+18.36%
250. Sehunou Central District 1,0491,274+21.45%
251. Shakwe Central District 9761,272+30.33%
252. Motopi Central District 1,3401,272−5.07%
253. Sekhutlane Southern District 8711,266+45.35%
254. Omaweneno Kgalagadi District 9171,256+36.97%
255. Mokolodi Kweneng District 6241,250+100.32%
256. Motshegaletau Central District 9581,238+29.23%
257. Lesoma Chobe District 6131,235+101.47%
258. Mabalane Kgatleng District 7381,227+66.26%
259. Kuke Ghanzi District 8331,226+47.18%
260. Shashe Bridge North-East District 1,0951,225+11.87%
261. Keng Southern District 9921,220+22.98%
262. Kachikau Chobe District 1,3561,214−10.47%
263. Groote Laagte Ghanzi District 8491,206+42.05%
264. Serinane Kweneng District 7871,198+52.22%
265. Matlhakola Central District 9961,192+19.68%
266. Moshopha Central District 1,3731,191−13.26%
267. Gasita Southern District 1,0631,188+11.76%
268. Mahotshwane Southern District 8611,181+37.17%
269. Mulambakwena North-East District 9741,177+20.84%
270. Tlhankane Southern District 7221,154+59.83%
271. Sepako Central District 6821,152+68.91%
272. Mosojane North-East District 1,2101,145−5.37%
273. Kokong Southern District 9281,141+22.95%
274. Leologane Kweneng District 8231,128+37.06%
275. Ngware Kweneng District 9191,124+22.31%
276. Gani North-West District 7271,119+53.92%
277. Malaka Central District 1,0441,112+6.51%
278. West Hanahai Ghanzi District 6621,101+66.31%
279. Gathwane Southern District 8791,099+25.03%
280. Karakobis Ghanzi District 8811,096+24.40%
281. Tshane Kgalagadi District 1,0201,092+7.06%
282. Borotsi Central District 9421,086+15.29%
283. Bodibeng North-West District 7781,083+39.20%
284. Mogonye Southern District 5771,081+87.35%
285. Jamataka Central District 6501,079+66.00%
286. Mogomotho North-West District 8431,078+27.88%
287. Mokhomba Southern District 9591,077+12.30%
288. Lepokole Central District 9551,051+10.05%
289. Dagwi Central District 4541,048+130.84%
290. Magoriapitse Southern District 8461,048+23.88%
291. Mmeya Central District 7521,043+38.70%
292. Qabo Ghanzi District 7621,042+36.75%
293. Metlobo Southern District 8911,039+16.61%
294. Malotwana Siding Kgatleng District 6081,037+70.56%
295. Shorobe North-West District 1,0311,027−0.39%
296. Qangwa North-West District 6831,018+49.05%
297. Kumaga Central District 7581,016+34.04%
298. Pitsana-Potokwe Southern District 8161,012+24.02%
299. Segwagwa Southern District 1,0561,008−4.55%
300. Dovedale Central District 8321,006+20.91%
301. Chobokwane Ghanzi District 7711,005+30.35%
302. Parakarungu Chobe District 8451,005+18.93%
303. Mmadikola Central District 8301,004+20.96%
304. Mokgenene Central District 8351,000+19.76%

Related Research Articles

<span class="mw-page-title-main">Demographics of Botswana</span> Demographics of country

Demographic features of the population of Botswana include population density, ethnicity, education level, health of the populace, economic status, religious affiliations and other aspects.

<span class="mw-page-title-main">Burlington, Illinois</span> Village in Illinois, United States

Burlington is a village in Kane County, Illinois, United States. The population was 429 as of 2022 estimates. It was incorporated as a village on November 6, 1990.

<span class="mw-page-title-main">Urban area</span> Human settlement with high population density and infrastructure of built environment

An urban area, built-up area or urban agglomeration is a human settlement with a high population density and an infrastructure of built environment. This is the core of a metropolitan statistical area in the United States, if it contains a population of more than 50,000.

<span class="mw-page-title-main">Oas, Albay</span> Municipality in Albay, Philippines

Oas, officially the Municipality of Oas, is a 1st class municipality in the province of Albay, Philippines. According to the 2020 census, it has a population of 66,084 people.

<span class="mw-page-title-main">Norzagaray</span> Municipality in Bulacan, Philippines

Norzagaray, officially the Municipality of Norzagaray, is a 1st class municipality in the province of Bulacan, Philippines. According to the 2020 census, it has a population of 136,064 people.

<span class="mw-page-title-main">San Manuel, Tarlac</span> Municipality in Tarlac, Philippines

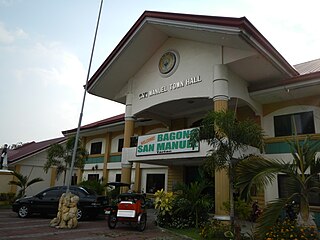
San Manuel, officially the Municipality of San Manuel, is a municipality in the province of Tarlac, Philippines. According to the 2020 census, it has a population of 28,387 people.

<span class="mw-page-title-main">Nampicuan</span> Municipality in Nueva Ecija, Philippines

Nampicuan, officially the Municipality of Nampicuan, is a 5th class municipality in the province of Nueva Ecija, Philippines. According to the 2020 census, it has a population of 14,471 people.

Shoshong is a town in Botswana, formerly the chief settlement of the eastern Bamangwato.

<span class="mw-page-title-main">Lamont County</span> Municipal district in Alberta, Canada

Lamont County is a municipal district in central Alberta, Canada, located in Census Division No. 10, northeast of Edmonton. The county contains 27 Townships. Its municipal office is located in the Town of Lamont.

<span class="mw-page-title-main">Lacombe County</span> Municipal district in Alberta, Canada

Lacombe County is a municipal district in central Alberta, Canada. It is within Census Division No. 8 north of the City of Red Deer. Its municipal office is 4 km (2.5 mi) west of Highway 2 and the City of Lacombe, and 6 km (3.7 mi) east of the Summer Village of Gull Lake, at the intersection of Highway 12 and Spruceville Road.

<span class="mw-page-title-main">Human settlement</span> Community of any size, in which people live

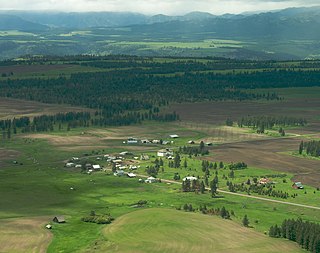
In geography, statistics and archaeology, a settlement, locality or populated place is a community of people living in a particular place. The complexity of a settlement can range from a minuscule number of dwellings grouped together to the largest of cities with surrounding urbanized areas. Settlements may include hamlets, villages, towns and cities. A settlement may have known historical properties such as the date or era in which it was first settled, or first settled by particular people. The process of settlement involves human migration.

Bani Suheila is a municipality in the Gaza Strip, in the Khan Yunis Governorate of the State of Palestine. The town is located 2 km (1.2 mi) east of the city of Khan Younis. As of 2017, Bani Suheila had a population of 41,439 people.

<span class="mw-page-title-main">Census in Botswana</span> Nationwide decennial census

ThePopulation and Housing Census is a decennial census which is the once-a-decade population and housing count of all people in Botswana. This count is carried out by the Statistics Botswana.

Manyana is a village located in the Southern District of Botswana. It had 3,550 inhabitants at the 2011 census.

Mmathethe is a village located in the Southern District of Botswana. It had 5,078 inhabitants at the 2011 census.

References

  1. 1 2 "Population of towns, villages and associated localities" (PDF). 2011 Population and Housing Census. Central Statistics Office. Retrieved 4 January 2024.
  2. 1 2 "Population of towns, villages and associated localities" (PDF). 2022 Population and Housing Census. Central Statistics Office. Retrieved 4 January 2024.