| Arizona's 1st congressional district | |
|---|---|
Interactive map of district boundaries since January 3, 2023 | |
| Representative | |
| Area | 1,426 sq mi (3,690 km2) |
| Distribution |
|
| Population (2024) | 819,479 [1] |
| Median household income | $102,195 [2] |
| Ethnicity |
|
| Cook PVI | R+1 [3] |
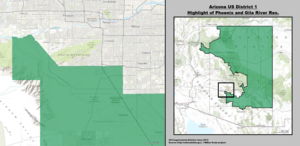
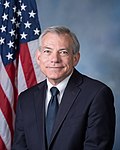
Arizona's 1st congressional district is a congressional district located in the U.S. state of Arizona, covering northeastern Maricopa County. Before 2023, geographically, it was the eleventh-largest congressional district in the country and included much of the state outside the Phoenix and Tucson metropolitan areas. From 2013 through 2022, it also included the Navajo Nation, the Hopi reservation, and the Gila River Indian Community, with 25% of the population being Native American. At that time, the district had more Native Americans than any other congressional district in the United States. [4] In the 2022 elections, David Schweikert was elected in the redefined district.
The new 1st district (as of 2023) includes northeast Phoenix, Scottsdale, Paradise Valley, Cave Creek, Carefree, and Fountain Hills. It is majority-white and is the wealthiest congressional district in Arizona.
When Arizona was first divided into congressional districts as a result of the 1950 census, the 1st district comprised all of Maricopa County, home to Phoenix, while the rest of the state was in the 2nd district. In a mid-decade redistricting resulting from Wesberry v. Sanders in 1967, the 1st was cut back to eastern Phoenix and most of what became the East Valley.
Over the years, the 1st's share of Phoenix was gradually reduced due to the area's explosive growth in the second half of the 20th century. However, it remained based in the East Valley until Arizona picked up two seats in the 2000 U.S. census. The old 1st essentially became the 6th district, while a new 1st district was created to serve most of the state outside of Phoenix and Tucson.
During its time in the East Valley, the 1st district was represented by some of Arizona’s most prominent representatives, including John Jacob Rhodes, the House Minority Leader during the Nixon administration, who was succeeded by John McCain, a future senator and presidential nominee.
After the 2012 redistricting, the Hopi reservation was drawn into the 1st district; it had previously been included within the 2nd district. Also included were some northern suburbs of Tucson that had been in the 8th, as well as a tiny section of Phoenix itself near the Gila River Indian Community. Meanwhile, heavily Republican Prescott, the old 1st's largest city, and much of surrounding Yavapai County were drawn into the new, heavily Republican 4th district. The district was now considered to be significantly more competitive for Democrats, who held the seat without interruption for a decade.
In the 2022 redistricting, this district essentially became the 2nd district, while the 1st was redrawn to cover most of the territory in the 6th district. [5] It now covers Northeastern Maricopa County, east of I-17 and north of Az-202 along the Salt River. It includes the northeastern suburbs of Phoenix, Scottsdale, Paradise Valley, Cave Creek, Carefree, Fountain Hills, Rio Verde, and the Fort McDowell Yavapai Nation. [6] [7] That district, in turn, had been the 4th district from 1973 to 2003, and then the 3rd district from 2003 to 2013.
From 2012 to 2021, the district covered the entirety of the following counties:
The district covered the majority of:
Small portions of the following counties were also covered:
Source: [8]
| Year | Office | Results [9] [10] |
|---|---|---|
| 2003–2013 Boundaries | ||
| 2004 | President | Bush 53.8% - 45.5% [11] |
| 2008 | President | McCain 54.5% - 44.1% |
| 2010 | Senate | McCain 58.3% - 35.0% |
| Governor | Brewer 55.7% - 41.0% | |
| Secretary of State | Bennett 56.5% - 43.5% | |
| Attorney General | Horne 52.4% - 47.6% | |
| Treasurer | Ducey 51.1% - 41.8% | |
| 2013–2023 Boundaries | ||
| 2008 | President | McCain 51.0% - 47.8% |
| 2012 | President | Romney 50.4% - 47.9% |
| 2016 | President | Trump 47.7% - 46.6% |
| Senate | McCain 48.4% - 45.3% | |
| 2018 | Senate | Sinema 50.6% - 46.4% |
| Governor | Ducey 54.3% - 43.1% | |
| Attorney General | Contreras 49.9% - 49.9% | |
| 2020 | President | Biden 50.1% - 48.4% |
| Senate (Spec.) | Kelly 52.1% - 47.9% | |
| 2023–2033 Boundaries | ||
| 2016 | President | Trump 48.8% - 44.6% |
| Senate | McCain 57.8% - 37.4% | |
| 2018 | Senate | Sinema 50.0% - 48.3% |
| Governor | Ducey 57.7% - 40.7% | |
| 2020 | President | Biden 50.1% - 48.6% |
| Senate (Spec.) | Kelly 50.7% - 49.3% | |
| 2022 | Senate | Kelly 52.5% - 45.8% |
| Governor | Hobbs 51.5% - 48.1% | |
| Secretary of State | Fontes 54.0% - 45.9% | |
| Attorney General | Mayes 51.4% - 48.5% | |
| Treasurer | Yee 56.3% - 43.7% | |
| 2024 | President | Trump 51.1% - 48.0% |
| Senate | Gallego 51.6% - 46.6% | |
Arizona gained a second congressional seat after the 1940 census. It used a general ticket to elect its representatives until the 1948 elections, when candidates ran from each of the districts.
| Party | Candidate | Votes | % | ||
|---|---|---|---|---|---|
| Republican | Rick Renzi | 85,967 | 49.2 | ||
| Democratic | George Cordova | 79,730 | 45.6 | ||
| Libertarian | Edwin Porr | 8,990 | 5.1 | ||
| Majority | 6,237 | 3.6 | |||
| Total votes | 174,687 | 100.0 | |||
| Republican win (new seat) | |||||
| Party | Candidate | Votes | % | ±% | |
|---|---|---|---|---|---|
| Republican | Rick Renzi (Incumbent) | 148,315 | 58.5 | +9.3 | |
| Democratic | Paul Babbitt | 91,776 | 36.2 | –9.4 | |
| Libertarian | John Crockett | 13,260 | 5.2 | +0.1 | |
| Majority | 56,539 | 22.3 | +18.7 | ||
| Total votes | 253,351 | 100.0 | |||
| Republican hold | Swing | +9.4 | |||
| Party | Candidate | Votes | % | ±% | |
|---|---|---|---|---|---|
| Republican | Rick Renzi (Incumbent) | 105,646 | 53.2 | –5.3 | |
| Democratic | Ellen Simon | 88,691 | 44.7 | +8.4 | |
| Libertarian | David Schlosser | 4,205 | 2.1 | –3.1 | |
| Majority | 16,955 | 8.5 | –13.8 | ||
| Total votes | 198,542 | 100.0 | |||
| Republican hold | Swing | –6.9 | |||
| Party | Candidate | Votes | % | ±% | |
|---|---|---|---|---|---|
| Democratic | Ann Kirkpatrick | 155,791 | 57.5 | +12.8 | |
| Republican | Sydney Ann Hay | 109,924 | 40.5 | –12.7 | |
| Independent | Brent Maupin | 4,124 | 1.5 | N/a | |
| Libertarian | Thane Eichenauer | 1,316 | 0.5 | –1.6 | |
| Majority | 45,867 | 16.9 | N/a | ||
| Total votes | 271,155 | 100.0 | |||
| Democratic gain from Republican | Swing | +12.7 | |||
| Party | Candidate | Votes | % | ±% | |
|---|---|---|---|---|---|
| Republican | Paul Gosar | 112,816 | 49.7 | +9.2 | |
| Democratic | Ann Kirkpatrick (Incumbent) | 99,233 | 43.7 | –13.7 | |
| Libertarian | Nicole Patti | 14,869 | 6.6 | +6.1 | |
| Majority | 13,583 | 6.0 | N/a | ||
| Total votes | 226,918 | 100.0 | |||
| Republican gain from Democratic | Swing | +11.5 | |||
| Party | Candidate | Votes | % | ||
|---|---|---|---|---|---|
| Democratic | Ann Kirkpatrick | 122,774 | 48.8 | ||
| Republican | Jonathan Paton | 113,594 | 45.1 | ||
| Libertarian | Kim Allen | 15,227 | 6.1 | ||
| Majority | 9,180 | 3.6 | |||
| Total votes | 251,595 | 100.0 | |||
| Democratic win (new boundaries) | |||||
| Party | Candidate | Votes | % | ±% | |
|---|---|---|---|---|---|
| Democratic | Ann Kirkpatrick (Incumbent) | 97,391 | 52.6 | +3.8 | |
| Republican | Andy Tobin | 87,723 | 47.4 | +2.2 | |
| Majority | 9,568 | 5.2 | +1.6 | ||
| Total votes | 185,114 | 100.0 | |||
| Democratic hold | Swing | +0.8 | |||
| Party | Candidate | Votes | % | ±% | |
|---|---|---|---|---|---|
| Democratic | Tom O'Halleran | 142,219 | 50.6 | –1.9 | |
| Republican | Paul Babeu | 121,745 | 43.4 | –4.0 | |
| Green | Ray Parrish | 16,746 | 6.0 | N/a | |
| Majority | 20,474 | 7.3 | +2.1 | ||
| Total votes | 280,710 | 100.0 | |||
| Democratic hold | Swing | +1.0 | |||
| Party | Candidate | Votes | % | ±% | |
|---|---|---|---|---|---|
| Democratic | Tom O'Halleran (Incumbent) | 143,240 | 53.8 | +3.2 | |
| Republican | Wendy Rogers | 122,784 | 46.2 | +2.8 | |
| Majority | 20,456 | 7.7 | +0.4 | ||
| Total votes | 266,024 | 100.0 | |||
| Democratic hold | Swing | +0.2 | |||
| Party | Candidate | Votes | % | ±% | |
|---|---|---|---|---|---|
| Democratic | Tom O'Halleran (Incumbent) | 188,469 | 51.6 | –2.2 | |
| Republican | Tiffany Shedd | 176,709 | 48.4 | +2.2 | |
| Majority | 11,760 | 3.2 | –4.5 | ||
| Total votes | 365,178 | 100.0 | |||
| Democratic hold | Swing | –2.2 | |||
| Party | Candidate | Votes | % | ||
|---|---|---|---|---|---|
| Republican | David Schweikert (Incumbent) | 182,336 | 50.4 | ||
| Democratic | Jevin Hodge | 179,141 | 49.6 | ||
| Majority | 3,195 | 0.9 | |||
| Total votes | 361,477 | 100.0 | |||
| Republican win (new boundaries) | |||||
| Party | Candidate | Votes | % | ±% | |
|---|---|---|---|---|---|
| Republican | David Schweikert (Incumbent) | 225,538 | 51.9 | +1.5 | |
| Democratic | Amish Shah | 208,966 | 48.1 | –1.5 | |
| Majority | 16,572 | 3.8 | +2.9 | ||
| Total votes | 434,504 | 100.0 | |||
| Republican hold | Swing | +1.5 | |||