| Member | Party | Years | Cong
ress(es) | Electoral history | Counties |
|---|
| District created March 4, 1885 |

Charles N. Felton
(San Francisco) | Republican | March 4, 1885 –
March 3, 1889 | 49th
50th | Elected in 1884.
Re-elected in 1886.
Retired. | 1885–1893
San Francisco, San Mateo, Santa Clara, Santa Cruz |

Thomas J. Clunie
(San Francisco) | Democratic | March 4, 1889 –
March 3, 1891 | 51st | Elected in 1888.
Retired. |

Eugene F. Loud
(San Francisco) | Republican | March 4, 1891 –
March 3, 1903 | 52nd
53rd
54th
55th
56th
57th | Elected in 1890.
Re-elected in 1892.
Re-elected in 1894.
Re-elected in 1896.
Re-elected in 1898.
Re-elected in 1900.
Lost re-election |
1893–1913
San Francisco, San Mateo, Santa Clara |

William J. Wynn
(San Francisco) | Democratic/
Union Labor | March 4, 1903 –
March 3, 1905 | 58th | Elected in 1902.
Lost re-election. |

Everis A. Hayes
(San Jose) | Republican | March 4, 1905 –
March 3, 1913 | 59th
60th
61st
62nd | Elected in 1904.
Re-elected in 1906.
Re-elected in 1908.
Re-elected in 1910.
Redistricted to the 8th district . |

John I. Nolan
(San Francisco) | Republican | March 4, 1913 –
November 18, 1922 | 63rd
64th
65th
66th
67th | Elected in 1912.
Re-elected in 1914.
Re-elected in 1916.
Re-elected in 1918.
Re-elected in 1920.
Re-elected in 1922.
Died. | 1913–1967
San Francisco |
| Vacant | November 18, 1922 –
January 23, 1923 | 67th |

Mae Nolan
(San Francisco) | Republican | January 23, 1923 –
March 3, 1925 | 67th
68th | Elected to finish her husband's expiring term, and to the new term to which he had been elected.
Retired. |

Lawrence J. Flaherty
(San Francisco) | Republican | March 4, 1925 –
June 13, 1926 | 69th | Elected in 1924.
Died. |
| Vacant | June 13, 1926 –
August 31, 1926 |

Richard J. Welch
(San Francisco) | Republican | August 31, 1926 –
September 10, 1949 | 69th
70th
71st
72nd
73rd
74th
75th
76th
77th
78th
79th
80th
81st | Elected to finish Flaherty's term.
Re-elected in 1926
Re-elected in 1928.
Re-elected in 1930.
Re-elected in 1932.
Re-elected in 1934.
Re-elected in 1936.
Re-elected in 1938.
Re-elected in 1940.
Re-elected in 1942.
Re-elected in 1944.
Re-elected in 1946.
Re-elected in 1948.
Died. |
| Vacant | September 10, 1949 –
November 8, 1949 | 81st |
John F. Shelley
(San Francisco) | Democratic | November 8, 1949 –
January 7, 1964 | 81st
82nd
83rd
84th
85th
86th
87th
88th | Elected to finish Welch's term.
Re-elected in 1950.
Re-elected in 1952.
Re-elected in 1954.
Re-elected in 1956.
Re-elected in 1958.
Re-elected in 1960.
Re-elected in 1962.
Resigned after election as Mayor of San Francisco. |
| Vacant | January 7, 1964 –
February 18, 1964 | 88th |

Phillip Burton
(San Francisco) | Democratic | February 18, 1964 –
January 3, 1975 | 88th
89th
90th
91st
92nd
93rd | Elected to finish Shelley's term.
Re-elected later in 1964.
Re-elected in 1966.
Re-elected in 1968.
Re-elected in 1970.
Re-elected in 1972.
Redistricted to the 6th district . |
| Eastern San Francisco |

John Burton
(San Francisco) | Democratic | January 3, 1975 –
January 3, 1983 | 94th
95th
96th
97th | Redistricted from the 6th district and re-elected in 1974.
Re-elected in 1976.
Re-elected in 1978.
Re-elected in 1980.
Retired. | 1975–1983
Marin, northwestern San Francisco |

Phillip Burton
(San Francisco) | Democratic | January 3, 1983 –
April 10, 1983 | 98th | Redistricted from the 6th district and re-elected in 1982.
Died. | 1983–1993
Western San Francisco |
| Vacant | April 10, 1983 –
June 21, 1983 | |

Sala Burton
(San Francisco) | Democratic | June 21, 1983 –
February 1, 1987 | 98th
99th
100th | Elected to finish her husband's term.
Re-elected in 1984.
Re-elected in 1986.
Died. |
| Vacant | February 1, 1987 –
June 2, 1987 | 100th |

Nancy Pelosi
(San Francisco) | Democratic | June 2, 1987 –
January 3, 1993 | 100th
101st
102nd | Elected to finish Burton's term.
Re-elected in 1988.
Re-elected in 1990.
Redistricted to the 8th district . |

Bob Matsui
(Sacramento) | Democratic | January 3, 1993 –
January 1, 2005 | 103rd
104th
105th
106th
107th
108th | Redistricted from the 3rd district and re-elected in 1992.
Re-elected in 1994.
Re-elected in 1996.
Re-elected in 1998.
Re-elected in 2000.
Re-elected in 2002.
Re-elected in 2004, but died before his term began. | 1993–2003
Sacramento
(Sacramento city) |
2003–2013

Sacramento
(Sacramento city) |
| Vacant | January 1, 2005 –
March 8, 2005 | 108th
109th |

Doris Matsui
(Sacramento) | Democratic | March 8, 2005 –
January 3, 2013 | 109th
110th
111th
112th | Elected to finish her husband's term.
Re-elected in 2006.
Re-elected in 2008.
Re-elected in 2010.
Redistricted to the 6th district . |
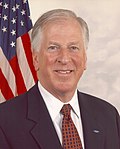
Mike Thompson
(St. Helena) | Democratic | January 3, 2013 –
January 3, 2023 | 113th
114th
115th
116th
117th | Redistricted from the 1st district and re-elected in 2012.
Re-elected in 2014.
Re-elected in 2016.
Re-elected in 2018.
Re-elected in 2020.
Redistricted to the 4th district . | 2013–2023

North Bay area including Napa, Santa Rosa, and Vallejo |

Tom McClintock
(Elk Grove) | Republican | January 3, 2023 –
present | 118th
119th | Redistricted from the 4th district and re-elected in 2022.
Re-elected in 2024. | 2023–present

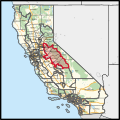
Amador, Calaveras, Tuolumne. Mariposa, western El Dorado, eastern Stanislaus, Madera and Fresno. |