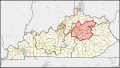
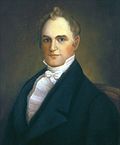
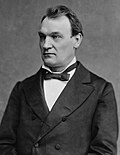
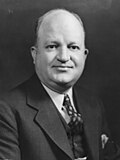
Member Party Years Cong Electoral history Location District created March 4, 1803 George M. Bedinger (Blue Licks Springs ) Democratic-Republican March 4, 1803 – 8th 9th Elected in 1803 .Re-elected in 1804 . 1803–1813 Bourbon , Fleming , Floyd , Mason , and Nicholas counties Joseph Desha (Mays Lick ) Democratic-Republican March 4, 1807 – 10th 11th 12th Elected in 1806 .Re-elected in 1808 .Re-elected in 1810 .Redistricted to the 4th district . Solomon P. Sharp (Bowling Green ) Democratic-Republican March 4, 1813 – 13th 14th Elected in 1812 .Re-elected in 1814 . 1813–1823 Barren , Butler , Cumberland , Logan , and Warren counties David Walker (Russellville ) Democratic-Republican March 4, 1817 – 15th 16th Elected in 1816 .Re-elected in 1818 . Vacant March 1, 1820 – 16th Francis Johnson (Bowling Green ) Democratic-Republican November 13, 1820 – 16th 17th Elected to finish Walker's term .Also elected in 1820 to the next term .Redistricted to the 10th district . David White (New Castle ) Democratic-Republican March 4, 1823 – 18th Elected in 1822 . 1823–1833 Franklin , Gallatin , Henry , Owen , and Shelby counties Joseph Lecompte (New Castle ) Jacksonian March 4, 1825 – 19th 20th 21st 22nd Elected in 1824 .Re-elected in 1827 .Re-elected in 1829 .Re-elected in 1831 . Thomas Chilton (Elizabethtown ) Anti-Jacksonian March 4, 1833 – 23rd Elected in 1833 . 1833–1843 [ data missing ] John Calhoon (Hardinsburg ) Anti-Jacksonian March 4, 1835 – 24th 25th Elected in 1835 .Re-elected in 1837 . Whig March 4, 1837 – Willis Green (Green ) Whig March 4, 1839 – 26th 27th Elected in 1839 .Re-elected in 1841 .Redistricted to the 2nd district . John White (Richmond ) Whig March 4, 1843 – 28th Redistricted from the 9th district and re-elected in 1843 . 1843–1853 [ data missing ] John P. Martin (Prestonburg ) Democratic March 4, 1845 – 29th Elected in 1845 . Green Adams (Barbourville ) Whig March 4, 1847 – 30th Elected in 1847 . Daniel Breck (Richmond ) Whig March 4, 1849 – 31st Elected in 1849 . Addison White (Richmond ) Whig March 4, 1851 – 32nd Elected in 1851 . John M. Elliott (Prestonburg ) Democratic March 4, 1853 – 33rd 34th 35th Elected in 1853 .Re-elected in 1855 .Re-elected in 1857 . 1853–1863 [ data missing ] Green Adams (Barbourville ) Opposition March 4, 1859 – 36th Elected in 1859 . George W. Dunlap (Lancaster ) Union Democratic March 4, 1861 – 37th Elected in 1861 . Green C. Smith (Covington ) Union Democratic March 4, 1863 – 38th Elected in 1863 . 1863–1873 [ data missing ] Unconditional Union 39th Re-elected in 1865 .Governor of Montana Territory . Vacant July 13, 1866 – 39th Andrew H. Ward (Cynthiana ) Democratic December 3, 1866 – Elected to finish Smith's term . Thomas L. Jones (Newport ) Democratic March 4, 1867 – 40th 41st Elected in 1867 .Re-elected in 1868 . William E. Arthur (Covington ) Democratic March 4, 1871 – 42nd 43rd Elected in 1870 .Re-elected in 1872 . 1873–1883 [ data missing ] Thomas L. Jones (Newport ) Democratic March 4, 1875 – 44th Elected in 1874 . John G. Carlisle (Covington ) Democratic March 4, 1877 – 45th 46th 47th 48th 49th 50th 51st Elected in 1876 .Re-elected in 1878 .Re-elected in 1880 .Re-elected in 1882 .Re-elected in 1884 .Re-elected in 1886 .Re-elected in 1888 .elected U.S. senator . 1883–1893 [ data missing ] Vacant May 26, 1890 – 51st William W. Dickerson (Williamstown ) Democratic June 21, 1890 – 51st 52nd Elected to finish Carlisle's term .Re-elected in 1890 . Albert S. Berry (Newport ) Democratic March 4, 1893 – 53rd 54th 55th 56th Elected in 1892 .Re-elected in 1894 .Re-elected in 1896 .Re-elected in 1898 . 1893–1903 [ data missing ] Daniel Linn Gooch (Covington ) Democratic March 4, 1901 – 57th 58th Elected in 1900 .Re-elected in 1902 . 1903–1913 [ data missing ] Joseph L. Rhinock (Covington ) Democratic March 4, 1905 – 59th 60th 61st Elected in 1904 .Re-elected in 1906 .Re-elected in 1908 . Arthur B. Rouse (Burlington ) Democratic March 4, 1911 – 62nd 63rd 64th 65th 66th 67th 68th 69th Elected in 1910 .Re-elected in 1912 .Re-elected in 1914 .Re-elected in 1916 .Re-elected in 1918 .Re-elected in 1920 .Re-elected in 1922 .Re-elected in 1924 . 1913–1933 Orie S. Ware (Covington ) Democratic March 4, 1927 – 70th Elected in 1926 . J. Lincoln Newhall (Covington ) Republican March 4, 1929 – 71st Elected in 1928 . Brent Spence (Fort Thomas ) Democratic March 4, 1931 – 72nd Elected in 1930 .Redistricted to the at-large district . District inactive March 4, 1933 – 73rd Virgil Chapman (Paris ) Democratic January 3, 1935 – 74th 75th 76th 77th 78th 79th 80th Redistricted from the at-large district and re-elected in 1934 .Re-elected in 1936 .Re-elected in 1938 .Re-elected in 1940 .Re-elected in 1942 .Re-elected in 1944 .Re-elected in 1946 .run for U.S. senator . 1935–1953 Thomas R. Underwood (Lexington ) Democratic January 3, 1949 – 81st 82nd Elected in 1948 .Re-elected in 1950 .U.S. senator . Vacant March 17, 1951 – 82nd John C. Watts (Nicholasville ) Democratic April 4, 1951 – 82nd 83rd 84th 85th 86th 87th 88th 89th 90th 91st 92nd Elected to finish Underwood's term .Re-elected in 1952 .Re-elected in 1954 .Re-elected in 1956 .Re-elected in 1958 .Re-elected in 1960 .Re-elected in 1962 .Re-elected in 1964 .Re-elected in 1966 .Re-elected in 1968 .Re-elected in 1970 . 1953–1957 1957–1963 1963–1967 1967–1973 Vacant September 24, 1971 – 92nd William P. Curlin Jr. (Frankfort ) Democratic December 4, 1971 – Elected to finish Watts's term . John B. Breckinridge (Lexington ) Democratic January 3, 1973 – 93rd 94th 95th Elected in 1972 .Re-elected in 1974 .Re-elected in 1976 . 1973–1983 Larry Hopkins (Lexington ) Republican January 3, 1979 – 96th 97th 98th 99th 100th 101st 102nd Elected in 1978 .Re-elected in 1980 .Re-elected in 1982 .Re-elected in 1984 .Re-elected in 1986 .Re-elected in 1988 .Re-elected in 1990 . 1983–1993 Scotty Baesler (Lexington ) Democratic January 3, 1993 – 103rd 104th 105th Elected in 1992 .Re-elected in 1994 .Re-elected in 1996 .run for U.S. senator . 1993–1997 1997–2003 Ernie Fletcher (Lexington ) Republican January 3, 1999 – 106th 107th 108th Elected in 1998 .Re-elected in 2000 .Re-elected in 2002 .elected Governor of Kentucky . 2003–2013 Vacant December 8, 2003 – 108th Ben Chandler (Versailles ) Democratic February 17, 2004 – 108th 109th 110th 111th 112th Elected to finish Fletcher's term .Re-elected in 2004 .Re-elected in 2006 .Re-elected in 2008 .Re-elected in 2010 . Andy Barr (Lexington ) Republican January 3, 2013 – 113th 114th 115th 116th 117th 118th 119th Elected in 2012 .Re-elected in 2014 .Re-elected in 2016 .Re-elected in 2018 .Re-elected in 2020 .Re-elected in 2022 .Re-elected in 2024 .run for U.S. Senate . 2013–2023 2023–present