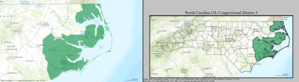
Member(Residence) Party Years Cong Electoral history District location District established April 6, 1790 Timothy Bloodworth (Wilmington ) Anti-Administration April 6, 1790 – 1st Elected in 1790 .Redistricted to the 5th district and lost re-election. 1790–1971 John B. Ashe (Halifax ) Anti-Administration March 4, 1791 – 2nd Redistricted from the 1st district and re-elected in 1791 .Redistricted to the 9th district . 1791–1973 [ data missing ] Joseph Winston (Surry County ) Anti-Administration March 4, 1793 – 3rd Elected in 1793 . 1793–1803 [ data missing ] Jesse Franklin (Orange County ) Democratic-Republican March 4, 1795 – 4th Elected in 1795 . Robert Williams (Surry County ) Democratic-Republican March 4, 1797 – 5th 6th 7th Elected in 1796 .Re-elected in 1798 .Re-elected in 1800 .Redistricted to the 7th district and retired to run for governor of North Carolina . William Kennedy (Washington ) Democratic-Republican March 4, 1803 – 8th Elected in 1803 . 1803–1813 "North Carolina congressional district map (1803–13)" . [ 16] Thomas Blount (Tarboro ) Democratic-Republican March 4, 1805 – 9th 10th Elected in 1804 .Re-elected in 1806 . William Kennedy (Washington ) Democratic-Republican March 4, 1809 – 11th Elected in 1808 . Thomas Blount (Tarboro ) Democratic-Republican March 4, 1811 – 12th Elected in 1810 . Vacant February 7, 1812 – 12th William Kennedy (Washington ) Democratic-Republican January 30, 1813 – 13th Elected January 11, 1813, to finish Blount's term and seated January 30, 1813.Re-elected in 1813 . 1813–1823 "North Carolina congressional district map (1813–43)" . [ 16] James W. Clark (Tarboro ) Democratic-Republican March 4, 1815 – 14th Elected in 1815 . Thomas H. Hall (Tarboro ) Democratic-Republican March 4, 1817 – 15th 16th 17th 18th Elected in 1817 .Re-elected in 1819 .Re-elected in 1821 .Re-elected in 1823 . Democratic-Republican 1823–1833 "North Carolina congressional district map (1813–43)" . [ 16] Richard Hines (Tarboro ) Jacksonian March 4, 1825 – 19th Elected in 1825 . Thomas H. Hall (Tarboro ) Jacksonian March 4, 1827 – 20th 21st 22nd 23rd Elected in 1827 .Re-elected in 1829 .Re-elected in 1831 .Re-elected in 1833 .[ data missing ] 1833–1843 "North Carolina congressional district map (1813–43)" . [ 16] Ebenezer Pettigrew (Cool Springs ) Anti-Jacksonian March 4, 1835 – 24th Elected in 1835 .[ data missing ] Edward Stanly (Washington ) Whig March 4, 1837 – 25th 26th 27th Elected in 1837 .Re-elected in 1839 .Re-elected in 1841 .[ data missing ] David S. Reid (Reidsville ) Democratic March 4, 1843 – 28th 29th Elected in 1843 .Re-elected in 1845 .[ data missing ] 1843–1853 [ data missing ] Daniel M. Barringer (Concord ) Whig March 4, 1847 – 30th Redistricted from the 2nd district and re-elected in 1847 .[ data missing ] Edmund Deberry (Mount Gilead ) Whig March 4, 1849 – 31st Elected in 1849 .[ data missing ] Alfred Dockery (Dockery's Store ) Whig March 4, 1851 – 32nd Elected in 1851 .[ data missing ] William S. Ashe (Wilmington ) Democratic March 4, 1853 – 33rd Redistricted from the 7th district and re-elected in 1853 .[ data missing ] 1853–1861 [ data missing ] Warren Winslow (Fayetteville ) Democratic March 4, 1855 – 34th 35th 36th Elected in 1855 .Re-elected in 1857 .Re-elected in 1859 .[ data missing ] Vacant March 3, 1861 – 37th 38th 39th 40th Civil War and Reconstruction Oliver H. Dockery (Mangum ) Republican July 13, 1868 – 40th 41st Elected to finish the short term .Re-elected in 1868 .[ data missing ] 1868–1873 [ data missing ] Alfred M. Waddell (Wilmington ) Democratic March 4, 1871 – 42nd 43rd 44th 45th Elected in 1870 .Re-elected in 1872 .Re-elected in 1874 .Re-elected in 1876 .[ data missing ] 1873–1883 [ data missing ] Daniel L. Russell (Wilmington ) Greenback March 4, 1879 – 46th Elected in 1878 .[ data missing ] John W. Shackelford (Jacksonville ) Democratic March 4, 1881 – 47th Elected in 1880 . Vacant January 18, 1883 – Wharton J. Green (Fayetteville ) Democratic March 4, 1883 – 48th 49th Elected in 1882 .Re-elected in 1884 .[ data missing ] 1883–1893 [ data missing ] Charles W. McClammy (Scotts Hill ) Democratic March 4, 1887 – 50th 51st Elected in 1886 .Re-elected in 1888 .[ data missing ] Benjamin F. Grady (Wallace ) Democratic March 4, 1891 – 52nd 53rd Elected in 1890 .Re-elected in 1892 .[ data missing ] 1893–1903 [ data missing ] John G. Shaw (Fayetteville ) Democratic March 4, 1895 – 54th Elected in 1894 .[ data missing ] John E. Fowler (Clinton ) Populist March 4, 1897 – 55th Elected in 1896 .[ data missing ] Charles R. Thomas (New Bern ) Democratic March 4, 1899 – 56th 57th 58th 59th 60th 61st Elected in 1898 .Re-elected in 1900 .Re-elected in 1902 .Re-elected in 1904 .Re-elected in 1906 .Re-elected in 1908 .[ data missing ] 1903–1913 [ data missing ] John M. Faison (Faison ) Democratic March 4, 1911 – 62nd 63rd Elected in 1910 .Re-elected in 1912 .[ data missing ] 1913–1933 [ data missing ] George E. Hood (Goldsboro ) Democratic March 4, 1915 – 64th 65th Elected in 1914 .Re-elected in 1916 .[ data missing ] Samuel M. Brinson (New Bern ) Democratic March 4, 1919 – 66th 67th Elected in 1918 .Re-elected in 1920 . Vacant April 13, 1922 – 67th Charles L. Abernethy (New Bern ) Democratic November 7, 1922 – 67th 68th 69th 70th 71st 72nd 73rd Elected to finish Brinson's term .Re-elected in 1922 .Re-elected in 1924 .Re-elected in 1926 .Re-elected in 1928 .Re-elected in 1930 .Re-elected in 1932 . 1933–1943 [ data missing ] Graham A. Barden (New Bern ) Democratic January 3, 1935 – 74th 75th 76th 77th 78th 79th 80th 81st 82nd 83rd 84th 85th 86th Elected in 1934 .Re-elected in 1936 .Re-elected in 1938 .Re-elected in 1940 .Re-elected in 1942 .Re-elected in 1944 .Re-elected in 1946 .Re-elected in 1948 .Re-elected in 1950 .Re-elected in 1952 .Re-elected in 1954 .Re-elected in 1956 .Re-elected in 1958 . 1943–1953 [ data missing ] 1953–1963 [ data missing ] David N. Henderson (Wallace ) Democratic January 3, 1961 – 87th 88th 89th 90th 91st 92nd 93rd 94th Elected in 1960 .Re-elected in 1962 .Re-elected in 1964 .Re-elected in 1966 .Re-elected in 1968 .Re-elected in 1970 .Re-elected in 1972 .Re-elected in 1974 . 1963–1973 [ data missing ] 1973–1983 [ data missing ] Charles O. Whitley (Mount Olive ) Democratic January 3, 1977 – 95th 96th 97th 98th 99th Elected in 1976 .Re-elected in 1978 .Re-elected in 1980 .Re-elected in 1982 .Re-elected in 1984 . 1983–1993 [ data missing ] Vacant December 31, 1986 – 99th Martin Lancaster (Goldsboro ) Democratic January 3, 1987 – 100th 101st 102nd 103rd Elected in 1986 .Re-elected in 1988 .Re-elected in 1990 .Re-elected in 1992 . 1993–2003 [ data missing ] Walter B. Jones Jr. (Farmville ) Republican January 3, 1995 – 104th 105th 106th 107th 108th 109th 110th 111th 112th 113th 114th 115th 116th Elected in 1994 .Re-elected in 1996 .Re-elected in 1998 .Re-elected in 2000 .Re-elected in 2002 .Re-elected in 2004 .Re-elected in 2006 .Re-elected in 2008 .Re-elected in 2010 .Re-elected in 2012 .Re-elected in 2014 .Re-elected in 2016 .Re-elected in 2018 . 2003–2013 2013–2017 2017–2021 Vacant February 10, 2019 – 116th Greg Murphy (Greenville ) Republican September 10, 2019 – 116th 117th 118th 119th Elected to finish Jones's term .Re-elected in 2020 .Re-elected in 2022 .Re-elected in 2024 . 2021–2023 Static map of 2021-3 congressional district 2023–2025 2025–present