Wabash County, Illinois

Last updated

Wabash County
Wabash County Courthouse in Mount Carmel.jpg
Wabash County Courthouse in Mount Carmel
Map of Illinois highlighting Wabash County.svg
Location within the U.S. state of Illinois
Illinois in United States.svg
Illinois's location within the U.S.
Coordinates: 38°26′N87°50′W / 38.44°N 87.84°W / 38.44; -87.84
CountryFlag of the United States.svg United States
StateFlag of Illinois.svg Illinois
Founded1824
Named after Wabash River
Seat Mount Carmel
Largest cityMount Carmel
Area
  Total
228 sq mi (590 km2)
  Land223 sq mi (580 km2)
  Water4.3 sq mi (11 km2)  1.9%
Population
 (2020)
  Total
11,361
  Estimate 
(2024)
10,979 Decrease2.svg [1]
  Density50/sq mi (19/km2)
Time zone UTC−6 (Central)
  Summer (DST) UTC−5 (CDT)
Congressional district 12th
Cherry St. in Mount Carmel, still paved in brick, is home to many interesting examples of around the start of the 20th century architecture Mount Carmel Cherry St.JPG
Cherry St. in Mount Carmel, still paved in brick, is home to many interesting examples of around the start of the 20th century architecture

Wabash County is a county located in the U.S. state of Illinois. According to the 2020 census, it had a population of 11,361. [2] Its county seat is Mount Carmel. [3] It is located in the southern portion of Illinois known locally as "Little Egypt".

Contents

History

Wabash County was formed in 1824 out of Edwards County. This averted to an armed confrontation between the militias of Albion and Mt. Carmel after the county seat was moved from a town near the current city of Mount Carmel to Albion.

The county is named for the Wabash River, which forms its eastern and southern borders. The name "Wabash" is an English spelling of the French name for the river, "Ouabache."' French traders named the river after the Miami Indian word for the river, "Wabashike," (pronounced "Wah-bah-she-keh"), the word for "pure white." Much of the river bottom is white limestone, now obscured by mud.

A 329 acres (1.33 km2) remnant of the county's original Eastern Woodlands ecosystem can be found in the Forest of the Wabash, located within the county's Beall Woods State Park.

In the 1920s a notable hotel and resort operated in Wabash County nearby the Grand Rapids Dam on the Wabash River. Named the Grand Rapids Hotel, it was owned by Frederick Hinde Zimmerman. During the hotel's nine-year existence, it catered to individuals from all over the United States. In July 2011, John Matthew Nolan published a detailed history of the Grand Rapids Hotel.

Earthquake

On the morning of April 18, 2008, at 4:37am local time, one of the largest earthquakes in Illinois history hit the area. The epicenter of this tremor was in Lick Prairie Township, near the middle of the county. The tremor was felt for a wide radius, more than 400 miles away in Nebraska. [4]

Geography

Bridge on Illinois Route 15 connecting Wabash and Gibson counties. This span no longer exists. Mount Carmel bridge 2007.JPG
Bridge on Illinois Route 15 connecting Wabash and Gibson counties. This span no longer exists.

According to the U.S. Census Bureau, the county has a total area of 228 square miles (590 km2), of which 223 square miles (580 km2) is land and 4.3 square miles (11 km2) (1.9%) is water. [5] It is the fifth-smallest county in Illinois by area.

The Wabash River to the east and the Bonpas Creek to the west join at the southern tip of the county; the Bonpas Creek separating the two counties, Wabash County from the Edwards County.

Climate and weather

Mount Carmel, Illinois
Climate chart (explanation)
J
F
M
A
M
J
J
A
S
O
N
D
 
 
2.9
 
 
38
21
 
 
2.7
 
 
44
25
 
 
4.2
 
 
54
35
 
 
4.2
 
 
66
44
 
 
5.1
 
 
76
54
 
 
3.7
 
 
85
63
 
 
4.2
 
 
89
67
 
 
3.6
 
 
87
65
 
 
2.8
 
 
81
57
 
 
3
 
 
70
45
 
 
4.2
 
 
55
36
 
 
3.1
 
 
43
25
Average max. and min. temperatures in °F
Precipitation totals in inches
Source: The Weather Channel [6]
Metric conversion
J
F
M
A
M
J
J
A
S
O
N
D
 
 
74
 
 
3
−6
 
 
69
 
 
7
−4
 
 
105
 
 
12
2
 
 
108
 
 
19
7
 
 
130
 
 
24
12
 
 
94
 
 
29
17
 
 
108
 
 
32
19
 
 
92
 
 
31
18
 
 
71
 
 
27
14
 
 
77
 
 
21
7
 
 
106
 
 
13
2
 
 
77
 
 
6
−4
Average max. and min. temperatures in °C
Precipitation totals in mm

In recent years, average temperatures in the county seat of Mount Carmel have ranged from a low of 21 °F (−6 °C) in January to a high of 89 °F (32 °C) in July, although a record low of −19 °F (−28 °C) was recorded in January 1985 and a record high of 102 °F (39 °C) was recorded in July 1988. Average monthly precipitation ranged from 2.73 inches (69 mm) in February to 5.12 inches (130 mm) in May. [6]

Transit

Major highways

Adjacent counties

Demographics

Historical population
CensusPop.Note
1830 2,710
1840 4,24056.5%
1850 4,69010.6%
1860 7,31355.9%
1870 8,84120.9%
1880 9,94512.5%
1890 11,86619.3%
1900 12,5836.0%
1910 14,91318.5%
1920 14,034−5.9%
1930 13,197−6.0%
1940 13,7244.0%
1950 14,6516.8%
1960 14,047−4.1%
1970 12,841−8.6%
1980 13,7136.8%
1990 13,111−4.4%
2000 12,937−1.3%
2010 11,947−7.7%
2020 11,361−4.9%
2023 (est.)10,942 [7] −3.7%
U.S. Decennial Census [8]
1790-1960 [9] 1900-1990 [10]
1990-2000 [11] 2010-2013 [2]

2020 census

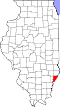
Wabash County, Illinois – Racial and ethnic composition
Note: the US Census treats Hispanic/Latino as an ethnic category. This table excludes Latinos from the racial categories and assigns them to a separate category. Hispanics/Latinos may be of any race.
Race / Ethnicity (NH = Non-Hispanic)Pop 1980 [12] Pop 1990 [13] Pop 2000 [14] Pop 2010 [15] Pop 2020 [16] % 1980% 1990% 2000% 2010% 2020
White alone (NH)13,54212,91112,60211,49810,52098.75%98.47%97.41%96.24%92.60%
Black or African American alone (NH)22355173530.16%0.27%0.39%0.61%0.47%
Native American or Alaska Native alone (NH)35112117150.26%0.08%0.16%0.14%0.13%
Asian alone (NH)458057632510.33%0.61%0.44%0.53%2.21%
Native Hawaiian or Pacific Islander alone (NH)x [17] x [18] 656xx0.05%0.04%0.05%
Other race alone (NH)21310150.01%0.01%0.02%0.08%0.13%
Mixed race or Multiracial (NH)x [19] x [20] 102123323xx0.79%1.03%2.84%
Hispanic or Latino (any race)6773951581780.49%0.56%0.73%1.32%1.57%
Total13,71313,11112,93711,94711,361 100.00%100.00%100.00%100.00%100.00%

2010 census

As of the 2010 United States census, there were 11,947 people, 5,012 households, and 3,310 families residing in the county. [21] The population density was 53.5 inhabitants per square mile (20.7/km2). There were 5,585 housing units at an average density of 25.0 per square mile (9.7/km2). [5] The racial makeup of the county was 96.9% white, 0.6% black or African American, 0.6% Asian, 0.2% American Indian, 0.5% from other races, and 1.1% from two or more races. Those of Hispanic or Latino origin made up 1.3% of the population. [21] In terms of ancestry, 25.6% were German, 12.3% were English, 11.7% were American, and 8.4% were Irish. [22]

Of the 5,012 households, 29.0% had children under the age of 18 living with them, 52.9% were married couples living together, 9.3% had a female householder with no husband present, 34.0% were non-families, and 29.4% of all households were made up of individuals. The average household size was 2.37 and the average family size was 2.91. The median age was 42.0 years. [21]

The median income for a household in the county was $46,026 and the median income for a family was $55,611. Males had a median income of $44,932 versus $28,292 for females. The per capita income for the county was $23,350. About 7.2% of families and 13.0% of the population were below the poverty line, including 12.2% of those under age 18 and 8.6% of those age 65 or over. [23]

Communities

Cities

Villages

Unincorporated communities

Precincts

Wabash County is one of 17 Illinois counties that use the term precinct instead of township.

Precincts of Wabash County Wabash County, IL.png
Precincts of Wabash County

Wabash County precincts and their boundaries

Politics

United States presidential election results for Wabash County, Illinois [24]
Year Republican Democratic Third party(ies)
No.%No.%No.%
2024 4,09575.93%1,20022.25%981.82%
2020 4,23775.57%1,25322.35%1172.09%
2016 4,04774.07%1,15121.07%2664.87%
2012 3,47867.74%1,59030.97%661.29%
2008 3,25456.16%2,46242.49%781.35%
2004 4,21270.13%1,75229.17%420.70%
2000 3,40661.84%1,98736.07%1152.09%
1996 2,38145.15%2,17741.28%71613.58%
1992 2,48539.82%2,43639.04%1,31921.14%
1988 3,45360.30%2,24139.14%320.56%
1984 3,63966.73%1,79532.92%190.35%
1980 3,57161.18%1,97533.84%2914.99%
1976 3,38854.41%2,78144.66%580.93%
1972 4,31068.35%1,98531.48%110.17%
1968 3,52955.21%2,24435.11%6199.68%
1964 2,90543.84%3,72156.16%00.00%
1960 4,26158.55%3,01341.40%40.05%
1956 4,42561.92%2,71337.97%80.11%
1952 4,24661.38%2,66138.47%100.14%
1948 2,91649.44%2,85748.44%1252.12%
1944 3,49652.95%3,02645.83%811.23%
1940 3,65945.94%4,18752.57%1191.49%
1936 2,86039.59%4,21458.33%1502.08%
1932 2,30934.49%4,28063.93%1061.58%
1928 2,37337.26%3,95562.10%410.64%
1924 2,56445.61%2,44243.44%61510.94%
1920 2,87152.40%2,51445.88%941.72%
1916 2,60042.41%3,26453.24%2674.35%
1912 60118.08%1,67650.41%1,04831.52%
1908 1,51143.06%1,81451.70%1845.24%
1904 1,29844.57%1,30044.64%31410.78%
1900 1,22640.96%1,64354.89%1244.14%
1896 1,32142.22%1,73955.58%692.21%
1892 1,11240.69%1,42852.25%1937.06%

Education

School districts include: [25]

See also

References

  1. "County Population Totals and Components of Change: 2020–2024". United States Census Bureau. U.S. Department of Commerce. March 2025. Retrieved August 31, 2025.
  2. 1 2 "QuickFacts". United States Census Bureau . Retrieved January 23, 2023.
  3. "Find a County". National Association of Counties. Retrieved June 7, 2011.
  4. Jim Suhr, Associated Press (April 18, 2008). "5.2 earthquake rattles skyscrapers, nerves across Midwest". San Francisco Chronicle . It was the kind of tremor that might be ignored in earthquake-savvy California, but the temblor shook things up from Nebraska to Atlanta and rattled nerves in Milwaukee, Cincinnati and Louisville, Ky., where bricks toppled to the pavement... Dozens of aftershocks followed, including one with a magnitude of 4.6.
  5. 1 2 "Population, Housing Units, Area, and Density: 2010 - County". United States Census Bureau. Archived from the original on February 13, 2020. Retrieved July 12, 2015.
  6. 1 2 "Monthly Averages for Mount Carmel, Illinois". The Weather Channel. Retrieved January 27, 2011.
  7. "Annual Estimates of the Resident Population for Counties: April 1, 2020 to July 1, 2023". United States Census Bureau. Retrieved April 2, 2024.
  8. "U.S. Decennial Census". United States Census Bureau. Retrieved July 9, 2014.
  9. "Historical Census Browser". University of Virginia Library. Retrieved July 9, 2014.
  10. "Population of Counties by Decennial Census: 1900 to 1990". United States Census Bureau. Retrieved July 9, 2014.
  11. "Census 2000 PHC-T-4. Ranking Tables for Counties: 1990 and 2000" (PDF). United States Census Bureau. Retrieved July 9, 2014.
  12. "1980 Census of Population - General Population Characteristics - Illinois- Table 14 - Persons by Race and Table 16 (p. 18-28) - Total Persons and Spanish Origin Persons by Type of Spanish Origin and Race (p. 29-39)" (PDF). United States Census Bureau .
  13. "1990 Census of Population - General Population Characteristics - Illinois - Table 6 - Race and Hispanic Orogin" (PDF). United States Census Bureau .
  14. "P004: Hispanic or Latino, and Not Hispanic or Latino by Race – 2000: DEC Summary File 1 – Wabash County, Illinois". United States Census Bureau .
  15. "P2: Hispanic or Latino, and Not Hispanic or Latino by Race – 2010: DEC Redistricting Data (PL 94-171) – Wabash County, Illinois". United States Census Bureau .
  16. "P2: Hispanic or Latino, and Not Hispanic or Latino by Race – 2020: DEC Redistricting Data (PL 94-171) – Wabash County, Illinois". United States Census Bureau .
  17. included in the Asian category in the 1980 Census
  18. included in the Asian category in the 1990 Census
  19. not an option in the 1980 Census
  20. not an option in the 1990 Census
  21. 1 2 3 "DP-1 Profile of General Population and Housing Characteristics: 2010 Demographic Profile Data". United States Census Bureau. Archived from the original on February 13, 2020. Retrieved July 12, 2015.
  22. "DP02 SELECTED SOCIAL CHARACTERISTICS IN THE UNITED STATES – 2006-2010 American Community Survey 5-Year Estimates". United States Census Bureau. Archived from the original on February 13, 2020. Retrieved July 12, 2015.
  23. "DP03 SELECTED ECONOMIC CHARACTERISTICS – 2006-2010 American Community Survey 5-Year Estimates". United States Census Bureau. Archived from the original on February 13, 2020. Retrieved July 12, 2015.
  24. Leip, David. "Dave Leip's Atlas of U.S. Presidential Elections". uselectionatlas.org. Retrieved November 13, 2018.
  25. "2020 CENSUS - SCHOOL DISTRICT REFERENCE MAP: Wabash County, IL" (PDF). U.S. Census Bureau . Retrieved June 15, 2024. - Text list