Platte County, Missouri | |
|---|---|
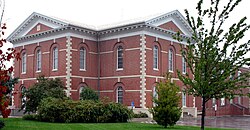 Platte County Courthouse | |
 Location within the U.S. state of Missouri | |
| Coordinates: 39°23′N94°46′W / 39.38°N 94.77°W | |
| Country | |
| State | |
| Founded | December 31, 1838 |
| Named after | Platte River or Platte Purchase |
| Seat | Platte City |
| Largest city | Kansas City |
| Area | |
• Total | 427 sq mi (1,110 km2) |
| • Land | 420 sq mi (1,100 km2) |
| • Water | 6.6 sq mi (17 km2) 1.5% |
| Population (2020) | |
• Total | 106,718 |
| • Density | 250/sq mi (98/km2) |
| Time zone | UTC−6 (Central) |
| • Summer (DST) | UTC−5 (CDT) |
| Congressional district | 6th |
| Website | www |
Platte County is a county located in the northwestern portion of the U.S. state of Missouri and is part of the Kansas City metropolitan area. As of the 2020 census, the population was 106,718. Its county seat is Platte City. [1] The county was organized December 31, 1838, [2] from the Platte Purchase, [3] named for the Platte River. (Platte is derived from the French word for a low, shallow, or intermittent stream.) The Kansas City International Airport is located in the county, approximately one mile west of Interstate 29 between mile markers 12 and 15. The land for the airport was originally in an unincorporated portion of Platte County before being annexed by Platte City, and eventually Kansas City.
Contents
- Geography
- Adjacent counties
- Major highways
- Demographics
- 2020 census
- Racial and ethnic composition
- 2000 census
- Education
- School districts
- Public schools
- Private schools
- College and universities
- Public libraries
- Communities
- Cities
- Villages
- Civil townships
- Census-designated place
- Unincorporated communities
- Population ranking
- Politics
- Local
- State
- Federal
- Missouri presidential preference primary (2008)
- See also
- References
- External links
