![]() | ||||||||||||||||||||||
| ||||||||||||||||||||||
A Proposed Law: To alter the Constitution to recognise the First Peoples of Australia by establishing an Aboriginal and Torres Strait Islander Voice. Do you approve this proposed alteration? | ||||||||||||||||||||||
Outcome | Not carried. A majority "no" vote nationally and in all states. | |||||||||||||||||||||
---|---|---|---|---|---|---|---|---|---|---|---|---|---|---|---|---|---|---|---|---|---|---|
Website | Official results | |||||||||||||||||||||
Results | ||||||||||||||||||||||
| ||||||||||||||||||||||
Results by state or territory, and division |
This article is part of a series on the |
Aboriginal and Torres Strait Islander Voice |
---|
Proposed Australian federal Indigenous advisory body to represent Indigenous communities. |
The 2023 Australian Indigenous Voice referendum was held on 14 October 2023. [1] Voters were asked if they approved an alteration to the Australian Constitution that would recognise Indigenous Australians in the document through prescribing a body called the Aboriginal and Torres Strait Islander Voice. The referendum failed to get either of the two majorities in favour that were both required for the Constitution to be changed: [2]
Choice | Votes | % |
---|---|---|
![]() | 9,452,792 | 60.06 |
Yes | 6,286,894 | 39.94 |
Valid votes | 15,739,686 | 99.02 |
Invalid or blank votes | 155,545 | 0.98 |
Total votes | 15,895,231 | 100.00 |
Registered voters/turnout | 17,671,784 | 89.95 |
Source: Australian Electoral Commission [3] |
Votes cast in the territories are included in the national total for the purposes of determining a national majority, but the territories are not counted for the purposes of determining a majority of states.
State/territory | Yes | No | Invalid | Turnout (%) | ||
---|---|---|---|---|---|---|
Votes | % | Votes | % | |||
New South Wales | 2,058,764 | 41.04 | 2,957,880 | 58.96 | 57,285 | 90.80 |
Victoria | 1,846,623 | 45.85 | 2,180,851 | 54.15 | 39,038 | 91.00 |
Queensland | 1,010,416 | 31.79 | 2,167,957 | 68.21 | 27,266 | 88.25 |
Western Australia | 582,077 | 36.73 | 1,002,740 | 63.27 | 13,454 | 87.50 |
South Australia | 417,745 | 35.83 | 748,318 | 64.17 | 11,478 | 91.75 |
Tasmania | 152,171 | 41.06 | 218,425 | 58.94 | 3,967 | 92.03 |
Northern Territory [lower-alpha 1] | 43,076 | 39.70 | 65,429 | 60.30 | 820 | 71.45 |
Australian Capital Territory [lower-alpha 2] | 176,022 | 61.29 | 111,192 | 38.71 | 2,237 | 91.36 |
Total for Commonwealth | 6,286,894 | 39.94 | 9,125,294 | 60.06 | 155,545 | 89.92 |
Results | Obtained a majority in no state and an overall minority of 2,838,400 votes. Not carried. |
Electorate | Yes votes | Yes (%) | No votes | No (%) | Informal votes | Informal (%) | Total votes | Turnout (%) | Enrolment | Parliamentary seat held by | State |
---|---|---|---|---|---|---|---|---|---|---|---|
Adelaide | 57,227 | 49.34 | 58,769 | 50.66 | 1,215 | 1.04 | 117,211 | 90.05 | 130,242 | Labor | South Australia |
Aston | 43,201 | 42.08 | 59,473 | 57.92 | 1,080 | 1.04 | 103,754 | 93.14 | 111,346 | Labor | Victoria |
Ballarat | 43,941 | 42.11 | 60,399 | 57.89 | 1,060 | 1.01 | 105,400 | 92.80 | 113,517 | Labor | Victoria |
Banks | 38,228 | 38.95 | 59,925 | 61.05 | 1,357 | 1.36 | 99,510 | 91.41 | 108,813 | Liberal | New South Wales |
Barker | 25,159 | 21.89 | 89,769 | 78.11 | 993 | 0.86 | 115,921 | 93.17 | 124,478 | Liberal | South Australia |
Barton | 44,475 | 45.03 | 54,290 | 54.97 | 1,440 | 1.44 | 100,205 | 88.94 | 112,630 | Labor | New South Wales |
Bass | 27,747 | 38.32 | 44,670 | 61.68 | 761 | 1.04 | 73,178 | 91.45 | 80,005 | Liberal | Tasmania |
Bean | 56,937 | 56.34 | 44,131 | 43.66 | 886 | 0.87 | 101,954 | 91.71 | 111,159 | Labor | Australian Capital Territory |
Bendigo | 42,726 | 40.53 | 62,684 | 59.47 | 1,004 | 0.94 | 106,414 | 93.41 | 113,858 | Labor | Victoria |
Bennelong | 51,674 | 48.59 | 54,667 | 51.41 | 1,160 | 1.08 | 107,501 | 91.66 | 117,257 | Labor | New South Wales |
Berowra | 46,602 | 46.67 | 53,260 | 53.33 | 870 | 0.86 | 100,732 | 93.95 | 107,204 | Liberal | New South Wales |
Blair | 34,395 | 29.67 | 81,535 | 70.33 | 1,140 | 0.97 | 117,070 | 87.67 | 133,508 | Labor | Queensland |
Blaxland | 34,476 | 38.25 | 55,648 | 61.75 | 2,376 | 2.57 | 92,500 | 83.86 | 110,298 | Labor | New South Wales |
Bonner | 40,622 | 40.40 | 59,923 | 59.60 | 758 | 0.75 | 101,303 | 90.73 | 111,611 | Liberal | Queensland |
Boothby | 56,966 | 47.98 | 61,756 | 52.02 | 1,153 | 0.96 | 119,875 | 93.64 | 128,093 | Labor | South Australia |
Bowman | 30,282 | 28.14 | 77,314 | 71.86 | 883 | 0.81 | 108,479 | 90.93 | 119,263 | Liberal | Queensland |
Braddon | 21,159 | 27.85 | 54,810 | 72.15 | 844 | 1.10 | 76,813 | 91.90 | 83,548 | Liberal | Tasmania |
Bradfield | 52,255 | 52.11 | 48,025 | 47.89 | 899 | 0.89 | 101,179 | 92.34 | 109,572 | Liberal | New South Wales |
Brand | 32,193 | 30.82 | 72,252 | 69.18 | 937 | 0.89 | 105,382 | 85.42 | 123,313 | Labor | Western Australia |
Brisbane | 63,056 | 56.01 | 49,533 | 43.99 | 766 | 0.68 | 113,355 | 89.21 | 127,063 | Greens | Queensland |
Bruce | 42,401 | 42.45 | 57,495 | 57.55 | 1,098 | 1.09 | 100,994 | 88.05 | 114,664 | Labor | Victoria |
Burt | 32,786 | 33.42 | 65,326 | 66.58 | 863 | 0.87 | 98,975 | 84.30 | 117,372 | Labor | Western Australia |
Calare | 32,524 | 28.79 | 80,465 | 71.21 | 1,091 | 0.96 | 114,080 | 92.68 | 123,035 | Independent | New South Wales |
Calwell | 38,637 | 40.09 | 57,742 | 59.91 | 1,505 | 1.54 | 97,884 | 83.96 | 116,563 | Labor | Victoria |
Canberra | 65,294 | 70.59 | 27,205 | 29.41 | 622 | 0.67 | 93,121 | 91.48 | 101,799 | Labor | Australian Capital Territory |
Canning | 24,866 | 23.69 | 80,104 | 76.31 | 883 | 0.83 | 105,853 | 87.61 | 120,777 | Liberal | Western Australia |
Capricornia | 19,202 | 19.30 | 80,280 | 80.70 | 666 | 0.67 | 100,148 | 88.93 | 112,597 | Liberal | Queensland |
Casey | 45,674 | 42.37 | 62,122 | 57.63 | 1,114 | 1.02 | 108,910 | 93.85 | 116,010 | Liberal | Victoria |
Chifley | 44,557 | 40.43 | 65,659 | 59.57 | 1,576 | 1.41 | 111,792 | 87.73 | 127,400 | Labor | New South Wales |
Chisholm | 50,919 | 50.41 | 50,099 | 49.59 | 870 | 0.85 | 101,888 | 91.76 | 110,970 | Labor | Victoria |
Clark | 39,204 | 58.12 | 28,251 | 41.88 | 658 | 0.97 | 68,113 | 91.59 | 74,366 | Independent | Tasmania |
Cook | 37,660 | 36.74 | 64,834 | 63.26 | 1,072 | 1.04 | 103,566 | 92.54 | 111,879 | Liberal | New South Wales |
Cooper | 66,053 | 65.78 | 34,369 | 34.22 | 978 | 0.96 | 101,400 | 90.62 | 111,841 | Labor | Victoria |
Corangamite | 52,567 | 48.03 | 56,875 | 51.97 | 977 | 0.88 | 110,419 | 93.92 | 117,517 | Labor | Victoria |
Corio | 47,666 | 45.98 | 56,009 | 54.02 | 1,044 | 1.00 | 104,719 | 91.56 | 114,309 | Labor | Victoria |
Cowan | 39,995 | 37.51 | 66,628 | 62.49 | 1,201 | 1.11 | 107,824 | 86.67 | 124,354 | Labor | Western Australia |
Cowper | 40,377 | 34.01 | 78,358 | 65.99 | 1,428 | 1.19 | 120,163 | 90.98 | 131,991 | Nationals | New South Wales |
Cunningham | 55,620 | 51.86 | 51,624 | 48.14 | 1,210 | 1.12 | 108,454 | 91.58 | 118,357 | Labor | New South Wales |
Curtin | 55,891 | 51.45 | 52,741 | 48.55 | 833 | 0.76 | 109,465 | 90.07 | 121,506 | Independent | Western Australia |
Dawson | 19,921 | 19.98 | 79,797 | 80.02 | 738 | 0.73 | 100,456 | 88.15 | 113,930 | Liberal | Queensland |
Deakin | 51,213 | 48.45 | 54,494 | 51.55 | 919 | 0.86 | 106,626 | 93.42 | 114,108 | Liberal | Victoria |
Dickson | 36,517 | 34.58 | 69,083 | 65.42 | 834 | 0.78 | 106,434 | 91.78 | 115,957 | Liberal | Queensland |
Dobell | 38,298 | 35.50 | 69,585 | 64.50 | 1,267 | 1.16 | 109,150 | 90.69 | 120,311 | Labor | New South Wales |
Dunkley | 44,996 | 44.18 | 56,844 | 55.82 | 1,009 | 0.98 | 102,849 | 90.85 | 113,152 | Labor | Victoria |
Durack | 27,946 | 27.89 | 72,269 | 72.11 | 718 | 0.71 | 100,933 | 81.25 | 124,228 | Liberal | Western Australia |
Eden-Monaro | 43,323 | 39.77 | 65,615 | 60.23 | 1,076 | 0.98 | 110,014 | 93.69 | 117,366 | Labor | New South Wales |
Fadden | 29,902 | 26.41 | 83,337 | 73.59 | 1,349 | 1.18 | 114,588 | 86.99 | 131,655 | Liberal | Queensland |
Fairfax | 39,013 | 34.69 | 73,456 | 65.31 | 1,020 | 0.90 | 113,489 | 89.50 | 126,764 | Liberal | Queensland |
Farrer | 27,747 | 25.00 | 83,242 | 75.00 | 1,011 | 0.90 | 112,000 | 91.69 | 122,085 | Liberal | New South Wales |
Fenner | 53,791 | 57.44 | 39,856 | 42.56 | 729 | 0.77 | 94,376 | 90.87 | 103,856 | Labor | Australian Capital Territory |
Fisher | 36,509 | 31.39 | 79,814 | 68.61 | 1,175 | 1.00 | 117,498 | 89.28 | 131,550 | Liberal | Queensland |
Flinders | 44,984 | 42.65 | 60,499 | 57.35 | 1,037 | 0.97 | 106,520 | 92.50 | 115,098 | Liberal | Victoria |
Flynn | 16,454 | 16.28 | 84,617 | 83.72 | 631 | 0.62 | 101,702 | 88.65 | 114,727 | Liberal | Queensland |
Forde | 29,975 | 28.17 | 76,431 | 71.83 | 1,212 | 1.13 | 107,618 | 84.99 | 126,573 | Liberal | Queensland |
Forrest | 32,331 | 31.00 | 71,974 | 69.00 | 973 | 0.92 | 105,278 | 89.64 | 117,412 | Liberal | Western Australia |
Fowler | 38,684 | 39.82 | 58,466 | 60.18 | 1,743 | 1.76 | 98,893 | 87.73 | 112,695 | DLFCN | New South Wales |
Franklin | 38,267 | 50.61 | 37,339 | 49.39 | 757 | 0.99 | 76,363 | 93.28 | 81,864 | Labor | Tasmania |
Fraser | 56,054 | 57.04 | 42,226 | 42.96 | 1,037 | 1.04 | 99,317 | 87.48 | 113,489 | Labor | Victoria |
Fremantle | 49,949 | 46.99 | 56,341 | 53.01 | 988 | 0.92 | 107,278 | 88.78 | 120,803 | Labor | Western Australia |
Gellibrand | 52,917 | 52.51 | 47,852 | 47.49 | 910 | 0.89 | 101,679 | 89.33 | 113,775 | Labor | Victoria |
Gilmore | 45,511 | 38.62 | 72,332 | 61.38 | 1,135 | 0.95 | 118,978 | 92.00 | 129,210 | Labor | New South Wales |
Gippsland | 29,635 | 27.93 | 76,488 | 72.07 | 944 | 0.88 | 107,067 | 91.48 | 116,974 | Nationals | Victoria |
Goldstein | 57,942 | 56.16 | 45,235 | 43.84 | 821 | 0.79 | 103,998 | 92.97 | 111,802 | Independent | Victoria |
Gorton | 41,608 | 39.06 | 64,903 | 60.94 | 1,187 | 1.10 | 107,698 | 89.88 | 119,814 | Labor | Victoria |
Grayndler | 75,538 | 74.64 | 25,659 | 25.36 | 802 | 0.79 | 101,999 | 91.55 | 111,385 | Labor | New South Wales |
Greenway | 48,771 | 42.99 | 64,671 | 57.01 | 1,207 | 1.05 | 114,649 | 90.68 | 126,392 | Labor | New South Wales |
Grey | 23,377 | 20.56 | 90,305 | 79.44 | 940 | 0.82 | 114,622 | 90.61 | 126,508 | Liberal | South Australia |
Griffith | 61,128 | 56.02 | 47,994 | 43.98 | 962 | 0.87 | 110,084 | 89.12 | 123,514 | Greens | Queensland |
Groom | 24,894 | 23.68 | 80,253 | 76.32 | 711 | 0.67 | 105,858 | 91.26 | 115,961 | Liberal | Queensland |
Hasluck | 37,676 | 34.85 | 70,419 | 65.15 | 856 | 0.79 | 108,951 | 88.01 | 123,768 | Labor | Western Australia |
Hawke | 35,481 | 35.68 | 63,973 | 64.32 | 1,030 | 1.03 | 100,484 | 89.74 | 111,942 | Labor | Victoria |
Herbert | 24,921 | 24.31 | 77,586 | 75.69 | 741 | 0.72 | 103,248 | 86.27 | 119,667 | Liberal | Queensland |
Higgins | 60,789 | 61.14 | 38,634 | 38.86 | 749 | 0.75 | 100,172 | 91.01 | 110,036 | Labor | Victoria |
Hindmarsh | 45,307 | 38.44 | 72,565 | 61.56 | 1,276 | 1.07 | 119,148 | 91.85 | 129,776 | Labor | South Australia |
Hinkler | 21,535 | 19.57 | 88,488 | 80.43 | 762 | 0.69 | 110,785 | 89.99 | 123,073 | Liberal | Queensland |
Holt | 43,179 | 42.98 | 57,283 | 57.02 | 1,008 | 0.99 | 101,470 | 88.73 | 114,326 | Labor | Victoria |
Hotham | 51,982 | 49.80 | 52,394 | 50.20 | 1,171 | 1.11 | 105,547 | 89.44 | 117,958 | Labor | Victoria |
Hughes | 42,133 | 41.47 | 59,467 | 58.53 | 943 | 0.92 | 102,543 | 94.41 | 108,588 | Liberal | New South Wales |
Hume | 30,982 | 26.56 | 85,687 | 73.44 | 1,004 | 0.85 | 117,673 | 93.19 | 126,213 | Liberal | New South Wales |
Hunter | 34,961 | 29.09 | 85,209 | 70.91 | 1,262 | 1.04 | 121,432 | 91.75 | 132,245 | Labor | New South Wales |
Indi | 36,289 | 33.11 | 73,315 | 66.89 | 963 | 0.87 | 110,567 | 92.57 | 119,391 | Independent | Victoria |
Isaacs | 52,454 | 50.57 | 51,274 | 49.43 | 1,080 | 1.03 | 104,808 | 92.18 | 113,627 | Labor | Victoria |
Jagajaga | 58,070 | 54.64 | 48,210 | 45.36 | 1,024 | 0.95 | 107,304 | 93.55 | 114,687 | Labor | Victoria |
Kennedy | 20,697 | 20.33 | 81,090 | 79.67 | 669 | 0.65 | 102,456 | 84.33 | 121,512 | KAP | Queensland |
Kingsford Smith | 56,387 | 55.64 | 44,961 | 44.36 | 1,082 | 1.06 | 102,430 | 88.42 | 115,814 | Labor | New South Wales |
Kingston | 40,585 | 35.71 | 73,060 | 64.29 | 1,219 | 1.06 | 114,864 | 91.19 | 126,033 | Labor | South Australia |
Kooyong | 63,253 | 59.85 | 42,433 | 40.15 | 739 | 0.69 | 106,425 | 93.21 | 114,138 | Independent | Victoria |
La Trobe | 39,916 | 38.49 | 63,787 | 61.51 | 912 | 0.87 | 104,615 | 91.11 | 114,777 | Liberal | Victoria |
Lalor | 48,124 | 46.89 | 54,508 | 53.11 | 1,010 | 0.97 | 103,642 | 88.05 | 117,660 | Labor | Victoria |
Leichhardt | 34,179 | 34.45 | 65,044 | 65.55 | 827 | 0.83 | 100,050 | 81.81 | 122,282 | Liberal | Queensland |
Lilley | 48,455 | 46.56 | 55,606 | 53.44 | 854 | 0.81 | 104,915 | 90.51 | 115,874 | Labor | Queensland |
Lindsay | 35,490 | 31.01 | 78,974 | 68.99 | 1,336 | 1.15 | 115,800 | 90.26 | 128,248 | Liberal | New South Wales |
Lingiari | 22,274 | 43.54 | 28,885 | 56.46 | 385 | 0.75 | 51,544 | 64.38 | 80,055 | Labor | Northern Territory |
Longman | 29,361 | 24.66 | 89,691 | 75.34 | 1,099 | 0.91 | 120,151 | 88.51 | 135,691 | Liberal | Queensland |
Lyne | 31,017 | 26.49 | 86,075 | 73.51 | 1,055 | 0.89 | 118,147 | 92.96 | 126,981 | Nationals | New South Wales |
Lyons | 25,794 | 32.59 | 53,355 | 67.41 | 947 | 1.18 | 80,096 | 91.88 | 87,156 | Labor | Tasmania |
Macarthur | 43,619 | 34.89 | 81,415 | 65.11 | 1,607 | 1.27 | 126,641 | 89.80 | 140,973 | Labor | New South Wales |
Mackellar | 52,299 | 50.84 | 50,562 | 49.16 | 1,049 | 1.01 | 103,910 | 92.30 | 112,551 | Independent | New South Wales |
Macnamara | 63,584 | 64.61 | 34,833 | 35.39 | 859 | 0.87 | 99,276 | 87.38 | 113,597 | Labor | Victoria |
Macquarie | 43,814 | 43.44 | 57,058 | 56.56 | 1,004 | 0.99 | 101,876 | 93.32 | 109,103 | Labor | New South Wales |
Makin | 35,883 | 32.12 | 75,834 | 67.88 | 1,147 | 1.02 | 112,864 | 91.59 | 123,305 | Labor | South Australia |
Mallee | 23,901 | 21.69 | 86,273 | 78.31 | 836 | 0.75 | 111,010 | 91.20 | 121,621 | Nationals | Victoria |
Maranoa | 15,594 | 15.38 | 85,768 | 84.62 | 563 | 0.55 | 101,925 | 89.90 | 113,363 | Nationals | Queensland |
Maribyrnong | 51,674 | 51.29 | 49,070 | 48.71 | 1,009 | 0.99 | 101,753 | 91.51 | 111,154 | Labor | Victoria |
Mayo | 49,995 | 40.17 | 74,450 | 59.83 | 1,217 | 0.97 | 125,662 | 94.54 | 133,078 | Centre Alliance | South Australia |
McEwen | 42,268 | 39.91 | 63,639 | 60.09 | 941 | 0.88 | 106,848 | 92.68 | 115,285 | Labor | Victoria |
McMahon | 33,029 | 34.11 | 63,796 | 65.89 | 1,728 | 1.75 | 98,553 | 88.31 | 111,566 | Labor | New South Wales |
McPherson | 35,801 | 35.08 | 66,246 | 64.92 | 1,265 | 1.22 | 103,312 | 86.93 | 118,805 | Liberal | Queensland |
Melbourne | 77,741 | 77.21 | 22,949 | 22.79 | 698 | 0.69 | 101,388 | 87.27 | 116,172 | Greens | Victoria |
Menzies | 46,820 | 45.14 | 56,891 | 54.86 | 1,002 | 0.96 | 104,713 | 92.52 | 113,112 | Liberal | Victoria |
Mitchell | 47,917 | 40.67 | 69,897 | 59.33 | 983 | 0.83 | 118,797 | 92.80 | 127,985 | Liberal | New South Wales |
Monash | 35,884 | 34.34 | 68,625 | 65.66 | 1,016 | 0.96 | 105,525 | 92.58 | 113,948 | Liberal | Victoria |
Moncrieff | 32,038 | 30.80 | 71,967 | 69.20 | 1,139 | 1.08 | 105,144 | 84.67 | 124,154 | Liberal | Queensland |
Moore | 41,463 | 37.74 | 68,413 | 62.26 | 880 | 0.79 | 110,756 | 91.50 | 121,017 | Liberal | Western Australia |
Moreton | 46,961 | 49.32 | 48,263 | 50.68 | 971 | 1.01 | 96,195 | 88.36 | 108,852 | Labor | Queensland |
New England | 26,158 | 24.68 | 79,846 | 75.32 | 911 | 0.85 | 106,915 | 92.12 | 115,992 | Nationals | New South Wales |
Newcastle | 60,204 | 53.53 | 52,260 | 46.47 | 1,199 | 1.05 | 113,663 | 91.87 | 123,663 | Labor | New South Wales |
Nicholls | 25,806 | 24.76 | 78,437 | 75.24 | 920 | 0.87 | 105,163 | 91.19 | 115,255 | Nationals | Victoria |
North Sydney | 61,692 | 59.93 | 41,254 | 40.07 | 851 | 0.82 | 103,797 | 91.74 | 113,165 | Independent | New South Wales |
O'Connor | 25,937 | 24.48 | 80,005 | 75.52 | 785 | 0.74 | 106,727 | 87.92 | 121,388 | Liberal | Western Australia |
Oxley | 41,016 | 40.25 | 60,899 | 59.75 | 1,046 | 1.02 | 102,961 | 87.20 | 118,041 | Labor | Queensland |
Page | 37,443 | 33.02 | 75,936 | 66.98 | 1,230 | 1.07 | 114,609 | 92.25 | 124,181 | Nationals | New South Wales |
Parkes | 20,859 | 21.16 | 77,723 | 78.84 | 994 | 1.00 | 99,576 | 89.72 | 110,934 | Nationals | New South Wales |
Parramatta | 42,734 | 45.36 | 51,476 | 54.64 | 1,212 | 1.27 | 95,422 | 87.25 | 109,334 | Labor | New South Wales |
Paterson | 37,243 | 30.00 | 86,891 | 70.00 | 1,333 | 1.06 | 125,467 | 92.30 | 135,828 | Labor | New South Wales |
Pearce | 32,408 | 31.31 | 71,111 | 68.69 | 894 | 0.86 | 104,413 | 86.83 | 120,227 | Labor | Western Australia |
Perth | 57,950 | 53.68 | 50,005 | 46.32 | 995 | 0.91 | 108,950 | 87.97 | 123,816 | Labor | Western Australia |
Petrie | 37,828 | 33.17 | 76,214 | 66.83 | 934 | 0.81 | 114,976 | 88.82 | 129,394 | Liberal | Queensland |
Rankin | 32,835 | 35.26 | 60,288 | 64.74 | 1,050 | 1.11 | 94,173 | 83.78 | 112,395 | Labor | Queensland |
Reid | 52,659 | 50.62 | 51,375 | 49.38 | 1,026 | 0.98 | 105,060 | 90.05 | 116,651 | Labor | New South Wales |
Richmond | 48,067 | 43.93 | 61,348 | 56.07 | 1,491 | 1.34 | 110,906 | 89.74 | 123,537 | Labor | New South Wales |
Riverina | 26,810 | 24.92 | 80,772 | 75.08 | 1,029 | 0.95 | 108,611 | 92.26 | 117,673 | Nationals | New South Wales |
Robertson | 44,579 | 43.37 | 58,197 | 56.63 | 1,102 | 1.06 | 103,878 | 91.62 | 113,332 | Labor | New South Wales |
Ryan | 54,466 | 52.71 | 48,875 | 47.29 | 677 | 0.65 | 104,018 | 92.02 | 113,005 | Greens | Queensland |
Scullin | 37,486 | 38.10 | 60,896 | 61.90 | 1,343 | 1.35 | 99,725 | 89.23 | 111,735 | Labor | Victoria |
Shortland | 41,463 | 38.39 | 66,551 | 61.61 | 1,212 | 1.11 | 109,226 | 92.84 | 117,568 | Labor | New South Wales |
Solomon | 20,802 | 36.27 | 36,544 | 63.73 | 435 | 0.75 | 57,781 | 79.22 | 72,936 | Labor | Northern Territory |
Spence | 32,303 | 27.77 | 84,000 | 72.23 | 1,239 | 1.05 | 117,542 | 88.29 | 133,226 | Labor | South Australia |
Sturt | 50,943 | 42.90 | 67,810 | 57.10 | 1,079 | 0.90 | 119,832 | 92.66 | 129,401 | Liberal | South Australia |
Swan | 44,813 | 42.75 | 60,009 | 57.25 | 828 | 0.78 | 105,650 | 86.06 | 122,724 | Labor | Western Australia |
Sydney | 73,333 | 70.90 | 30,100 | 29.10 | 889 | 0.85 | 104,322 | 85.38 | 122,228 | Labor | New South Wales |
Tangney | 45,873 | 41.32 | 65,143 | 58.68 | 820 | 0.73 | 111,836 | 90.65 | 123,326 | Labor | Western Australia |
Wannon | 35,015 | 32.39 | 73,102 | 67.61 | 1,010 | 0.93 | 109,127 | 93.39 | 116,788 | Liberal | Victoria |
Warringah | 57,347 | 59.54 | 38,967 | 40.46 | 836 | 0.86 | 97,150 | 90.99 | 106,766 | Independent | New South Wales |
Watson | 39,490 | 42.05 | 54,414 | 57.95 | 2,043 | 2.13 | 95,947 | 86.44 | 110,964 | Labor | New South Wales |
Wentworth | 56,732 | 62.55 | 33,973 | 37.45 | 840 | 0.92 | 91,545 | 87.64 | 104,435 | Independent | New South Wales |
Werriwa | 41,941 | 36.77 | 72,107 | 63.23 | 1,915 | 1.65 | 115,963 | 87.12 | 133,060 | Labor | New South Wales |
Whitlam | 42,042 | 35.84 | 75,264 | 64.16 | 1,399 | 1.18 | 118,705 | 92.22 | 128,629 | Labor | New South Wales |
Wide Bay | 26,679 | 25.19 | 79,237 | 74.81 | 865 | 0.81 | 106,781 | 89.12 | 119,799 | Liberal | Queensland |
Wills | 63,773 | 64.88 | 34,517 | 35.12 | 1,124 | 1.13 | 99,414 | 89.41 | 111,159 | Labor | Victoria |
Wright | 26,180 | 22.67 | 89,328 | 77.33 | 959 | 0.82 | 116,467 | 88.88 | 131,027 | Liberal | Queensland |
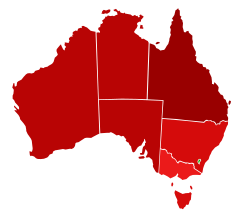
The referendum result saw a majority of Australians in every jurisdiction other than the ACT vote No to the Voice.
Although every electorate with a high Indigenous population voted No, many Indigenous communities in these seats voted Yes. However, turnout in Indigenous communities is low, and in many of them less than a third of enrolled voters actually voted. [6]
A study from the Australian National University found that No voters were typically older than Yes voters, and that men were more likely to vote No than women. The study also found that the majority of people who speak English as a second language voted No. [7] Ethnic communities were, throughout the campaign, a key demographic for both the Yes and No camps. [8]
The vote for the Voice in suburbs with high ethnic populations was split, with election analyst Ben Raue identifying some surprising trends in certain suburbs. For example, of the 15 suburbs with the highest Indian populations, 10 of them voted Yes, despite all but one being located in electorates that voted No. On the other hand, of the 15 suburbs with the highest Chinese populations, only three voted Yes (though all but one had an above-average Yes vote). [9]
The result saw an urban-rural political divide, with regional and rural areas voting heavily against the Voice while inner-city seats voted Yes. [10] Seats in the outer suburbs and based around major regional cities typically voted No, but not to the same extent as rural areas.
Every seat in South Australia and the Northern Territory voted No to the Voice, as did all but three seats in Queensland and all but two seats in both Western Australia and Tasmania. Of the seats that voted Yes, almost all of them were inner-city seats in the capital cities, and only two seats in regional cities voted Yes (those being Cunningham and Newcastle, located in the cities of Wollongong and Newcastle, respectively). In contrast, of the 34 electorates with a No vote of over 70%, only four were in the capital cities (Bowman, Forde and Longman in Brisbane and Spence in Adelaide).
The result saw a divide between the upper-class and the middle and lower-classes, with affluent suburbs in inner-city electorates voting Yes. The Voice had long been criticised by its opponents as a progressive and elitist proposal, having been backed by large and influential corporations and donors while being perceived as having a lack of support from ordinary Australians.
Although Labor backed the proposal and the Coalition opposed it (though one state division of the Liberal Party, the Tasmanian Liberal Party, supported it), the majority of Labor electorates voted No, though the No vote was higher in most Coalition seats.
The Greens and teal independents also backed the Voice. Every electorate held by the Greens or a teal independent voted Yes. The Greens and teal independents hold seats in affluent inner-city electorates in Sydney, Melbourne, Brisbane and Perth.
The AustralianHouse of Representatives is the lower house of the bicameral Parliament of Australia, the upper house being the Senate. Its composition and powers are set down in Chapter I of the Constitution of Australia.
The electoral system of Australia comprises the laws and processes used for the election of members of the Australian Parliament and is governed primarily by the Commonwealth Electoral Act 1918. The system presently has a number of distinctive features including compulsory enrolment; compulsory voting; majority-preferential instant-runoff voting in single-member seats to elect the lower house, the House of Representatives; and the use of the single transferable vote proportional representation system to elect the upper house, the Senate.
Referendums in the United Kingdom are occasionally held at a national, regional or local level. Historically, national referendums are rare due to the long-standing principle of parliamentary sovereignty. There is no constitutional requirement to hold a national referendum for any purpose or on any issue however the UK Parliament is free to legislate through an Act of Parliament for a referendum to be held on any question at any time.
The Australian Electoral Commission (AEC) is the independent statutory authority and agency of the Australian Government responsible for the management of federal Australian elections, by-elections and referendums.
The Division of Canberra is an Australian electoral division in the Australian Capital Territory. It is named for the city of Canberra, Australia's national capital, and includes all of central Canberra, Kowen, Majura, as well as part of Weston Creek, Woden Valley, Molonglo Valley, Belconnen, and Jerrabomberra. It is currently held by Alicia Payne of the Labor Party.
The Division of Brisbane is an Australian electoral division in the state of Queensland.
The Division of Melbourne is an Australian electoral division in the State of Victoria, represented since the 2010 election by Adam Bandt, leader of the Australian Greens.
In Australia, referendums are public votes held on important issues where the electorate may approve or reject a certain proposal. In contemporary usage, polls conducted on non-constitutional issues are known as plebiscites, with the term referendum being reserved solely for votes on constitutional changes, which is legally required to make a change to the Constitution of Australia.
The Australian republic referendum held on 6 November 1999 was a two-question referendum to amend the Constitution of Australia. The first question asked whether Australia should become a republic, under a bi-partisan appointment model where the president would be appointed by Parliament with a two-thirds majority. This was the model that was endorsed by the Constitutional Convention, held in Canberra in February 1998. The second question, generally deemed to be far less important politically, asked whether Australia should alter the Constitution to insert a preamble.
The Division of Kooyong is an Australian Electoral Division for the Australian House of Representatives in the state of Victoria, which covers an area of approximately 59 km2 (23 sq mi) in the inner-east of Melbourne. It contains the affluent suburbs of Balwyn, Balwyn North, Camberwell, Canterbury, Deepdene, Kew, Kew East, Mont Albert, Mont Albert North, Surrey Hills and parts of Glen Iris.
The Division of Watson is an Australian electoral division in the state of New South Wales.
In Australian politics, the two-party-preferred vote is the result of an election or opinion poll after preferences have been distributed to the highest two candidates, who in some cases can be independents. For the purposes of TPP, the Liberal/National Coalition is usually considered a single party, with Labor being the other major party. Typically the TPP is expressed as the percentages of votes attracted by each of the two major parties, e.g. "Coalition 50%, Labor 50%", where the values include both primary votes and preferences. The TPP is an indicator of how much swing has been attained/is required to change the result, taking into consideration preferences, which may have a significant effect on the result.
The 2009 Western Australian daylight saving referendum was held on 16 May 2009 in the Australian state of Western Australia to decide if daylight saving time should be adopted. It was the fourth such proposal which had been put to Western Australian voters and followed a three-year trial period. The referendum resulted in the proposal being rejected, with 54.56% voting against the proposal.
New South Wales politics takes place in context of a bicameral parliamentary system. The main parties are the Liberal and National parties of the governing Coalition, and the Labor Party. Other minor political parties include the Greens, Shooters, Fishers and Farmers Party and One Nation, along with several independent politicians.
The Voices for or Voices of groups are a series of loosely related political community engagement groups in Australia. Some of the groups have endorsed candidates to run as candidates in federal elections. The independence of some of the candidates endorsed by some groups has been disputed, with some candidates receiving significant funding from the Climate 200 fund backed by energy investor Simon Holmes à Court.
The next Australian federal election will be held on or before 27 September 2025 to elect members of the 48th Parliament of Australia. All 150 seats in the House of Representatives and likely 40 of the 76 seats in the Senate will be contested. It is expected that at this election, the Labor government of Prime Minister Anthony Albanese will be seeking re-election to a second term in office, opposed by the Liberal/National Coalition under Leader of the Opposition Peter Dutton.
Teal independents, simply known as teals and also called community independents, are a loosely-aligned group of centrist, independent or minor party politicians in Australian politics. They have been characterised as strongly advocating for increased action to mitigate climate change by reducing greenhouse gas emissions along with improved political integrity and accountability. They also generally share socially liberal outlooks, including on issues such as LGBT rights, and have harnessed grassroots campaigning to achieve strong swings towards them.
Katherine Ella Chaney is an Australian independent politician, who was elected to the Australian House of Representatives at the 2022 Australian federal election, succeeding Liberal Party MP Celia Hammond in the division of Curtin.
The number of seats won by each party in the Australian House of Representatives at the 2022 federal election were: Coalition 58, Labor 77, Australian Greens 4, Centre Alliance 1, Katter's Australian Party 1, and Independents 10.
The 2023 Australian Indigenous Voice referendum was a constitutional referendum held on 14 October 2023 in which the proposed Aboriginal and Torres Strait Islander Voice was rejected. Voters were asked to approve an alteration to the Australian Constitution that would recognise Indigenous Australians in the document through prescribing a body called the Aboriginal and Torres Strait Islander Voice that would have been able to "make representations to the Parliament and the Executive Government of the Commonwealth on matters relating to Aboriginal and Torres Strait Islander peoples". The proposal was rejected nationally and by a majority in every state, thus failing to secure the double majority required for amendment by section 128 of the constitution. The Australian Capital Territory was the only state or territory with a majority of "yes" votes.