Member(residence) Party Years Cong Electoral history District location District established March 24, 1790 John B. Ashe (Halifax ) Anti-Administration March 24, 1790 – 1st Elected in 1790 . 3rd district and re-elected there. 1790–1791 Anson , Burke , Guilford , Iredell , Lincoln , Mecklenburg , Montgomery , Rockingham , Stokes , Surry , Rowan , Rutherford , and Wilkes counties John Steele (Salisbury ) Pro-Administration March 4, 1791 – 2nd Redistricted from the 4th district and re-elected in 1791 .[ data missing ] 1791–1793 Burke , Guilford , Iredell , Lincoln , Mecklenburg , Montgomery , Rockingham , Stokes , Surry , Rowan , Rutherford , and Wilkes counties Joseph McDowell (Morganton ) Anti-Administration March 4, 1793 – 3rd Elected in 1793 . 1793–1803 Ashe , Buncombe , Burke , Lincoln , Rutherford , and Wilkes counties James Holland (Rutherfordton ) Democratic-Republican March 4, 1795 – 4th Elected in 1795 . Joseph McDowell Jr. (Quaker Meadows ) Democratic-Republican March 4, 1797 – 5th Elected in 1796 . Joseph Dickson (Lincoln County ) Federalist March 4, 1799 – 6th Elected in 1798 . James Holland (Rutherfordton ) Democratic-Republican March 4, 1801 – 7th Elected in 1800 . 11th district . Thomas Wynns (Hertford County ) Democratic-Republican March 4, 1803 – 8th 9th Redistricted from the 8th district and re-elected in 1803 .Re-elected in 1804 . 1803–1813 Camden , Chowan , Currituck , Gates , Hertford , Pasquotank , and Perquimans counties Lemuel Sawyer (Elizabeth City ) Democratic-Republican March 4, 1807 – 10th 11th 12th Elected in 1806 .Re-elected in 1808 .Re-elected in 1810 . William H. Murfree (Murfreesboro ) Democratic-Republican March 4, 1813 – 13th 14th Elected in 1813 .Re-elected in 1815 . 1813–1823 Camden , Chowan , Currituck , Gates , Hertford , Pasquotank , and Perquimans counties Lemuel Sawyer (Elizabeth City ) Democratic-Republican March 4, 1817 – 15th 16th 17th Elected in 1817 .Re-elected in 1819 .Re-elected in 1821 . Alfred M. Gatlin (Edenton ) Democratic-Republican March 4, 1823 – 18th Elected in 1823 . 1823–1833 Camden , Chowan , Currituck , Gates , Hertford , Pasquotank , and Perquimans counties Lemuel Sawyer (Elizabeth City ) Jacksonian March 4, 1825 – 19th 20th Elected in 1825 .Re-elected in 1827 . William B. Shepard (Elizabeth City ) Anti-Jacksonian March 4, 1829 – 21st 22nd 23rd 24th Elected in 1829 .Re-elected in 1831 .Re-elected in 1833 .Re-elected in 1835 .[ data missing ] 1833–1843 Camden , Chowan , Currituck , Gates , Hertford , Pasquotank , and Perquimans counties Samuel T. Sawyer (Edenton ) Whig March 4, 1837 – 25th Elected in 1837 .[ data missing ] Kenneth Rayner (Winton ) Whig March 4, 1839 – 26th 27th Elected in 1839 .Re-elected in 1841 . 9th district . Thomas L. Clingman (Asheville ) Whig March 4, 1843 – 28th Elected in 1843 .[ data missing ] 1843–1853 Buncombe , Burke , Caldwell , Cherokee , Cleveland , Haywood , Henderson , Jackson , Macon , Madison , McDowell , Rutherford , and Yancey counties James Graham (Rutherfordton ) Whig March 4, 1845 – 29th Elected in 1845 .[ data missing ] Thomas L. Clingman (Asheville ) Whig March 4, 1847 – 30th 31st 32nd Elected in 1847 .Re-elected in 1849 .Re-elected in 1851 . 8th district . Henry M. Shaw (Indian Town ) Democratic March 4, 1853 – 33rd Elected in 1853 .[ data missing ] 1853–1861 Bertie , Camden , Chowan , Currituck , Gates , Halifax , Hertford , Martin , Northampton , Pasquotank , Perquimans , Tyrrell , and Washington counties Robert T. Paine (Edenton ) Know Nothing March 4, 1855 – 34th Elected in 1855 .[ data missing ] Henry M. Shaw (Indian Town ) Democratic March 4, 1857 – 35th Elected in 1857 .[ data missing ] William N. H. Smith (Murfreesboro ) Opposition March 4, 1859 – 36th Elected in 1859 . Vacant March 4, 1861 – 37th 38th 39th 40th Civil War and Reconstruction John R. French (Edenton ) Republican July 6, 1868 – 40th Elected to finish the shorter term . 1868–1873 Beaufort , Bertie , Camden , Chowan , Currituck , Dare , Gates , Halifax , Hertford , Hyde , Martin , Northampton , Pasquotank , Perquimans , Tyrrell , and Washington counties Clinton L. Cobb (Elizabeth City ) Republican March 4, 1869 – 41st 42nd 43rd Elected in 1868 .Re-elected in 1870 .Re-elected in 1872 . 1873–1883 Beaufort , Bertie , Camden , Chowan , Currituck , Dare , Gates , Hertford , Hyde , Martin , Pamlico , Pasquotank , Perquimans , Pitt , Tyrrell , and Washington counties Jesse J. Yeates (Murfreesboro ) Democratic March 4, 1875 – 44th 45th Elected in 1874 .Re-elected in 1876 . Joseph J. Martin (Williamston ) Republican March 4, 1879 – 46th Elected in 1878 . Lost contested election before the end of the term.
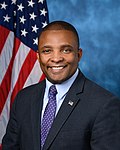
Jesse J. Yeates (Murfreesboro ) Democratic January 29, 1881 – 46th Won contested election . Louis C. Latham (Greenville ) Democratic March 4, 1881 – 47th Elected in 1880 . Walter F. Pool (Elizabeth ) Republican March 4, 1883 – 48th Elected in 1882 . 1883–1893 Beaufort , Camden , Carteret , Chowan , Currituck , Dare , Gates , Hertford , Hyde , Martin , Pamlico , Pasquotank , Perquimans , Pitt , Tyrrell , and Washington countiesVacant August 25, 1883 – Thomas G. Skinner (Hertford ) Democratic November 20, 1883 – 48th 49th Elected to finish Pool's term .Re-elected in 1884 . Louis C. Latham (Greenville ) Democratic March 4, 1887 – 50th Elected again in 1886 . Thomas G. Skinner (Hertford ) Democratic March 4, 1889 – 51st Elected in 1888 . William A. B. Branch (Washington ) Democratic March 4, 1891 – 52nd 53rd Elected in 1890 .Re-elected in 1892 . 1893–1903 Beaufort , Bertie , Camden , Carteret , Chowan , Currituck , Dare , Gates , Hertford , Hyde , Martin , Pamlico , Pasquotank , Perquimans , Pitt , Tyrrell , and Washington counties Harry Skinner (Greenville ) Populist March 4, 1895 – 54th 55th Elected in 1894 .Re-elected in 1896 . John H. Small (Washington ) Democratic March 4, 1899 – 56th 57th 58th 59th 60th 61st 62nd 63rd 64th 65th 66th Elected in 1898 .Re-elected in 1900 .Re-elected in 1902 .Re-elected in 1904 .Re-elected in 1906 .Re-elected in 1908 .Re-elected in 1910 .Re-elected in 1912 .Re-elected in 1914 .Re-elected in 1916 .Re-elected in 1918 . 1903–1913 Beaufort , Bertie , Camden , Chowan , Currituck , Dare , Gates , Hertford , Hyde , Martin , Pasquotank , Perquimans , Pitt , Tyrrell , and Washington counties1913–1933 Beaufort , Bertie , Camden , Chowan , Currituck , Dare , Gates , Hertford , Hyde , Martin , Pasquotank , Perquimans , Pitt , Tyrrell , and Washington counties Hallett S. Ward (Washington ) Democratic March 4, 1921 – 67th 68th Elected in 1920 .Re-elected in 1922 . Lindsay C. Warren (Washington ) Democratic March 4, 1925 – 69th 70th 71st 72nd 73rd 74th 75th 76th Elected in 1924 .Re-elected in 1926 .Re-elected in 1928 .Re-elected in 1930 .Re-elected in 1932 .Re-elected in 1934 .Re-elected in 1936 .Re-elected in 1938 .U.S. Comptroller General . 1933–1943 Beaufort , Bertie , Camden , Chowan , Currituck , Dare , Gates , Hertford , Hyde , Martin , Pasquotank , Perquimans , Pitt , Tyrrell , and Washington countiesVacant October 31, 1940 – 76th Herbert C. Bonner (Washington ) Democratic November 5, 1940 – 76th 77th 78th 79th 80th 81st 82nd 83rd 84th 85th 86th 87th 88th 89th Elected to finish Warren's term .Re-elected in 1940 .Re-elected in 1942 .Re-elected in 1944 .Re-elected in 1946 .Re-elected in 1948 .Re-elected in 1950 .Re-elected in 1952 .Re-elected in 1954 .Re-elected in 1956 .Re-elected in 1958 .Re-elected in 1960 .Re-elected in 1962 .Re-elected in 1964 . 1943–1953 Beaufort , Bertie , Camden , Chowan , Currituck , Dare , Gates , Hertford , Hyde , Martin , Pasquotank , Perquimans , Pitt , Tyrrell , and Washington counties1953–1963 Beaufort , Bertie , Camden , Chowan , Currituck , Dare , Gates , Hertford , Hyde , Martin , Pasquotank , Perquimans , Pitt , Tyrrell , and Washington counties1963–1973 Beaufort , Bertie , Camden , Chowan , Craven , Currituck , Dare , Gates , Hertford , Hyde , Jones , Lenoir , Martin , Pamlico , Pasquotank , Perquimans , Pitt , Tyrrell , and Washington countiesVacant November 7, 1965 – 89th Walter B. Jones Sr. (Farmville ) Democratic February 5, 1966 – 89th 90th 91st 92nd 93rd 94th 95th 96th 97th 98th 99th 100th 101st 102nd Elected to finish Bonner's term .Re-elected in 1966 .Re-elected in 1968 .Re-elected in 1970 .Re-elected in 1972 .Re-elected in 1974 .Re-elected in 1976 .Re-elected in 1978 .Re-elected in 1980 .Re-elected in 1982 .Re-elected in 1984 .Re-elected in 1986 .Re-elected in 1988 .Re-elected in 1990 . 1973–1983 [ data missing ] 1983–1993 [ data missing ] Vacant September 15, 1992 – 102nd Eva Clayton (Littleton ) Democratic November 3, 1992 – 102nd 103rd 104th 105th 106th 107th Elected to finish Jones's term .Elected to full term in 1992 .Re-elected in 1994 .Re-elected in 1996 .Re-elected in 1998 .Re-elected in 2000 . 1993–2003 [ data missing ] Frank Ballance (Warrenton ) Democratic January 3, 2003 – 108th Elected in 2002 . 2003–2013 Vacant June 11, 2004 – 108th G. K. Butterfield (Wilson ) Democratic July 20, 2004 – 108th 109th 110th 111th 112th 113th 114th 115th 116th 117th Elected to finish Ballance's term .Re-elected later in 2004 .Re-elected in 2006 .Re-elected in 2008 .Re-elected in 2010 .Re-elected in 2012 .Re-elected in 2014 .Re-elected in 2016 .Re-elected in 2018 .Re-elected in 2020 . 2013–2017 2017–2021 2021–2023 Vacant December 30, 2022 – 117th Don Davis (Snow Hill ) Democratic January 3, 2023 – 118th 119th Elected in 2022 .Re-elected in 2024 . 2023–2025 2025–present