Upson County, Georgia | |
|---|---|
| Upson County Courthouse in Thomaston | |
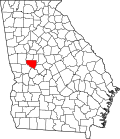
| Location within the U.S. state of Georgia | |
| Coordinates: 32°53′N84°18′W / 32.88°N 84.3°W | |
| Country | |
| State | |
| Founded | December 15, 1824 |
| Named after | Stephen Upson |
| Seat | Thomaston |
| Largest city | Thomaston |
| Area | |
• Total | 328 sq mi (850 km2) |
| • Land | 323 sq mi (840 km2) |
| • Water | 4.1 sq mi (11 km2) 1.3% |
| Population (2020) | |
• Total | 27,700 |
| • Density | 86/sq mi (33/km2) |
| Time zone | UTC−5 (Eastern) |
| • Summer (DST) | UTC−4 (EDT) |
| Congressional district | 3rd |
| Website | www |
Upson County is a county in the West Central region of the U.S. state of Georgia. As of the 2020 census, the population was 27,700. [1] The county seat is Thomaston. [2] The county was created on December 15, 1824.
Upson County comprises the Thomaston, GA Micropolitan Statistical Area, which is also included in the Atlanta-Athens-Clarke County-Sandy Springs CSA.
Upson County was formed in 1824 and named after Stephen Upson, a state legislator. [3]
On May 29, 1865, following the conclusion of the American Civil War, enslaved African Americans in the county were notified in Thomaston that they had been emancipated. [4] By the following year, celebrations were held on that date, which continue to this day. [4] It is considered one of the largest Emancipation Day celebrations in Georgia and one of the oldest continuously celebrated ones in the United States. [4]
According to the U.S. Census Bureau, the county has a total area of 328 square miles (850 km2), of which 323 square miles (840 km2) is land and 4.1 square miles (11 km2) (1.3%) is water. [5] Upson County boasts the lowest average summer humidity in the state.
The vast majority of Upson County is located in the Upper Flint River sub-basin of the ACF River Basin (Apalachicola-Chattahoochee-Flint River Basin), with just a tiny northeastern corner of the county, north of Yatesville, located in the Upper Ocmulgee River sub-basin of the Altamaha River basin. [6]
| Census | Pop. | Note | %± |
|---|---|---|---|
| 1830 | 7,013 | — | |
| 1840 | 9,408 | 34.2% | |
| 1850 | 9,424 | 0.2% | |
| 1860 | 9,910 | 5.2% | |
| 1870 | 9,430 | −4.8% | |
| 1880 | 12,400 | 31.5% | |
| 1890 | 12,188 | −1.7% | |
| 1900 | 13,670 | 12.2% | |
| 1910 | 12,757 | −6.7% | |
| 1920 | 14,786 | 15.9% | |
| 1930 | 19,509 | 31.9% | |
| 1940 | 25,064 | 28.5% | |
| 1950 | 25,078 | 0.1% | |
| 1960 | 23,800 | −5.1% | |
| 1970 | 23,505 | −1.2% | |
| 1980 | 25,998 | 10.6% | |
| 1990 | 26,300 | 1.2% | |
| 2000 | 27,597 | 4.9% | |
| 2010 | 27,153 | −1.6% | |
| 2020 | 27,700 | 2.0% | |
| 2024 (est.) | 28,358 | [7] | 2.4% |
| U.S. Decennial Census [8] 1790-1880 [9] 1890-1910 [10] 1920-1930 [11] 1930-1940 [12] 1940-1950 [13] 1960-1980 [14] 1980-2000 [15] 2010 [16] | |||
| Race | Num. | Perc. |
|---|---|---|
| White (non-Hispanic) | 18,009 | 65.01% |
| Black or African American (non-Hispanic) | 7,851 | 28.34% |
| Native American | 63 | 0.23% |
| Asian | 151 | 0.55% |
| Pacific Islander | 1 | 0.0% |
| Other/Mixed | 992 | 3.58% |
| Hispanic or Latino | 633 | 2.29% |
As of the 2020 census, the county had a population of 27,700, 11,173 households, and 6,100 families residing in the county. The median age was 42.7 years. 21.6% of residents were under the age of 18 and 19.7% of residents were 65 years of age or older. For every 100 females there were 90.5 males, and for every 100 females age 18 and over there were 88.0 males age 18 and over. 53.3% of residents lived in urban areas, while 46.7% lived in rural areas. [18] [19] [20]
The racial makeup of the county was 65.5% White, 28.5% Black or African American, 0.3% American Indian and Alaska Native, 0.5% Asian, 0.0% Native Hawaiian and Pacific Islander, 1.3% from some other race, and 3.8% from two or more races. Hispanic or Latino residents of any race comprised 2.3% of the population. [20]
There were 11,173 households in the county, of which 29.4% had children under the age of 18 living with them and 33.3% had a female householder with no spouse or partner present. About 29.0% of all households were made up of individuals and 13.2% had someone living alone who was 65 years of age or older. [19]
There were 12,301 housing units, of which 9.2% were vacant. Among occupied housing units, 62.1% were owner-occupied and 37.9% were renter-occupied. The homeowner vacancy rate was 1.7% and the rental vacancy rate was 5.6%. [19]
As of the 2020s, Upson County is a strongly Republican voting county, voting 70% for Donald Trump in 2024. For elections to the United States House of Representatives, Upson County is part of Georgia's 3rd congressional district, currently represented by Brian Jack. For elections to the Georgia State Senate, Upson County is part of District 18. [21] For elections to the Georgia House of Representatives, Upson County is part of District 134. [22]
| Year | Republican | Democratic | Third party(ies) | |||
|---|---|---|---|---|---|---|
| № | % | № | % | № | % | |
| 1912 | 7 | 1.19% | 445 | 75.42% | 138 | 23.39% |
| 1916 | 18 | 1.78% | 734 | 72.60% | 259 | 25.62% |
| 1920 | 170 | 15.08% | 957 | 84.92% | 0 | 0.00% |
| 1924 | 37 | 6.37% | 484 | 83.30% | 60 | 10.33% |
| 1928 | 221 | 23.46% | 721 | 76.54% | 0 | 0.00% |
| 1932 | 20 | 1.19% | 1,660 | 98.57% | 4 | 0.24% |
| 1936 | 138 | 8.57% | 1,471 | 91.37% | 1 | 0.06% |
| 1940 | 159 | 6.64% | 2,235 | 93.36% | 0 | 0.00% |
| 1944 | 243 | 9.33% | 2,362 | 90.67% | 0 | 0.00% |
| 1948 | 262 | 8.75% | 2,432 | 81.26% | 299 | 9.99% |
| 1952 | 648 | 14.45% | 3,837 | 85.55% | 0 | 0.00% |
| 1956 | 712 | 17.22% | 3,422 | 82.78% | 0 | 0.00% |
| 1960 | 1,001 | 23.48% | 3,262 | 76.52% | 0 | 0.00% |
| 1964 | 3,103 | 48.61% | 3,275 | 51.30% | 6 | 0.09% |
| 1968 | 1,494 | 22.73% | 1,480 | 22.52% | 3,599 | 54.75% |
| 1972 | 4,892 | 84.52% | 896 | 15.48% | 0 | 0.00% |
| 1976 | 2,897 | 40.71% | 4,219 | 59.29% | 0 | 0.00% |
| 1980 | 2,788 | 36.52% | 4,713 | 61.73% | 134 | 1.76% |
| 1984 | 4,803 | 62.01% | 2,943 | 37.99% | 0 | 0.00% |
| 1988 | 4,614 | 63.05% | 2,666 | 36.43% | 38 | 0.52% |
| 1992 | 4,053 | 45.03% | 3,740 | 41.55% | 1,208 | 13.42% |
| 1996 | 3,783 | 47.08% | 3,491 | 43.45% | 761 | 9.47% |
| 2000 | 5,019 | 60.60% | 3,158 | 38.13% | 105 | 1.27% |
| 2004 | 6,634 | 65.72% | 3,424 | 33.92% | 36 | 0.36% |
| 2008 | 7,291 | 63.77% | 4,061 | 35.52% | 82 | 0.72% |
| 2012 | 7,230 | 64.10% | 3,959 | 35.10% | 90 | 0.80% |
| 2016 | 7,292 | 66.69% | 3,475 | 31.78% | 167 | 1.53% |
| 2020 | 8,606 | 66.68% | 4,203 | 32.56% | 98 | 0.76% |
| 2024 | 9,528 | 69.74% | 4,098 | 30.00% | 36 | 0.26% |