"},"web":{"wt":"www.co.waupaca.wi.us"},"ex image":{"wt":"WaupacaCountyWisconsinCourthouse.jpg"},"ex image cap":{"wt":"Waupaca County Courthouse"},"time zone":{"wt":"Central"},"named for":{"wt":"Menominee word, \"Wāpahkoh,\" meaning \"Place of Tomorrow Seen Clearly\""},"district":{"wt":"8th"},"leader_name":{"wt":""},"ZIP codes":{"wt":"54981"},"website":{"wt":""},"leader_title":{"wt":""}},"i":0}}]}" id="mwBw">County in Wisconsin
Waupaca County | |
---|---|
![]() Waupaca County Courthouse | |
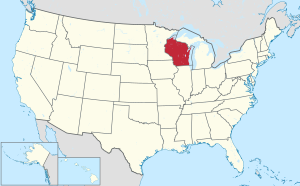
![]() Location within the U.S. state of Wisconsin | |
![]() Wisconsin's location within the U.S. | |
Coordinates: 44°29′N88°58′W / 44.48°N 88.97°W | |
Country | ![]() |
State | ![]() |
Founded | 1853 |
Named for | Menominee word, "Wāpahkoh," meaning "Place of Tomorrow Seen Clearly" |
Seat | Waupaca |
Largest city | New London |
Area | |
• Total | 765 sq mi (1,980 km2) |
• Land | 748 sq mi (1,940 km2) |
• Water | 17 sq mi (40 km2) 2.3% |
Population | |
• Total | 51,812 |
• Estimate (2023) | 51,388 ![]() |
• Density | 69.3/sq mi (26.8/km2) |
Time zone | UTC−6 (Central) |
• Summer (DST) | UTC−5 (CDT) |
ZIP Codes | 54981 |
Congressional district | 8th |
Website | www |
Waupaca County ( /wəˈpækə/ ⓘ wə-PAK-ə) [2] is a county in the U.S. state of Wisconsin. As of the 2020 census, the population was 51,812. [3] The county seat is Waupaca. [4] The county was created in 1851 and organized in 1853. [5] It is named after the Waupaca River, a Menominee language name meaning "place of tomorrow seen clearly." [6]
Ancient indigenous peoples constructed earthworks that expressed their religious and political concepts. An early European explorer counted 72 such earthen mounds in what is now Waupaca County, many of them in the form of effigy mounds, shaped like "humans, turtles, catfish and others." [7] There were 52 mounds constructed around what is now called Taylor Lake. Most mounds were lost to agricultural development. One mound, shaped like a catfish, is still visible in a private yard along County Hwy. QQ, just east of Taylor Lake. The site was marked by a local women's club with a commemorative plaque installed on a large stone. [7]
Under pressure from European-American development, the Menominee people ceded their title to the United States for these lands by treaty in 1852. Following that, the flow of new migrant settlers greatly increased from the East, with people moving from New England, New York, and Ohio. They developed the land primarily for agricultural use in the early decades, also quickly establishing sawmills on the rivers.
In the 1870s railroads were constructed in the county: the Wisconsin Central in 1872 and the Green Bay and Minnesota Railroad (later known as Green Bay, Minnesota & St. Paul) in 1873. These improved the county's connections to markets for its lumber and other products. For a period, entrepreneurs and merchants gained high profits from the lumber industry, establishing many fine homes in the larger cities.
According to the U.S. Census Bureau, the county has a total area of 765 square miles (1,980 km2), of which 748 square miles (1,940 km2) is land and 17 square miles (44 km2) (2.3%) is water. [8] The water includes 22 lakes that form the Waupaca Chain O' Lakes. These lakes are majority spring fed and connected by the Crystal River outlet. [9] Waupaca County is also home to Partridge Lake on the Wolf River and the Waupaca River.
Census | Pop. | Note | %± |
---|---|---|---|
1860 | 8,851 | — | |
1870 | 15,539 | 75.6% | |
1880 | 20,955 | 34.9% | |
1890 | 26,794 | 27.9% | |
1900 | 31,615 | 18.0% | |
1910 | 32,782 | 3.7% | |
1920 | 34,200 | 4.3% | |
1930 | 33,513 | −2.0% | |
1940 | 34,614 | 3.3% | |
1950 | 35,056 | 1.3% | |
1960 | 35,340 | 0.8% | |
1970 | 37,780 | 6.9% | |
1980 | 42,831 | 13.4% | |
1990 | 46,104 | 7.6% | |
2000 | 51,731 | 12.2% | |
2010 | 52,410 | 1.3% | |
2020 | 51,812 | −1.1% | |
U.S. Decennial Census [10] 1790–1960 [11] 1900–1990 [12] 1990–2000 [13] 2010–2020 [3] |
As of the census of 2020, [1] the population was 51,812. The population density was 69.3 people per square mile (26.8 people/km2). There were 25,457 housing units at an average density of 34.0 units per square mile (13.1 units/km2). The racial makeup of the county was 93.2% White, 0.6% Native American, 0.5% Asian, 0.4% Black or African American, 1.6% from other races, and 3.7% from two or more races. Ethnically, the population was 3.6% Hispanic or Latino of any race.
As of the census [14] of 2000, there were 51,731 people, 19,863 households, and 13,884 families residing in the county. The population density was 69 people per square mile (27 people/km2). There were 22,508 housing units at an average density of 30 units per square mile (12 units/km2). The racial makeup of the county was 97.93% White, 0.17% Black or African American, 0.42% Native American, 0.27% Asian, 0.01% Pacific Islander, 0.54% from other races, and 0.66% from two or more races. 1.38% of the population were Hispanic or Latino of any race. 53.1% were of German, 8.5% Norwegian and 6.8% Irish ancestry. 96.6% spoke English, 1.4% Spanish and 1.3% German as their first language.
There were 19,863 households, out of which 32.60% had children under the age of 18 living with them, 58.40% were married couples living together, 7.40% had a female householder with no husband present, and 30.10% were non-families. 25.20% of all households were made up of individuals, and 11.70% had someone living alone who was 65 years of age or older. The average household size was 2.51 and the average family size was 3.01.
By age, 25.70% of the population was under 18, 7.10% from 18 to 24, 27.80% from 25 to 44, 22.70% from 45 to 64, and 16.70% who were 65 or older. The median age was 38 years. For every 100 females there were 100.30 males. For every 100 females age 18 and over, there were 98.40 males.
In 2017, there were 505 births, giving a general fertility rate of 63.4 births per 1000 women aged 15–44, the 37th highest rate out of all 72 Wisconsin counties. Of these, 26 of the births occurred at home. [15]
Year | Republican | Democratic | Third party(ies) | |||
---|---|---|---|---|---|---|
No. | % | No. | % | No. | % | |
2024 | 20,093 | 66.09% | 9,947 | 32.72% | 363 | 1.19% |
2020 | 18,952 | 65.06% | 9,703 | 33.31% | 475 | 1.63% |
2016 | 16,209 | 62.12% | 8,451 | 32.39% | 1,435 | 5.50% |
2012 | 14,002 | 54.19% | 11,578 | 44.81% | 260 | 1.01% |
2008 | 12,232 | 47.95% | 12,952 | 50.77% | 327 | 1.28% |
2004 | 15,941 | 59.10% | 10,792 | 40.01% | 241 | 0.89% |
2000 | 12,980 | 56.92% | 8,787 | 38.53% | 1,037 | 4.55% |
1996 | 8,679 | 45.10% | 7,800 | 40.53% | 2,764 | 14.36% |
1992 | 10,252 | 44.27% | 6,666 | 28.78% | 6,241 | 26.95% |
1988 | 11,559 | 61.62% | 7,078 | 37.74% | 120 | 0.64% |
1984 | 13,097 | 68.33% | 5,895 | 30.76% | 175 | 0.91% |
1980 | 12,568 | 61.71% | 6,401 | 31.43% | 1,397 | 6.86% |
1976 | 10,849 | 60.13% | 6,857 | 38.00% | 337 | 1.87% |
1972 | 11,040 | 70.13% | 4,418 | 28.07% | 284 | 1.80% |
1968 | 10,606 | 67.13% | 3,978 | 25.18% | 1,215 | 7.69% |
1964 | 8,381 | 54.46% | 6,990 | 45.42% | 18 | 0.12% |
1960 | 12,247 | 72.61% | 4,606 | 27.31% | 14 | 0.08% |
1956 | 11,798 | 78.64% | 3,133 | 20.88% | 72 | 0.48% |
1952 | 13,693 | 81.38% | 3,105 | 18.45% | 28 | 0.17% |
1948 | 8,764 | 67.51% | 4,020 | 30.97% | 198 | 1.53% |
1944 | 11,495 | 74.44% | 3,879 | 25.12% | 68 | 0.44% |
1940 | 11,099 | 69.95% | 4,616 | 29.09% | 151 | 0.95% |
1936 | 6,680 | 45.88% | 6,920 | 47.52% | 961 | 6.60% |
1932 | 5,082 | 37.54% | 8,179 | 60.42% | 275 | 2.03% |
1928 | 8,928 | 72.32% | 3,307 | 26.79% | 110 | 0.89% |
1924 | 3,654 | 33.89% | 665 | 6.17% | 6,462 | 59.94% |
1920 | 8,302 | 83.04% | 888 | 8.88% | 807 | 8.07% |
1916 | 4,492 | 69.85% | 1,720 | 26.75% | 219 | 3.41% |
1912 | 2,204 | 37.66% | 1,563 | 26.70% | 2,086 | 35.64% |
1908 | 4,785 | 71.93% | 1,483 | 22.29% | 384 | 5.77% |
1904 | 5,471 | 81.34% | 942 | 14.01% | 313 | 4.65% |
1900 | 5,284 | 76.29% | 1,383 | 19.97% | 259 | 3.74% |
1896 | 5,472 | 75.19% | 1,577 | 21.67% | 229 | 3.15% |
1892 | 3,397 | 57.23% | 2,186 | 36.83% | 353 | 5.95% |
Waupaca County has long been one of the most Republican counties in Wisconsin. Only two Democrats have carried the county at the presidential level since the formation of the Republican Party – Franklin D. Roosevelt in 1932 and 1936, and Barack Obama in 2008, and in 1936 Roosevelt only won by plurality because of a sizeable vote for Union Party nominee William Lemke. It was one of only three Wisconsin counties, alongside Walworth and Waushara, to vote for Barry Goldwater over Lyndon Johnson in 1964.
In other statewide races, the county is equally Republican. The only Democratic gubernatorial candidate it has backed since at least 1908 is Albert Schmedeman in 1932. [17] Senators Herb Kohl in 2006 and William Proxmire in 1976 and 1970 did carry Waupaca County when they swept every county in the state, but no other Democratic senatorial candidate has won the county since the Seventeenth Amendment.
Wood County is a county located in the U.S. state of Wisconsin. As of the 2020 census, the population was 74,207. Its county seat is Wisconsin Rapids. The county is named after Joseph Wood, a member of the Wisconsin State Assembly. Wood County comprises the Wisconsin Rapids-Marshfield, WI Micropolitan Statistical Area and is included in the Wausau-Stevens Point-Wisconsin Rapids, WI Combined Statistical Area.
Winnebago County is a county in the U.S. state of Wisconsin. As of the 2020 census, the population was 171,730. Its county seat is Oshkosh. It was named for the historic Winnebago people, a federally recognized Native American tribe now known as the Ho-Chunk Nation. Chief Oshkosh was a Menominee leader in the area. Winnebago County comprises the Oshkosh-Neenah, WI Metropolitan Statistical Area, which is included in the Appleton-Oshkosh-Neenah, WI Combined Statistical Area.
Waushara County is a county located in the U.S. state of Wisconsin. As of the 2020 census, the population was 24,520. Its county seat is Wautoma.
Shawano County is a county located in the U.S. state of Wisconsin. As of the 2020 census, the population was 40,881. Its county seat is Shawano.
Portage County is a county in the U.S. state of Wisconsin. As of the 2020 census, the population was 70,377. Its county seat is Stevens Point.
Outagamie County is a county in the Fox Cities region of the U.S. state of Wisconsin, in the northeast of the state. As of the 2020 census, the population was 190,705. Its county seat is Appleton.
Oconto County is a county in the U.S. state of Wisconsin. As of the 2020 census, the population was 38,965. Its county seat is Oconto. The county was established in 1851.
Menominee County is a county in the U.S. state of Wisconsin. As of the 2020 census, the population was 4,255, making it the least populous county in Wisconsin. Its county seat is in the community of Keshena.
Marquette County is a county located in the U.S. state of Wisconsin. As of the 2020 census, the population was 15,592. Its county seat is Montello. The county was created in 1836 from the Wisconsin Territory and organized in 1848.
Marinette County is a county in the U.S. state of Wisconsin. As of the 2020 census, the population was 41,872. Its county seat is Marinette. Marinette County is part of the Marinette, WI–MI Micropolitan Statistical Area.
Marathon County is a county located in the U.S. state of Wisconsin. As of the 2020 census, the population was 138,013. Its county seat is Wausau. It was founded in 1850, created from a portion of Portage County. At that time the county stretched to the northern border with the Upper Peninsula of Michigan. It is named after the battlefield at Marathon, Greece.
Langlade County is a county located in the U.S. state of Wisconsin. As of the 2020 census, the population was 19,491. Its county seat is Antigo.
Jefferson County is a county in the U.S. state of Wisconsin. As of the 2020 census, the population was 84,900. Its county seat is Jefferson. Jefferson County comprises the Watertown-Fort Atkinson, WI Micropolitan Statistical Area, which is also included in the Milwaukee-Racine-Waukesha, WI Combined Statistical Area.
Green Lake County is a county located in the U.S. state of Wisconsin. As of the 2020 census, the population was 19,018. Its county seat is Green Lake. In 2020, the center of population of Wisconsin was located in Green Lake County, near the city of Markesan.
Florence County is a county located in the U.S. state of Wisconsin. As of the 2020 census, the population was 4,558, making it the second-least populous county in Wisconsin after Menominee County. Its county seat is Florence.
Dunn County is a county in the U.S. state of Wisconsin. As of the 2020 census, the population was 45,440. Its county seat is Menomonie. Dunn County comprises the Menomonie Micropolitan Statistical Area and is included in the Eau Claire-Menomonie, WI Combined Statistical Area.
Brown County is a county in the U.S. state of Wisconsin. As of the 2020 census, the population was 268,740, making it the fourth-most populous county in Wisconsin. The county seat is Green Bay. Brown County is part of the Green Bay, WI Metropolitan Statistical Area.
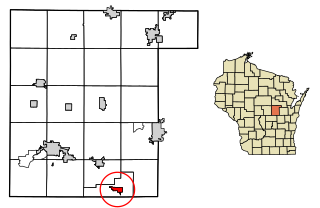
Fremont is a village in Waupaca County, Wisconsin, United States. It is surrounded by Town of Fremont. The population was 691 at the 2020 census. Fremont has been referred to as the "White Bass Capital of the World."
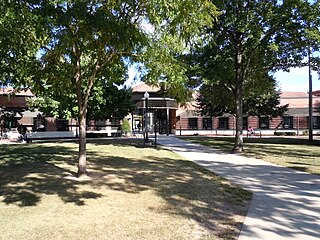
Waupaca is a city in and the county seat of Waupaca County, Wisconsin, United States. The population was 6,282 at the 2020 census.
Weyauwega is a city in Waupaca County, Wisconsin, United States. The population was 1,900 at the 2010 census.