By the early 1800s, the land and streams that are now Clark County were the hunting grounds of the Chippewa, Dakota, Ho-Chunk, and possibly Menominee peoples. In 1836, these Indigenous groups were joined by a party of French-Canadian fur traders who established a temporary post for the American Fur Company on the East Fork of the Black River.[4]
The next European-American arrivals were likely Mormon loggers in 1844, who came to harvest pine logs from the forests along the Black River. They floated the logs downstream to a sawmill at Black River Falls, where the lumber was processed and transported further downriver for use in constructing the Mormon temple in Nauvoo, Illinois. The Mormons established logging camps along the river at sites including Mormon Riffle (about a mile below Neillsville), near Weston's Rapids, and south of Greenwood. This logging operation likely ended by 1846, when most of the Mormons left the area following the murder of Joseph Smith.[5]
In June 1845, James and Henry O'Neill led a party overland from Black River Falls, cutting a road through the brush. They used oxen to pull a wagon carrying tools and supplies. Upon arriving, they built a cabin on O'Neill Creek, followed by a sawmill. Lumber from the mill was rafted down the Black River to Black River Falls and then transported to Alexander O'Neill in Burlington, Iowa. However, a storm in June 1847 caused severe flooding of the Black River, destroying all the existing sawmills. Despite this setback, the settlers rebuilt.[6]
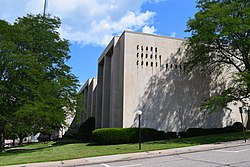
Clark County fairgrounds
Clark County was founded in 1853 and officially organized the following year.[7] The county's name origin is uncertain—it was either named for A. W. Clark, an early settler,[8] or for General George Rogers Clark.[9][10]
Electricity became available in some towns and villages around 1900 through private power plants. For example, in 1902, the Paulsen mill began supplying electricity to the village of Withee. However, rural farms remained without electricity until the late 1930s. In 1937, the newly formed Clark Electric Cooperative, funded by a loan from the New Deal's Rural Electrification Administration, began installing power lines to serve the county's rural areas.[11]
In 1920, construction began on the Clark County Asylum, located two miles east of Owen. It was the last in a network of 35 county mental hospitals established in Wisconsin, designed to provide long-term care for patients unlikely to recover. Twelve patients from the Wausau asylum assisted with construction and became the facility’s first residents. The asylum operated a farm to keep patients engaged while supplying food for the institution. By 1924, patients cultivated 60 acres of corn, 25 acres of potatoes, 16 acres of barley, 40 acres of oats, 6 acres of buckwheat, and 3 acres of millet. A dairy herd was later introduced, along with hog farming and a slaughterhouse by 1948. Over time, the institution's mission shifted from a "custodial asylum" to a "treatment hospital" and eventually to a skilled nursing facility. Today, it is known as the Clark County Rehab and Living Center.[12]
Geography
Rolling farmland on the shoulders of North Bluff north of Willard
According to the United States Census Bureau, Clark County has a total area of 1,219 square miles (3,160km2), of which 1,210 square miles (3,100km2) is land and 9.0 square miles (23km2) (0.7%) is water.[13]
As of the 2020 census, the population of Clark County was 34,659.[2] The population density was 28.7 people per square mile (11.1 people/km2).[20] There were 14,755 housing units at an average density of 12.2 units per square mile (4.7 units/km2).
The median age was 37.5 years. 28.8% of residents were under the age of 18 and 17.9% of residents were 65 years of age or older. For every 100 females there were 102.4 males, and for every 100 females age 18 and over there were 102.4 males age 18 and over.[20]
<0.1% of residents lived in urban areas, while 100.0% lived in rural areas.[22]
There were 12,768 households in the county, of which 30.8% had children under the age of 18 living in them. Of all households, 54.0% were married-couple households, 19.0% were households with a male householder and no spouse or partner present, and 19.8% were households with a female householder and no spouse or partner present. About 26.9% of all households were made up of individuals and 12.5% had someone living alone who was 65 years of age or older.[20]
There were 14,755 housing units, of which 13.5% were vacant. Among occupied housing units, 77.7% were owner-occupied and 22.3% were renter-occupied. The homeowner vacancy rate was 1.5% and the rental vacancy rate was 7.5%.[20]
2000 census
2000 Census Age Pyramid for Clark County
As of the 2000 census,[23] Clark County had a population of 33,557, with 12,047 households and 8,673 families residing in the county. The population density was 28 people per square mile (11 people/km2). There were 13,531 housing units at an average density of 11 units per square mile (4.2 units/km2).
The racial composition of the county was:
98.05% White
0.13% Black or African American
0.48% Native American
0.30% Asian
0.01% Pacific Islander
0.56% from other races
0.47% from two or more races
Additionally, 1.20% of the population identified as Hispanic or Latino of any race.
6.5% had a female householder with no husband present
28.0% were non-families
Additionally, 23.8% of all households consisted of individuals, and 12.6% had someone living alone who was 65 years or older. The average household size was 2.73, while the average family size was 3.27.
The county’s population was distributed as follows:
29.9% under the age of 18
7.7% from 18 to 24
26.2% from 25 to 44
20.2% from 45 to 64
16.0% aged 65 or older
The median age was 36 years. For every 100 females, there were 100.5 males. Among adults 18 and older, there were 98.7 males per 100 females.
In 2017, there were 554 births in the county, resulting in a general fertility rate of 99.2 births per 1,000 women aged 15–44—the second-highest rate among Wisconsin’s 72 counties. Of these, 184 births occurred at home, more than in any other county in the state.[25]
Religion
Religion in Clark County, according to ARDA (2020) [26]
Catholic Church (22.9%)
Anabaptist Churches (Amish and Mennonite) (12.5%)
Evangelical Churches (11.9%)
Mainline Protestant Churches (9.20%)
0.00%
Others (1.40%)
None (42.1%)
In 2010, the largest religious groups by reported number of adherents in Clark County were:
Along with modern farmers, the county is home to many Amish, who continue to farm using traditional methods.
In 2013, there were 16 Amish church districts in Clark County.[28]
Politics
Clark County has leaned Republican for much of its history, but it has voted for Democrats 6 times since 1950. The last Democrat to win the county was Barack Obama in 2008, and since then it has trended strongly Republican in every election. In 2020 and 2024, Donald Trump won the highest share of the vote for a Republican since Dwight Eisenhower's 1952 landslide.[29]
United States presidential election results for Clark County, Wisconsin[30]
↑Leonhardt, Kris (January 4, 2022). "It's Electrifying: The Advent of Clark County's Electrical Service". Multi Media Channels LLC. The Sentinel & Rural News.
This page is based on this Wikipedia article Text is available under the CC BY-SA 4.0 license; additional terms may apply. Images, videos and audio are available under their respective licenses.