This article needs to be updated. The reason given is: there may be entries missing from the list. Additionally, some floor areas refer solely to a skyscraper, while others include adjoining podiums or even other skyscrapers within a complex, which might cause confusion. Further revisions will be needed to clearly distinguish whether the floor area provided represents only the skyscraper or the entire complex.(December 2024) |
This list of skyscrapers by floor area includes the largest skyscrapers in the world, measured in square meters (m2) and square feet (sq ft). To qualify as a skyscraper, a structure must be self-supporting, without relying on tension cables or external supports for stability, and must reach a minimum height of 150 meters (492 feet). Furthermore, at least 50% of its height must consist of habitable floor space. [1] Structures such as communication and observation towers—like Tokyo Skytree, the CN Tower, or the Eiffel Tower—are categorized as non-building structures and are therefore excluded from this article (see list of tallest buildings and structures).
As of December 2024, and based on the criteria outlined above, the world's largest skyscraper by floor area is Tokyo's Azabudai Hills Mori JP Tower, with 461,774 m2 (4,970,490 sq ft) of floor area. Tokyo and New York City are the cities with the most skyscrapers included in the list, while China leads as the country with the highest number of entries overall.
This list ranks the largest skyscrapers in the world by floor area. To be included on this list, buildings must meet the definition of a skyscraper outlined above and have a floor area of approximately 200,000 m2 (2,200,000 sq ft) or more. The "Year" column indicates the year in which a building was completed. Buildings that are still under construction but have been topped out, as well as unfinished ones, are included but remain unranked.
Rank | Name | Image | Floor area m2(sq ft) | City | Country | Height [2] m (ft) | Floors | Year | Notes |
---|---|---|---|---|---|---|---|---|---|
1 | Azabudai Hills Mori JP Tower | 461,774 (4,970,490) | Tokyo | Japan | 325 (1,068) | 64 | 2023 |
| |
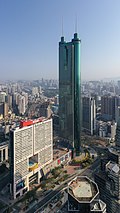
2 | Ping An Finance Center | 459,187 (4,942,650) | Shenzhen | China | 599 (1,966) | 115 | 2017 | ||
3 | Willis Tower | 423,638 (4,560,000) | Chicago | United States | 442 (1,450) | 108 | 1974 |
| |
4 | Shanghai Tower | 410,000 (4,400,000) | Shanghai | China | 632 (2,073) | 128 | 2015 |
| |
5 | Guangzhou CTF Finance Centre | 398,000 (4,280,000) | Guangzhou | 530 (1,739) | 111 | 2016 |
| ||
6 | The Exchange 106 | 385,168 (4,145,910) | Kuala Lumpur | Malaysia | 445 (1,460) | 95 | 2019 | [11] | |
7 | Shanghai World Financial Center | 381,600 (4,108,000) | Shanghai | China | 492 (1,614) | 101 | 2008 | [12] | |
8 | Roppongi Hills Mori Tower | 380,105 (4,091,420) | Tokyo | Japan | 238 (781) | 54 | 2003 | [13] [14] | |
— | Goldin Finance 117 | 370,000 (4,000,000) | Tianjin | China | 597 (1,959) | 128 | — |
| |
— | Ryugyong Hotel | 360,032 (3,875,350) | Pyongyang | North Korea | 330 (1,083) | 105 | — |
| |
9 | China Zun | 350,000 (3,800,000) | Beijing | China | 528 (1,732) | 108 | 2018 | ||
10 | Wuhan Center | 343,900 (3,702,000) | Wuhan | 438 (1,437) | 88 | 2019 | [20] | ||
11 | 55 Water Street | 341,913 (3,680,320) | New York City | United States | 209 (687) | 53 | 1972 | ||
12 | Gate to the East | 340,000 (3,700,000) | Suzhou | China | 302 (990) | 66 | 2015 | [23] [24] [25] | |
13 | Aon Center | 334,448 (3,599,970) | Chicago | United States | 346 (1,136) | 83 | 1973 | [26] | |
14 | One World Trade Center | 325,279 (3,501,270) | New York City | 541 (1,776) | 94 | 2014 | |||
15 | Dalian International Trade Center | 321,000 (3,460,000) | Dalian | China | 370 (1,214) | 86 | 2019 | ||
16 | CCTV Headquarters | 316,000 (3,400,000) | Beijing | 234 (768) | 51 | 2012 | [31] [32] [33] | ||
17 | Grand Tower | 315,282 (3,393,670) | Moscow | Russia | 283 (928) | 62 | 2024 | [34] | |
18 | Abraj Al-Bait Clock Tower | 310,638 (3,343,680) | Mecca | Saudi Arabia | 601 (1,971) | 120 | 2012 | ||
19 | Suzhou IFS | 310,000 (3,300,000) | Suzhou | China | 450 (1,476) | 95 | 2019 |
| |
20 | Burj Khalifa | 309,473 (3,331,140) | Dubai | United Arab Emirates | 828 (2,717) | 163 | 2010 |
| |
21 | 85 Sky Tower | 306,337 (3,297,380) | Kaohsiung | Taiwan | 348 (1,140) | 85 | 1997 |
| |
22 | Lotte World Tower | 304,081 (3,273,100) | Seoul | South Korea | 555 (1,819) | 123 | 2016 | ||
23 | Wuhan Greenland Center | 303,275 (3,264,420) | Wuhan | China | 476 (1,560) | 97 | 2022 |
| |
24 | Landmark 72 | 300,000 (3,200,000) | Hanoi | Vietnam | 329 | 72 | 2012 | ||
25 | Changsha IFS Tower T1 | 300,000 (3,200,000) | Changsha | China | 452 (1,483) | 88 | 2018 | ||
26 | Merdeka 118 | 292,000 (3,140,000) | Kuala Lumpur | Malaysia | 679 (2,227) | 118 | 2022 | ||
27 | Tianjin CTF Finance Centre | 291,610 (3,138,900) | Tianjin | China | 530 (1,739) | 98 | 2019 |
| |
28 | Xi'an Glory International Financial Center | 289,978 (3,121,300) | Xi'an | 350 (1,148) | 75 | 2022 | |||
29 | Jin Mao Tower | 289,500 (3,116,000) | Shanghai | 421 (1,380) | 88 | 1999 | [54] | ||
30 | Imperia Tower | 287,724 (3,097,040) | Moscow | Russia | 239 (783) | 61 | 2011 | [55] | |
31 | Tokyo Midtown Yaesu Yaesu Central Tower | 283,896 (3,055,830) | Tokyo | Japan | 240 (787) | 45 | 2022 | [56] [57] [58] | |
32 | Shun Hing Square | 280,000 (3,000,000) | Shenzhen | China | 384 (1,260) | 69 | 1996 | [59] | |
33 | China World Tower | Beijing | 330 (1,083) | 74 | 2010 | [60] | |||
34 | International Commerce Centre | 274,064 (2,950,000) | Hong Kong | 484 (1,588) | 108 | 2010 |
| ||
35 | Guangxi China Resources Tower | 272,255 (2,930,530) | Nanning | 403 (1,321) | 85 | 2020 |
| ||
36 | 50 Hudson Yards | 269,000 (2,900,000) | New York City | United States | 299 (981) | 58 | 2022 | [63] [64] [65] | |
37 | China Resources Headquarters | 268,713 (2,892,400) | Shenzhen | China | 393 (1,288) | 67 | 2017 | [66] [67] [68] | |
— | Blue Front Shibaura S Tower | 268,167 (2,886,530) | Tokyo | Japan | 229 (751) | 43 | 2025 | ||
38 | JR Gate Tower | 265,576 (2,858,640) | Nagoya | Japan | 220 (722) | 46 | 2017 | [71] [72] [73] | |
39 | The Spiral | 264,774 (2,850,000) | New York City | United States | 314 (1,031) | 66 | 2022 | [74] | |
40 | Shinjuku Park Tower | 264,141 (2,843,190) | Tokyo | Japan | 235 (771) | 52 | 1994 | [75] | |
41 | Golden Eagle Tiandi Tower A | 263,992 (2,841,590) | Nanjing | China | 368 (1,208) | 76 | 2019 | [76] [77] | |
42 | MetLife Building | 263,985 (2,841,510) | New York City | United States | 246 (808) | 59 | 1963 | [78] | |
43 | 3 World Trade Center | 260,129 (2,800,010) | New York City | United States | 329 (1,079) | 69 | 2018 | [79] [80] | |
44 | John Hancock Center | 260,126 (2,799,970) | Chicago | 344 (1,128) | 100 | 1969 | [81] | ||
45 | Yokohama Landmark Tower | 259,000 (2,790,000) | Yokohama | Japan | 296 (972) | 70 | 1993 | ||
46 | First Canadian Place | 250,849 (2,700,120) | Toronto | Canada | 298 (978) | 72 | 1975 | [84] | |
47 | Guangzhou International Finance Center | 250,095 (2,692,000) | Guangzhou | China | 439 (1,439) | 103 | 2010 | [85] [86] | |
48 | Landmark 81 | 249,000 (2,680,000) | Ho Chi Minh City | Vietnam | 461 (1,513) | 81 | 2018 |
| |
— | International Land-Sea Center | 248,470 (2,674,500) | Chongqing | China | 458 (1,503) | 98 | 2025 |
| |
49 | 225 Liberty Street | 247,793 (2,667,220) | New York City | United States | 197 (645) | 44 | 1986 | [89] | |
50 | Midtown Tower | 246,408 (2,652,310) | Tokyo | Japan | 248 (814) | 54 | 2007 | [90] [91] [92] | |
51 | Toranomon Hills Mori Tower | 244,360 (2,630,300) | 256 (838) | 52 | 2014 | [93] [94] | |||
52 | Tokyo Opera City Tower | 242,261 (2,607,680) | 234 (769) | 54 | 1996 | [95] [96] [97] | |||
53 | Trump International Hotel and Tower (Chicago) | 241,548 (2,600,000) | Chicago | United States | 423 (1,389) | 98 | 2009 | [98] | |
54 | 30 Hudson Yards | 241,548 (2,600,000) | New York City | 387 (1,270) | 73 | 2019 | [99] | ||
55 | Iconic Tower | 241,000 (2,590,000) | New Administrative Capital | Egypt | 394 (1,292) | 77 | 2024 | [100] [101] | |
56 | One Penn Plaza | 240,296 (2,586,520) | New York City | United States | 229 (750) | 57 | 1972 | [102] | |
57 | Toranomon Hills Station Tower | 236,640 (2,547,200) | Tokyo | Japan | 266 (872) | 49 | 2023 | [103] [104] | |
58 | 4 World Trade Center | 232,258 (2,500,000) | New York City | United States | 298 (977) | 72 | 2014 | [105] [106] [107] | |
59 | Ping An Finance Center Tower 1 | 226,280 (2,435,700) | Jinan | China | 360 (1,181) | 63 | 2023 | [108] | |
60 | China World Tower B | 225,806 (2,430,560) | Beijing | 296 (970) | 59 | 2017 | [109] | ||
— | 270 Park Avenue | 224,882 (2,420,610) | New York City | United States | 423 (1,388) | 60 | 2025 |
| |
61 | Parc1 Tower 1 | 223,340 (2,404,000) | Seoul | South Korea | 333 (1,093) | 69 | 2020 | [111] [112] | |
62 | KK100 | 220,000 (2,400,000) | Shenzhen | China | 442 (1,449) | 98 | 2011 | [113] | |
63 | Sanno Park Tower | 219,215 (2,359,610) | Tokyo | Japan | 194 (638) | 44 | 2000 | [114] [115] [116] | |
64 | Paramount Plaza | 219,172 (2,359,150) | New York City | United States | 204 (670) | 48 | 1970 | [117] | |
65 | Guangxi Finance Plaza | 219,000 (2,360,000) | Nanning | China | 321 (1,053) | 68 | 2017 | [118] | |
66 | Blue Cross Blue Shield Tower | 217,756 (2,343,910) | Chicago | United States | 227 (744) | 54 | 2010 | [119] | |
67 | U.S. Steel Tower | 217,045 (2,336,250) | Pittsburgh | 256 (841) | 64 | 1970 | [120] | ||
68 | Greenland Group Suzhou Center | 216,628 (2,331,760) | Suzhou | China | 358 (1,175) | 77 | 2024 | [121] [122] [123] | |
69 | Minying International Trade Center T1 | 215,000 (2,310,000) | Dongguan | 423 (1,386) | 85 | 2021 | [124] [125] | ||
70 | Cœur Défense | 214,698 (2,310,990) | Courbevoie | France | 161 (528) | 40 | 2001 | [126] [127] | |
71 | Dentsu HQ Building | 213,949 (2,302,930) | Tokyo | Japan | 213 (700) | 48 | 2002 | [128] [129] [130] [131] | |
72 | 28 Liberty Street (One Chase Manhattan Plaza) | 213,675 (2,299,980) | New York City | United States | 248 (813) | 60 | 1961 | [132] | |
73 | Eurasia | 212,900 (2,292,000) | Moscow | Russia | 309 (1,013) | 72 | 2015 | [133] | |
74 | Jiuzhou International Tower | 212,587 (2,288,270) | Nanning | China | 318 (1,043) | 71 | 2017 | [134] [135] | |
75 | Abeno Harukas | 212,208 (2,284,190) | Osaka | Japan | 300 (984) | 60 | 2014 | [136] [137] | |
76 | Pearl River Tower | 212,165 (2,283,730) | Guangzhou | China | 310 (1,016) | 71 | 2012 | [138] [139] [140] | |
77 | JP Tower | 212,043 (2,282,410) | Tokyo | Japan | 200 (656) | 38 | 2012 | [141] [142] [143] | |
78 | Fortune Center | 210,477 (2,265,560) | Guangzhou | China | 309 (1,015) | 68 | 2015 | [144] | |
79 | Longxi International Hotel | 210,000 (2,300,000) | Wuxi | 328 (1,076) | 72 | 2011 | [145] [146] | ||
80 | Tokyo World Gate Akasaka Trust Tower | 209,689 (2,257,070) | Tokyo | Japan | 209 (686) | 43 | 2024 | [147] [148] [149] | |
81 | Empire State Building | 208,879 (2,248,350) | New York City | United States | 381 (1,250) | 102 | 1931 | [150] [151] | |
82 | CITIC Plaza | 205,239 (2,209,170) | Guangzhou | China | 390 (1,280) | 80 | 1996 | [152] | |
83 | One Liberty Plaza | 204,387 (2,200,000) | New York City | United States | 226 (743) | 54 | 1972 | [153] | |
84 | Chase Tower (Chicago) | 204,385 (2,199,980) | Chicago | 259 (850) | 60 | 1969 | [154] [155] [156] | ||
85 | 1221 Avenue of the Americas | 204,385 (2,199,980) | New York City | 205 (674) | 51 | 1972 | [157] | ||
86 | Tianjin World Financial Center | 203,953 (2,195,330) | Tianjin | China | 337 (1,105) | 75 | 2011 | [158] | |
87 | 22 Bishopsgate | 201,970 (2,174,000) | London | United Kingdom | 278 (913) | 62 | 2020 | [159] [160] |
This list includes the world's largest skyscraper complexes by floor area. A skyscraper complex may include multiple skyscrapers, as well as other buildings or facilities, that are either physically connected or part of the same development project. To be included, a complex must have a total floor area of approximately 250,000 m2 (2,700,000 sq ft) or more. The "Height" column indicates the height of the tallest building within the complex, which may not necessarily have the largest floor area. The "Year" column indicates the completion year of the most recent building within the complex.
Name | Floor area m2(sq ft) | City | Country | Height [2] m (ft) | Year | Notes |
---|---|---|---|---|---|---|
Abraj Al-Bait | 1,575,815 (16,961,930) | Mecca | Saudi Arabia | 601 (1,971) | 2012 | |
Hudson Yards | 986,766 (10,621,460)+ | New York City | United States | 387 (1,270) | 2022 |
|
World Trade Center | 973,847 (10,482,400)+ | 541 (1,776) | 2018 | |||
Golden Eagle Tiandi | 920,000 (9,900,000) | Nanjing | China | 368 (1,208) | 2019 | |
Azabudai Hills | 860,400 (9,261,000) | Tokyo | Japan | 325 (1,068) | 2025 | |
China Resources Shenzhen Bay | 858,738 (9,243,380) | Shenzhen | China | 393 (1,288) | 2021 | |
Raffles City Chongqing | 817,000 (8,790,000)+ | Chongqing | China | 355 (1,163) | 2019 | |
Lotte World Tower | 805,872 (8,674,330) | Seoul | South Korea | 555 (1,819) | 2016 |
|
Roppongi Hills | 793,165 (8,537,560) | Tokyo | Japan | 238 (781) | 2003 | |
Toranomon Hills | 792,900 (8,535,000) | 266 (872) | 2023 | |||
Iconsiam | 750,000 (8,100,000) | Bangkok | Thailand | 316 (1,037) | 2019 | |
Berjaya Times Square | 695,995 (7,491,630) | Kuala Lumpur | Malaysia | 203 (666) | 2003 | |
Ping An Finance Center | 690,928 (7,437,090)+ | Shenzhen | China | 599 (1,966) | 2022 | |
JR Central Station | 682,576 (7,347,190) | Nagoya | Japan | 245 (804) | 2017 |
|
Merdeka 118 | 673,862 (7,253,390) | Kuala Lumpur | Malaysia | 679 (2,227) | 2023 | [49] [50] |
Haeundae LCT The Sharp | 661,138 (7,116,430) | Busan | South Korea | 412 (1,350) | 2019 | |
Landmark 72 | 609,673 (6,562,470) | Hanoi | Vietnam | 329 (1,078) | 2012 | |
Marina Bay Sands | 581,400 (6,258,000) | Singapore | Singapore | 207 (679) | 2010 | |
Shanghai Tower | 578,000 (6,220,000) | Shanghai | China | 632 (2,073) | 2015 |
|
Abu Dhabi Plaza | 550,000 (5,900,000) | Astana | Kazakhstan | 311 (1,020) | 2021 |
|
Petronas Towers | 536,300 (5,773,000) | Kuala Lumpur | Malaysia | 452 (1,483) | 2012 |
|
Renaissance Center | 515,798 (5,552,000) | Detroit | United States | 222 (727) | 1981 |
|
Yaesu Redevelopment | 514,813 (5,541,400) | Tokyo | Japan | 250 (819) | 2025 |
|
Guangzhou CTF Finance Centre | 507,681 (5,464,630) | Guangzhou | China | 530 (1,739) | 2016 | [10] |
CCTV Headquarters | 473,000 (5,090,000) | Beijing | 234 (768) | 2012 | [31] [32] [33] | |
Thamrin Nine | 470,000 (5,100,000) | Jakarta | Indonesia | 383 (1,256) | 2023 |
|
The Exchange 106 | 453,835 (4,885,040) | Kuala Lumpur | Malaysia | 445 (1,460) | 2019 |
|
Guangzhou International Finance Center | 448,371 (4,826,230) | Guangzhou | China | 440 (1,440) | 2010 | [85] [86] |
Federation Tower | 439,154 (4,727,010) | Moscow | Russia | 374 (1,226) | 2016 |
|
Spring City 66 (Hang Lung Plaza) | 432,000 (4,650,000) | Kunming | China | 349 (1,145) | 2023 | |
China Zun | 427,000 (4,600,000) | Beijing | 528 (1,732) | 2018 | [17] [18] [19] | |
Taipei 101 | 412,500 (4,440,000) | Taipei | Taiwan | 508 (1,667) | 2004 | |
Suzhou IFS | 393,200 (4,232,000) | Suzhou | China | 450 (1,476) | 2019 | [37] |
Yokohama Landmark Tower | 392,885 (4,228,980) | Yokohama | Japan | 296 (972) | 1993 | [82] [83] |
Tianjin CTF Finance Centre | 389,980 (4,197,700) | Tianjin | China | 530 (1,739) | 2019 | [51] |
Tokyo Metropolitan Government | 380,504 (4,095,710) | Tokyo | Japan | 243 (799) | 1991 | |
Otemachi One | 357,700 (3,850,000) | 200 (656) | 2020 | |||
Neva Towers | 349,232 (3,759,100) | Moscow | Russia | 345 (1,132) | 2020 |
|
Osaka Umeda Twin Towers North | 329,635 (3,548,160) | Osaka | Japan | 187 (614) | 2012 | |
Abeno Harukas | 305,901 (3,292,690) | 300 (984) | 2014 | |||
Forum 66 | 305,114 (3,284,220) | Shenyang | China | 351 (1,150) | 2015 | |
Al Hamra Tower | 290,000 (3,100,000) | Kuwait City | Kuwait | 413 (1,354) | 2011 | |
OKO | 290,000 (3,100,000) | Moscow | Russia | 354 (1,160) | 2015 | |
Greenland Group Suzhou Center | 284,828 (3,065,860) | Suzhou | China | 358 (1,175) | 2024 | |
Brookfield Place (Toronto) | 276,110 (2,972,000) | Toronto | Canada | 263 (863) | 1992 |
The tables below list skyscrapers currently under construction and proposed for construction, with floor areas expected to reach approximately 250,000 m2 (2,700,000 sq ft) or more. Visionary projects are excluded.
Name | Floor area m2(sq ft) | Floor area (Complex) m2(sq ft) | City | Country | Height [2] m (ft) | Floors | Year | Notes |
---|---|---|---|---|---|---|---|---|
Torch Tower | 553,000 (5,950,000) | 748,000 (8,050,000) | Tokyo | Japan | 385 (1,263) | 62 | 2028 |
|
Yaesu 2-Chōme Central District Redevelopment | 388,562 (4,182,450) | — | 223 (733) | 43 | 2029 | [213] | ||
Hainan Center (Haikou Tower 1) | 387,423 (4,170,190) | — | Haikou | China | 428 (1,404) | 94 | 2027 | |
Nihonbashi 1-Chōme Central District Redevelopment | 374,004 (4,025,750) | 480,000 (5,200,000) | Tokyo | Japan | 284 (932) | 52 | 2026 | |
North Bund Tower | 349,616 (3,763,240) | — | Shanghai | China | 480 (1,575) | 97 | 2030 | [217] |
Blue Front Shibaura S Tower | 268,167 (2,886,530) | 550,209 (5,922,400) | Tokyo | Japan | 229 (751) | 43 | 2025 | |
Shinjuku Station West Gate Redevelopment | 251,000 (2,700,000) | 279,057 (3,003,740) | Tokyo | Japan | 258 (847) | 48 | 2030 | [218] [219] |
Wuhan CTF Finance Center | 250,000 (2,700,000) | 680,000 (7,300,000) | Wuhan | China | 475 (1,558) | 84 | 2029 | [220] [221] |
Name | Floor area m2(sq ft) | Floor area (Complex) m2(sq ft) | City | Country | Height [2] m (ft) | Floors | Year | Notes |
---|---|---|---|---|---|---|---|---|
Roppongi 5-Chōme West District Building A-1 | 794,450 (8,551,400) | 1,081,960 (11,646,100) | Tokyo | Japan | 327 (1,073) | 66 | 2030 | |
Tokyo Cross Park Central Tower | 361,000 (3,890,000) | 1,068,000 (11,500,000)+ | 235 (769) | 48 | 2029 |
| ||
Ikebukuro Station West Exit Redevelopment Building B | 301,200 (3,242,000) | 582,700 (6,272,000) | 270 (886) | 50 | 2040 |
| ||
Nakano Station New North Entrance | 298,000 (3,210,000) | — | 262 (860) | 61 | 2029 | [227] | ||
Tokyo Cross Park South Tower | 287,000 (3,090,000) | 1,068,000 (11,500,000)+ | 233 (763) | 45 | 2027 | [225] | ||
Nihonbashi 1-Chōme East District Block A | 274,000 (2,950,000) | 384,000 (4,130,000) | 205 (673) | 40 | 2032 | |||
Tokyo Cross Park North Tower | 270,000 (2,900,000) | 1,068,000 (11,500,000)+ | 230 (755) | 46 | 2030 | [225] [230] | ||
Shibuya 2-Chōme West District Redevelopment Tower B | 255,000 (2,740,000) | 322,200 (3,468,000) | 208 (682) | 41 | 2029 |
|
This is a list of buildings that once held the title of largest skyscraper in the world by floor area. The Empire State Building and the original World Trade Center Twin Towers each held this distinction for nearly 30 years. Currently, the title belongs to Azabudai Hills Mori JP Tower.
Name | Image | Years as largest | Floor area m2(sq ft) | City | Country | Height [2] m (ft) | Floors | Notes |
---|---|---|---|---|---|---|---|---|
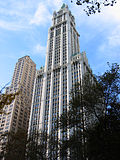
Woolworth Building | 1913–1915 | 120,773 (1,299,990) | New York City | United States | 241 (792) | 58 | [232] | |
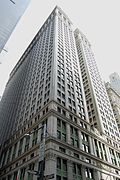
Equitable Building (Manhattan) | 1915–1931 | 160,655 (1,729,280) | 169 (555) | 38 | [233] | |||
Empire State Building | 1931–1961 | 208,879 (2,248,350) | 381 (1,250) | 102 | [150] [151] | |||
28 Liberty Street (One Chase Manhattan Plaza) | 1961–1963 | 213,675 (2,299,980) | 248 (813) | 60 | [132] | |||
MetLife Building | 1963–1972 | 263,985 (2,841,510) | 246 (808) | 59 | [78] | |||
1 World Trade Center (1971–2001) | 1972–2001 | 429,583 (4,623,990) | New York City | United States | 417 (1,368) | 110 | [234] | |
2 World Trade Center (1971–2001) | 1973–2001 | 429,583 (4,623,990) | 415 (1,362) | 110 | [234] | |||
Willis Tower | 2001–2017 | 423,638 (4,560,000) | Chicago | United States | 442 (1,450) | 108 | [8] | |
Ping An Finance Center | 2017–2023 | 459,187 (4,942,650) | Shenzhen | China | 599 (1,966) | 115 | [5] | |
Azabudai Hills Mori JP Tower | 2023–present | 461,774 (4,970,490) | Tokyo | Japan | 325 (1,068) | 64 | [3] [4] |
The Mizuho Bank Uchisaiwaichō Head Office Building was a 143 m (469 ft) tall office skyscraper in Tokyo, Japan. At 38 stories the building was the 86th tallest building in Tokyo. It contained 1.4 million sq ft of office space, 100% of which was now occupied by Mizuho Bank, the consumer banking arm of the second-largest Japanese financial conglomerate Mizuho Financial Group, while still called the DKB Head Office from time to time.
World Trade Center Building (世界貿易センタービルディング) was a 40-story commercial skyscraper located in Hamamatsuchō, Minato, Tokyo. Completed in 1970, the building is one of Japan's earliest skyscrapers. Upon its completion, the 163-meter-tall WTC Building took the title of Japan's tallest skyscraper from the Kasumigaseki Building; it retained this title until Keio Plaza Hotel's North Tower was completed one year later.
Azabudai Hills is a complex of three skyscrapers in Tokyo, Japan. Upon its completion in 2023, the Azabudai Hills Mori JP Tower in the development became the tallest building in Tokyo and Japan.
The Torch Tower is a supertall skyscraper under construction in the Tokyo Torch redevelopment district in Tokyo, Japan. Scheduled to be completed in 2027, it will be the tallest building in Japan, surpassing the 325.2 m (1,067 ft) Azabudai Hills Mori JP Tower.
The China International Silk Road Center is a supertall skyscraper on-hold in Xi'an, Shaanxi, China. The original design called for a 501-meter (1,644 ft)-tall building, but the height was changed to 498-meter (1,634 ft) because of new skyscraper regulations in China. The skyscraper will be the tallest in Xi'an. It is being developed by Chinese developer Greenland Group.
Tokyu Kabukicho Tower is a 48-storey skyscraper located in the Kabukichō district of Shinjuku, Tokyo, Japan. The 225 m (738 ft) tower was designed by Yuko Nagayama & Associates and developed by Shimizu Corporation. It was completed in 2023 as Japan's 19th tallest building.