Pennsylvania's 5th congressional district | |
---|---|
Interactive map of district boundaries since January 3, 2023 (Delaware County outlined in red) | |
Representative | |
Population (2023) | 757,986 |
Median household income | $81,754 |
Ethnicity |
|
Cook PVI | D+14 [1] |
Pennsylvania's fifth congressional district encompasses all of Delaware County, an exclave of Chester County, a small portion of southern Montgomery County and a section of southern Philadelphia. Democrat Mary Gay Scanlon represents the district.
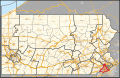
Prior to 2018, the fifth district was located in north-central Pennsylvania and was the largest in area, and therefore least densely populated, of all of Pennsylvania's congressional districts. It was Republican-leaning and represented by Glenn Thompson (R). However, in February 2018, the Supreme Court of Pennsylvania redrew this district after ruling the previous congressional district map unconstitutional due to partisan gerrymandering, assigning its number to a more left-leaning district in southeastern Pennsylvania for the 2018 elections and representation thereafter–essentially, a successor to the old seventh district. Most of Thompson's territory became a new, heavily Republican 15th district. [2] He was re-elected there.
The 5th district is mostly suburban, but contains some urban and rural areas as well. The entirety of Delaware County and the majority of both the Main Line Suburbs and South Philadelphia are part of this district. The district is fairly diverse compared to others in Pennsylvania, and is roughly 25% African American.
Year | Office | Results [3] [4] |
---|---|---|
2008 | President | Obama 63% - 36% |
Attorney General | Morganelli 54% - 46% | |
Auditor General | Wagner 62% - 38% | |
2010 | Senate | Sestak 60% - 40% |
Governor | Onorato 57% - 43% | |
2012 | President | Obama 64% - 36% |
Senate | Casey Jr. 65% - 35% | |
2014 | Governor | Wolf 64% - 36% |
2016 | President | Clinton 63% - 34% |
Senate | McGinty 59% - 39% | |
Attorney General | Shapiro 62% - 38% | |
Treasurer | Torsella 61% - 36% | |
Auditor General | DePasquale 59% - 38% | |
2018 | Senate | Casey Jr. 68% - 31% |
Governor | Wolf 70% - 29% | |
2020 | President | Biden 66% - 33% |
Attorney General | Shapiro 64% - 34% | |
Treasurer | Torsella 62% - 36% | |
Auditor General | Ahmad 60% - 36% | |
2022 | Senate | Fetterman 65% - 32% |
Governor | Shapiro 70% - 28% | |
2024 | President | Harris 64% - 35% |
Senate | Casey Jr. 63% - 35% |
Delaware County (50)
MontgomeryCounty (5)
Philadelphia neighborhoods in the 5th district include: [5]
District created in 1791 from the at-large district .
Representative | Party | Years | Cong ress | Electoral history | |
---|---|---|---|---|---|
District first established March 4, 1791 | |||||
John W. Kittera (Lancaster) | Pro-Administration | March 4, 1791 – March 3, 1793 | 2nd | Elected in 1791. Redistricted to the at-large district . |
District redistricted in 1793 to the at-large district .
District restored in 1795.
Years | Cong ress | Seat A | Seat B | ||||||
---|---|---|---|---|---|---|---|---|---|
Representative | Party | Electoral history | Representative | Party | Electoral history | ||||
March 4, 1813 – April 8, 1813 | 13th | William Crawford (Gettysburg) | Democratic-Republican | Redistricted from the 6th district and re-elected in 1812. Re-elected in 1814. Lost re-election. | Robert Whitehill (Camp Hill) | Democratic-Republican | Redistricted from the 4th district and re-elected in 1812. Died. | ||
April 8, 1813 – May 11, 1813 | Vacant | ||||||||
May 11, 1813 – March 3, 1815 | John Rea (Chambersburg) | Democratic-Republican | Elected to finish Whitehill's term. Retired. | ||||||
March 4, 1815 – March 3, 1817 | 14th | William Maclay (Fannettsburg) | Democratic-Republican | Elected in 1814. Re-elected in 1816. Retired. | |||||
March 4, 1817 – March 3, 1819 | 15th | Andrew Boden (Carlisle) | Democratic-Republican | Elected in 1816. Re-elected in 1818. Retired. | |||||
March 4, 1819 – May 15, 1820 | 16th | David Fullerton (Greencastle) | Democratic-Republican | Elected in 1818. Resigned. | |||||
May 15, 1820 – November 13, 1820 | Vacant | ||||||||
November 13, 1820 – March 3, 1821 | Thomas Grubb McCullough (Chambersburg) | Federalist | Elected October 10, 1820, to finish Fullerton's term and seated November 13, 1820. Did not run in the same day's election to the next term. | ||||||
March 4, 1821 – December 12, 1821 | 17th | Vacant | Representative-elect James Duncan resigned before assembly of Congress. | ![]() James McSherry (Petersburg) | Federalist | Elected in 1820. Redistricted to the 11th district and lost re-election. | |||
December 12, 1821 – March 3, 1823 | John Findlay (Chambersburg) | Democratic-Republican | Elected October 9, 1821, to finish Duncan's term and seated December 12, 1821. Redistricted to the 11th district . |
Party | Candidate | Votes | % | |
---|---|---|---|---|
Republican | John E. Peterson (incumbent) | 147,570 | 82.7% | |
Libertarian | Thomas A. Martin | 17,020 | 9.5% | |
Green | William M. Belitskus | 13,875 | 7.8% | |
Total votes | 178,465 | 100% | ||
Republican hold |
Party | Candidate | Votes | % | |
---|---|---|---|---|
Republican | John E. Peterson (incumbent) | 124,942 | 87.4% | |
Libertarian | Thomas A. Martin | 18,078 | 12.6% | |
Total votes | 143,020 | 100% | ||
Republican hold |
Party | Candidate | Votes | % | |
---|---|---|---|---|
Republican | John E. Peterson (incumbent) | 192,852 | 88.0% | |
Libertarian | Thomas A. Martin | 26,239 | 12.0% | |
Total votes | 219,091 | 100% | ||
Republican hold |
Party | Candidate | Votes | % | |
---|---|---|---|---|
Republican | John E. Peterson (incumbent) | 115,126 | 60.1% | |
Democratic | Donald L. Hilliard | 76,456 | 39.9% | |
Total votes | 191,582 | 100% | ||
Republican hold |
Party | Candidate | Votes | % | |
---|---|---|---|---|
Republican | Glenn Thompson | 155,513 | 56.7% | |
Democratic | Mark B. McCracken | 112,509 | 41.0% | |
Libertarian | James Fryman | 6,155 | 2.2% | |
Total votes | 274,177 | 99.9% | ||
Republican hold |
Party | Candidate | Votes | % | |
---|---|---|---|---|
Republican | Glenn Thompson (incumbent) | 125,740 | 68.6% | |
Democratic | Michael Pipe | 51,848 | 28.3% | |
Libertarian | Vernon L. Etzel | 5,654 | 3.1% | |
Total votes | 182,972 | 100% | ||
Republican hold |
Party | Candidate | Votes | % | |
---|---|---|---|---|
Republican | Glenn Thompson (incumbent) | 177,704 | 62.9% | |
Democratic | Charles Dumas | 104,710 | 37.1% | |
Total votes | 282,414 | 100% | ||
Republican hold |
Party | Candidate | Votes | % | |
---|---|---|---|---|
Republican | Glenn Thompson (Incumbent) | 115,018 | 63.60% | |
Democratic | Kerith Strano Taylor | 65,839 | 36.40% | |
Total votes | 180,857 | 100% | ||
Republican hold |
Party | Candidate | Votes | % | |
---|---|---|---|---|
Republican | Glenn Thompson (Incumbent) | 206,761 | 67.16% | |
Democratic | Kerith Strano Taylor | 101,082 | 32.84% | |
Total votes | 307,843 | 100% | ||
Republican hold |
Party | Candidate | Votes | % | |
---|---|---|---|---|
Democratic | Mary Gay Scanlon | 198,639 | 65.2% | |
Republican | Pearl Kim | 106,075 | 34.8% | |
Total votes | 304,714 | 100% | ||
Democratic gain from Republican |
Party | Candidate | Votes | % | |
---|---|---|---|---|
Democratic | Mary Gay Scanlon (incumbent) | 255,743 | 64.7 | |
Republican | Dasha Pruett | 139,552 | 35.3 | |
Total votes | 395,295 | 100.0 | ||
Democratic hold |
Party | Candidate | Votes | % | |
---|---|---|---|---|
Democratic | Mary Gay Scanlon (incumbent) | 205,128 | 65.1 | |
Republican | David Galluch | 110,058 | 34.9 | |
Total votes | 315,186 | 100.0 | ||
Democratic hold |