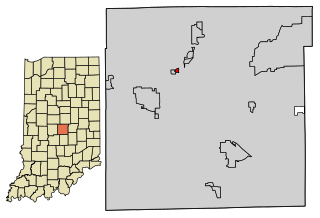
Alexandria is a city in Monroe Township, Madison County, Indiana, United States. It is about 48 miles (77 km) northeast of Indianapolis. According to the 2020 census, its population was 5,149, nearly unchanged from 2010.
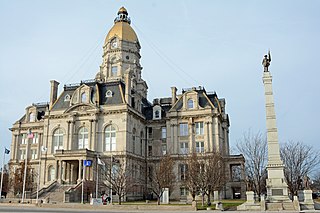
Vigo County is a county on the western border of the U.S. state of Indiana. According to the 2020 United States Census, it had a population of 106,153. Its county seat is Terre Haute.

Hendricks County is a county in the U.S. state of Indiana. As of the 2020 United States Census, the population was 174,788. The county seat is the town of Danville.

Hancock County is a county in the U.S. state of Indiana. The 2020 United States Census recorded a population of 79,840. The county seat is Greenfield.

Hamilton County is a county in the U.S. state of Indiana. The 2020 United States Census recorded a population of 347,467. The county seat is Noblesville.

Boone County is a county in the U.S. state of Indiana. As of 2020, the population was 70,812. The county seat is Lebanon.

Cumberland is a town in Hancock and Marion counties, Indiana, United States. The population was 5,954 at the 2020 census, up from 5,169 in 2010.
Beech Grove is a city in Marion County, Indiana, United States. As of the 2020 census, the city's population is 14,717. The city is located within the Indianapolis metropolitan area. Beech Grove is designated an "excluded city" under Indiana law, as it is not part of the consolidated government of Indianapolis and Marion County.
Lawrence is a city in Marion County, Indiana, United States. It is one of four "excluded cities" in Marion County. The city is home to Fort Benjamin Harrison within Fort Harrison State Park. The population was 49,370 at the 2020 census. The city is on the northeast side of Indianapolis.

Southport is an excluded city in Marion County, Indiana, United States. The population was 2,123 at the 2020 census, up from 1,712 in 2010.

Speedway is a town in Wayne Township, Marion County, Indiana, United States. The population was 13,952 at the 2020 census, up from 11,812 in 2010. Speedway, which is an enclave of Indianapolis, is the home of the Indianapolis Motor Speedway.

Meridian Hills is a town in Washington Township, Marion County, Indiana, about 8 miles (13 km) north of downtown Indianapolis. It had a population of 1,774 at the 2020 census, up from 1,616 in 2010.

North Crows Nest is a town in Washington Township, Marion County, Indiana, United States. It is approximately 7 miles (11 km) north of downtown Indianapolis. The population was 44 at the 2020 census. It has existed as an "included town" since 1970, when it was incorporated into Indianapolis as part of Unigov. It is part of Indianapolis, but retains town governmental powers under IC 36-3-1-11.
Spring Hill is a town in Marion County, Indiana, United States. The population was 95 at the 2020 census. It has existed as an "included town" since 1970, when it was incorporated into Indianapolis as part of Unigov. It is part of Indianapolis, but retains town governmental powers under IC 36-3-1-11.

Warren Park is a town in Warren Township, Marion County, Indiana, United States. The population was 1,490 at the 2020 census. It has existed as an "included town" since 1970, when it was incorporated into Indianapolis as part of Unigov. It is part of Indianapolis, but retains a functioning town government under IC 36-3-1-11.
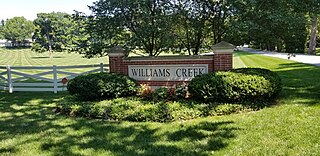
Williams Creek is a town in Washington Township, Marion County, Indiana, United States. It is located about 9 miles (14 km) north of downtown Indianapolis. The population was 430 at the 2020 census. It has existed as an "included town" since 1970, when it was incorporated into Indianapolis as part of Unigov. It is part of Indianapolis, but retains a functioning town government under IC 36-3-1-11.

Wynnedale is a town in Washington Township, Marion County, Indiana, United States. The population was 215 at the 2020 census. It has existed as an "included town" since 1970, when it was incorporated into Indianapolis as part of Unigov. It is part of Indianapolis, but retains a functioning town government under IC 36-3-1-11.

Crows Nest is a town in Washington Township, Marion County, Indiana, United States, approximately 7 miles (11 km) north of downtown Indianapolis. The population was 67 at the 2020 census. It has existed as an "included town" since 1970, when it was incorporated into Indianapolis as part of Unigov. It is part of Indianapolis, but retains a functioning town government under IC 36-3-1-11.

Unigov is the colloquial name adopted by the city of Indianapolis, Indiana, to describe its consolidated city–county government. By an act of the Indiana General Assembly, Indianapolis consolidated with the government of Marion County in 1970.
Homecroft is a town in Perry Township, Marion County, Indiana, United States. The population was 752 at the 2020 census. Incorporated in 1949, it has existed as an included town since 1970, when it was incorporated into Indianapolis as part of Unigov. It is part of Indianapolis, but retains a functioning town government under IC 36-3-1-11.