Ford Motor Company assembly line: the classical example of a manufacturing production system.Post office queue. Operations management studies both manufacturing and services.
It is concerned with managing an entire production system that converts inputs (in the forms of raw materials, labor, consumables, and energy) into outputs (in the form of goods and services for consumers).[2] Operations management covers sectors like banking systems, hospitals, companies, working with suppliers, customers, and using technology. Operations is one of the major functions in an organization along with supply chains, marketing, finance and human resources. The operations function requires management of both the strategic and day-to-day production of goods and services.[3]
In managing manufacturing or service operations, several types of decisions are made including operations strategy, product design, process design, quality management, capacity, facilities planning, production planning and inventory control. Each of these requires an ability to analyze the current situation and find better solutions to improve the effectiveness and efficiency of manufacturing or service operations.[4][5][6]
History
The history of production and operation systems begins around 5000 B.C. when Sumerian priests developed the ancient system of recording inventories, loans, taxes, and business transactions. The next major historical application of operation systems occurred in 4000 B.C., when the Egyptians started using planning, organization, and control in large projects such as the construction of the pyramids. By 1100 B.C., labor was being specialized in China; by about 370 B.C., Xenophon described the advantages of dividing the various operations necessary for the production of shoes among different individuals in ancient Greece:[7][8]
"...In large cities, on the other hand, inasmuch as many people have demands to make upon each branch of industry, one trade alone, and very often even less than a whole trade, is enough to support a man: one man, for instance, makes shoes for men, and another for women; and there are places even where one man earns a living by only stitching shoes, another by cutting them out, another by sewing the uppers together, while there is another who performs none of these operations but only assembles the parts. It follows, therefore, as a matter of course, that he who devotes himself to a very highly specialized line of work is bound to do it in the best possible manner."
In the Middle Ages, kings and queens ruled over large areas of land. Loyal noblemen maintained large sections of the monarch's territory. This hierarchical organization in which people were divided into classes based on social position and wealth became known as the feudal system. In the feudal system, vassals and serfs produced for themselves and people of higher classes by using the ruler's land and resources. Although a large part of labor was employed in agriculture, artisans contributed to economic output and formed guilds. The guild system, operating mainly between 1100 and 1500, consisted of two types: merchant guilds, who bought and sold goods, and craft guilds, which made goods. Although guilds were regulated as to the quality of work performed, the resulting system was rather rigid, shoemakers, for example, were prohibited from tanning hides.[9]
Services were also performed in the Middle Ages by servants. They provided service to the nobility in the form of cooking, cleaning and providing entertainment. Court jesters were considered service providers. The medieval army could also be considered a service since they defended the nobility.[citation needed]
The Industrial Revolution was facilitated by two elements: interchangeability of parts and division of labor. Division of labor has been a feature from the beginning of civilization, the extent to which the division is carried out varied considerably depending on period and location. Compared to the Middle Ages, the Renaissance and the Age of Discovery were characterized by a greater specialization in labor, which was a characteristic of the growing cities and trade networks of Europe. An important leap in manufacturing efficiency came in the late eighteenth century as Eli Whitney popularized the concept of interchangeability of parts when he manufactured 10,000 muskets. Up to this point in the history of manufacturing, each product (e.g. each musket) was considered a special order, meaning that parts of a given musket were fitted only for that particular musket and could not be used in other muskets. Interchangeability of parts allowed the mass production of parts independent of the final products in which they would be used. An entire new market to fill the need for the sale and manufacturing of muskets began at this time.[citation needed]
In 1883, Frederick Winslow Taylor introduced the stopwatch method for accurately measuring the time to perform each single task of a complicated job. He developed the scientific study of productivity and identifying how to coordinate different tasks to eliminate wasting of time and increase the quality of work. The next generation of scientific study occurred with the development of work sampling and predetermined motion time systems (PMTS). Work sampling is used to measure the random variable associated with the time of each task. PMTS allows the use of standard predetermined tables of the smallest body movements (e.g. turning the left wrist by 90°), and integrating them to predict the time needed to perform a simple task. PMTS has gained substantial importance due to the fact that it can predict work measurements without observing the actual work. The foundation of PMTS was laid out by the research and development of Frank B. and Lillian M. Gilbreth around 1912. The Gilbreths took advantage of taking motion pictures at known time intervals while operators were performing the given task.[citation needed]
At the turn of the twentieth century, the services industries were already developed, but largely fragmented. In 1900 the U.S. service industry consisted of banks, professional services, schools, general stores, railroads and telegraph. Services were largely local in nature (except for railroads and telegraph) and owned by entrepreneurs and families. The U.S. in 1900 had 31% employment in services, 31% in manufacturing and 38% in agriculture.[10]
The idea of the production line has been used multiple times in history prior to Henry Ford: the Venetian Arsenal (1104); Smith's pin manufacturing, in the Wealth of Nations (1776) or Brunel's Portsmouth Block Mills (1802). Ransom Olds was the first to manufacture cars using the assembly line system, but Henry Ford developed the first auto assembly system where a car chassis was moved through the assembly line by a conveyor belt while workers added components to it until the car was completed. During World War II, the growth of computing power led to further development of efficient manufacturing methods and the use of advanced mathematical and statistical tools. This was supported by the development of academic programs in industrial and systems engineering disciplines, as well as fields of operations research and management science (as multi-disciplinary fields of problem solving). While systems engineering concentrated on the broad characteristics of the relationships between inputs and outputs of generic systems, operations researchers concentrated on solving specific and focused problems. The synergy of operations research and systems engineering allowed for the realization of solving large scale and complex problems in the modern era. Recently, the development of faster and smaller computers, intelligent systems, and the World Wide Web has opened new opportunities for operations, manufacturing, production, and service systems.[citation needed]
Industrial Revolution
Marshall's flax mill in Holbeck. The textile industry is the prototypical example of the English industrial revolution.
Before the First Industrial Revolution, work was mainly done through two systems: domestic system and craft guilds. In the domestic system merchants took materials to homes where artisans performed the necessary work, craft guilds on the other hand were associations of artisans which passed work from one shop to another, for example: leather was tanned by a tanner, passed to curriers, and finally arrived at shoemakers and saddlers.
Second Industrial Revolution and post-industrial society
Henry Ford was 39 years old when he founded the Ford Motor Company in 1903, with $28,000 capital from twelve investors. The model T car was introduced in 1908, however it was not until Ford implemented the assembly line concept, that his vision of making a popular car affordable by every middle-class American citizen would be realized. The first factory in which Henry Ford used the concept of the assembly line was Highland Park (1913), he characterized the system as follows:
"The thing is to keep everything in motion and take the work to the man and not the man to the work. That is the real principle of our production, and conveyors are only one of many means to an end"[11]
The post-industrial economy was noted in 1973 by Daniel Bell.[12] He stated that the future economy would provide more GDP and employment from services than from manufacturing and have a great effect on society. Since all sectors are highly interconnected, this did not reflect less importance for manufacturing, agriculture, and mining but just a shift in the type of economic activity.
Operations management
Although productivity benefited considerably from technological inventions and division of labor, the problem of systematic measurement of performances and the calculation of these by the use of formulas remained somewhat unexplored until Frederick Taylor, whose early work focused on developing what he called a "differential piece-rate system"[13] and a series of experiments, measurements and formulas dealing with cutting metals[14] and manual labor.[15] The differential piece-rate system consisted in offering two different pay rates for doing a job: a higher rate for workers with high productivity (efficiency) and who produced high quality goods (effectiveness) and a lower rate for those who fail to achieve the standard. One of the problems Taylor believed could be solved with this system was the problem of soldiering: faster workers reducing their production rate to that of the slowest worker.
The scientific education and development of the worker;
Intimate friendly cooperation between the management and the workers.
Taylor is also credited for developing stopwatch time study. This, combined with Frank and Lillian Gilbreth motion study, gave way to time and motion study, which is centered on the concepts of standard method and standard time. Frank Gilbreth is also responsible for introducing the flow process chart in 1921.[17] Other contemporaries of Taylor worth remembering are Morris Cooke (rural electrification in the 1920s and implementer of Taylor's principles of scientific management in the Philadelphia's Department of Public Works), Carl Barth (speed-and-feed-calculating slide rules) and Henry Gantt (Gantt chart). Also in 1910 Hugo Diemer published the first industrial engineering book: Factory Organization and Administration.
In 1913 Ford Whitman Harris published a paper on "How many parts to make at once", in which he presented the idea of the economic order quantity model. He described the problem as follows:
"Interest on capital tied up in wages, material and overhead sets a maximum limit to the quantity of parts which can be profitably manufactured at one time; "setup costs" on the job fix the minimum. Experience has shown one manager a way to determine the economical size of lots."[18]
"For our present purpose a phenomenon will be said to be controlled when, through the use of past experience, we can predict, at least within limits, how the phenomenon may be expected to vary in the future. Here it is understood that prediction within limits means that we can state, at least approximately, the probability that the observed phenomenon will fall within the given limits."[19]
In the 1940s methods-time measurement (MTM) was developed by H.B. Maynard, J.L. Schwab and G.J. Stegemerten. MTM was the first of a series of predetermined motion time systems, predetermined in the sense that estimates of time are not determined in loco but are derived from an industry standard. This was explained by its originators in a book they published in 1948 called Methods-Time Measurement.
The methods-time measurement may be defined as follows:
Methods-time measurement is a procedure which analyzes any manual operation or method into the basic motions required to perform it and assigns to each motion a predetermined time standard which is determined by the nature of the motion and the conditions under which it is made.
Thus it may be seen that methods-time measurement is basically a tool of method analysis that gives answers in terms of time without the necessity of making stop-watch time studies.[21]
From this point on, a curious development took place: while in the United States the possibility of applying the computer to business operations led to the development of management software architecture such as MRP and successive modifications, and ever more sophisticated optimization techniques and manufacturing simulation software, in post-war Japan a series of events at Toyota Motor led to the development of the Toyota Production System (TPS) and lean manufacturing.
In 1943, in Japan, Taiichi Ohno arrived at Toyota Motor company. Toyota evolved a unique manufacturing system centered on two complementary notions: just in time (produce only what is needed) and autonomation (automation with a human touch). Regarding JIT, Ohno was inspired by American supermarkets:[23] workstations functioned like a supermarket shelf where the customer can get products they need, at the time they need and in the amount needed, the workstation (shelf) is then restocked. Autonomation was developed by Sakichi Toyoda in Toyoda Spinning and Weaving: an automatically activated loom that was also foolproof, that is automatically detected problems. In 1983 J.N Edwards published his "MRP and Kanban-American style" in which he described JIT goals in terms of seven zeros:[24] zero defects, zero (excess) lot size, zero setups, zero breakdowns, zero handling, zero lead time and zero surging. This period also marks the spread of total quality management (TQM) in Japan, ideas initially developed by American authors such as Deming, Juran and Armand V. Feigenbaum.[25] TQM is a strategy for implementing and managing quality improvement on an organizational basis, this includes: participation, work culture, customer focus, supplier quality improvement and integration of the quality system with business goals.[20] Schnonberger identified seven fundamentals principles essential to the Japanese approach:
Process control: SPC and worker responsibility over quality
Easy able-to-see quality: boards, gauges, meters, etc. and poka-yoke
Insistence on compliance: "quality first"
Line stop: stop the line to correct quality problems
Correcting one's own errors: worker fixed a defective part if he produced it
The 100% check: automated inspection techniques and foolproof machines
Meanwhile, in the sixties, a different approach was developed by George W. Plossl and Oliver W. Wight,[27] this approach was continued by Joseph Orlicky as a response to the TOYOTA Manufacturing Program which led to material requirements planning (MRP) at IBM, latter gaining momentum in 1972 when the American Production and Inventory Control Society launched the "MRP Crusade". One of the key insights of this management system was the distinction between dependent demand and independent demand. Independent demand is demand which originates outside of the production system, therefore not directly controllable, and dependent demand is demand for components of final products, therefore subject to being directly controllable by management through the bill of materials, via product design. Orlicky wrote "Materials Requirement Planning" in 1975,[28] the first hard cover book on the subject.[27]MRP II was developed by Gene Thomas at IBM, and expanded the original MRP software to include additional production functions. Enterprise resource planning (ERP) is the modern software architecture, which addresses, besides production operations, distribution, accounting, human resources and procurement.
Dramatic changes were occurring in the service industries as well. Beginning in 1955 McDonald's provided one of the first innovations in service operations. McDonald's is founded on the idea of the production-line approach to service.[29] This requires a standard and limited menu, an assembly-line type of production process in the back-room, high customer service in the front-room with cleanliness, courtesy and fast service. While modeled after manufacturing in the production of the food in the back-room, the service in the front-room was defined and oriented to the customer. It was the McDonald's operations system of both production and service that made the difference. McDonald's also pioneered the idea of franchising this operation system to rapidly spread the business around the country and later the world.[30]
FedEx in 1971 provided the first overnight delivery of packages in the U.S. This was based on the innovative idea of flying all packages into the single airport in Memphis Tenn by midnight each day, resorting the packages for delivery to destinations and then flying them back out the next morning for delivery to numerous locations. This concept of a fast package delivery system created a whole new industry, and eventually allowed fast delivery of online orders by Amazon and other retailers.[31]
Walmart provided the first example of very low cost retailing through design of their stores and efficient management of their entire supply chain. Starting with a single store in Roger's Arkansas in 1962, Walmart has now become the world's largest company. This was accomplished by adhering to their system of delivering the goods and the service to the customers at the lowest possible cost. The operations system included careful selection of merchandise, low cost sourcing, ownership of transportation, cross-docking, efficient location of stores and friendly home-town service to the customer.[32]
In 1987 the International Organization for Standardization (ISO), recognizing the growing importance of quality, issued the ISO 9000, a family of standards related to quality management systems. There standards apply to both manufacturing and service organizations. There has been some controversy regarding the proper procedures to follow and the amount of paperwork involved, but much of that has improved in current ISO 9000 revisions.
With the coming of the Internet, in 1994 Amazon devised a service system of on-line retailing and distribution. With this innovative system customers were able to search for products they might like to buy, enter the order for the product, pay online, and track delivery of the product to their location, all in two days. This required not only very large computer operations, but dispersed warehouses, and an efficient transportation system. Service to customers including a high merchandise assortment, return services of purchases, and fast delivery is at the forefront of this business.[33] It is the customer being in the system during the production and delivery of the service that distinguishes all services from manufacturing.
Recent trends in the field revolve around concepts such as:
Business process re-engineering (launched by Michael Hammer in 1993[34]): a business management strategy focusing on the analysis and design of workflows and business processes within an organization. BPR seeks to help companies radically restructure their organizations by focusing on the ground-up design of their business processes.
Lean systems is a systemic method for the elimination of waste ("Muda") within a manufacturing or service process. Lean also takes into account waste created through overburden ("Muri") and waste created through unevenness in work loads ("Mura"). The term lean manufacturing was coined in the book The Machine that Changed the World.[35] Subsequently, lean services has been widely applied.
Six Sigma (an approach to quality developed at Motorola between 1985 and 1987): Six Sigma refers to control limits placed at six standard deviations from the mean of a normal distribution, this became very famous after Jack Welch of General Electric launched a company-wide initiative in 1995 to adopt this set of methods to all manufacturing, service and administrative processes. More recently, Six Sigma has included DMAIC (for improving processes) and DFSS (for designing new products and new processes)
Reconfigurable manufacturing system: a production system designed at the outset for rapid change in its structure, as well as its hardware and software components, in order to quickly adjust its production capacity and functionality within a part family in response to sudden market changes or intrinsic system change.
Project production management: the application of the analytical tools and techniques developed for operations management, as described in Factory Physics to the activities within major capital projects such as encountered in oil and gas and civil infrastructure delivery.
Topics
Production systems
In a job shop machines are grouped by technological similarities regarding transformation processes, therefore a single shop can work very different products (in this picture four colors). Also notice that in this drawing each shop contains a single machine.Flexible Manufacturing System: in the middle there are two rails for the shuttle to move pallets between machining centers (there are also FMS which use AGVs), in front of each machining center there is a buffer and in left we have a shelf for storing pallets. Usually in the back there is a similar system for managing the set of tools required for different machining operations.
A production system comprises both technological elements (machines and tools) and organizational behavior (division of labor and information flow) needed to produce goods and services.[36] An individual production system is usually analyzed in the literature referring to a single business; therefore it is usually improper to include in a given production system the operations necessary to process goods that are obtained by purchasing or the operations carried by the customer on the sold products, the reason being simply that since businesses need to design their own production systems this then becomes the focus of analysis, modeling and decision making (also called "configuring" a production system).[clarification needed]
Classification
A first possible distinction in production systems (technological classification) is between continuous process production and discrete part production (manufacturing).
Process production means that the product undergoes physical-chemical transformations and lacks assembly operations, and therefore the original raw materials cannot easily be obtained from the final product. Examples include: paper, cement, nylon and petroleum products.
Delivery lead time is the blue bar, manufacturing time is the whole bar, the green bar is the difference between the two.
Another possible classification[39] is one based on lead time (manufacturing lead time vs delivery lead time): engineer to order (ETO), purchase to order (PTO), make to order (MTO), assemble to order (ATO) and make to stock (MTS). According to this classification different kinds of systems will have different customer order decoupling points (CODP), meaning that work in progress (WIP) cycle stock levels are practically nonexistent regarding operations located after the CODP (except for WIP due to queues). (See Order fulfillment.)
The concept of production systems can be expanded to the service sector world keeping in mind that services have some fundamental differences in respect to material goods: intangibility, client always present during transformation processes, no stocks for "finished goods". Services can be classified according to a service process matrix:[40] degree of labor intensity (volume) vs degree of customization (variety). With a high degree of labor intensity there are mass services (e.g., commercial banking bill payments and state schools) and professional services (e.g., personal physicians and lawyers), while with a low degree of labor intensity there are service factories (e.g., airlines and hotels) and service shops (e.g., hospitals and auto mechanics).
The systems described above are ideal types: real systems may present themselves as hybrids of those categories. Consider, for example, that the production of jeans involves initially carding, spinning, dyeing and weaving, then cutting the fabric in different shapes and assembling the parts in pants or jackets by combining the fabric with thread, zippers and buttons, finally finishing and distressing the pants/jackets before being shipped to stores.[41] The beginning can be seen as process production, the middle as part production and the end again as process production: it is unlikely that a single company will keep all the stages of production under a single roof, therefore the problem of vertical integration and outsourcing arises. Most products require, from a supply chain perspective, both process production and part production.
Operations systems
If a production system is concerned with the production of goods and services, an operations system is concerned with provisioning them.[36] Not all management models distinguish between production and operations systems.[citation needed] When the two are distinguished, operations systems account for many of the tertiary factors that are abstracted away from in production system frameworks. In particular, there is an emphasis on service-based factors.
Classification
Operational systems generally fall into two main categories: service-based and manufacturing-based.
Service industries are a major part of economic activity and employment in all industrialized countries comprising 80 percent of employment and GDP in the U.S. Operations management of these services, as distinct from manufacturing, has been developing since the 1970s through publication of unique practices and academic research.[42] Please note that this section does not particularly include "Professional Services Firms" and the professional services practiced from this expertise (specialized training and education within).
According to Fitzsimmons, Fitzsimmons and Bordoloi (2014) differences between manufactured goods and services are as follows:[43]
Simultaneous production and consumption. High contact services (e.g. health care) must be produced in the presence of the customer, since they are consumed as produced. As a result, services cannot be produced in one location and transported to another, like goods. Service operations are therefore highly dispersed geographically close to the customers. Furthermore, simultaneous production and consumption allows the possibility of self-service involving the customer at the point of consumption (e.g. gas stations). Only low-contact services produced in the "backroom" (e.g., check clearing) can be provided away from the customer.
Perishable. Since services are perishable, they cannot be stored for later use. In manufacturing companies, inventory can be used to buffer supply and demand. Since buffering is not possible in services, highly variable demand must be met by operations or demand modified to meet supply.
Ownership. In manufacturing, ownership is transferred to the customer. Ownership is not transferred for service. As a result, services cannot be owned or resold.
Tangibility. A service is intangible making it difficult for a customer to evaluate the service in advance. In the case of a manufactured good, customers can see it and evaluate it. Assurance of quality service is often done by licensing, government regulation, and branding to assure customers they will receive a quality service.
These four comparisons indicate how management of service operations are quite different from manufacturing regarding such issues as capacity requirements (highly variable), quality assurance (hard to quantify), location of facilities (dispersed), and interaction with the customer during delivery of the service (product and process design).
While there are differences there are also many similarities. For example, quality management approaches used in manufacturing such as the Baldrige Award, and Six Sigma have been widely applied to services. Likewise, lean service principles and practices have also been applied in service operations. The important difference being the customer is in the system while the service is being provided and needs to be considered when applying these practices.[44]
One important difference is service recovery. When an error occurs in service delivery, the recovery must be delivered on the spot by the service provider. If a waiter in a restaurant spills soup on the customer's lap, then the recovery could include a free meal and a promise of free dry cleaning. Another difference is in planning capacity. Since the product cannot be stored, the service facility must be managed to peak demand which requires more flexibility than manufacturing. Location of facilities must be near the customers and scale economics can be lacking. Scheduling must consider the customer can be waiting in line. Queuing theory has been devised to assist in design of service facilities waiting lines. Revenue management is important for service operations, since empty seats on an airplane are lost revenue when the plane departs and cannot be stored for future use.[45]
Metrics: efficiency and effectiveness
Operations strategy concerns policies and plans of use of the firm productive resources with the aim of supporting long term competitive strategy. Metrics in operations management can be broadly classified into efficiency metrics and effectiveness metrics. Effectiveness metrics involve:
Price (actually fixed by marketing, but lower bounded by production cost): purchase price, use costs, maintenance costs, upgrade costs, disposal costs
Flexibility: mix (capacity to change the proportions between quantities produced in the system), volume (capacity to increase system output), gamma (capacity to expand the product family in the system)
Ecological Soundness: biological and environmental impacts of the system under study.
A more recent approach, introduced by Terry Hill,[46] involves distinguishing competitive variables in order winner and order qualifiers when defining operations strategy. Order winners are variables which permit differentiating the company from competitors, while order qualifiers are prerequisites for engaging in a transaction. This view can be seen as a unifying approach between operations management and marketing (see segmentation and positioning).
Productivity is a standard efficiency metric for evaluation of production systems, broadly speaking a ratio between outputs and inputs, and can assume many specific forms,[47] for example: machine productivity, workforce productivity, raw material productivity, warehouse productivity (=inventory turnover). It is also useful to break up productivity in use U (productive percentage of total time) and yield η (ratio between produced volume and productive time) to better evaluate production systems performances. Cycle times can be modeled through manufacturing engineering if the individual operations are heavily automated, if the manual component is the prevalent one, methods used include: time and motion study, predetermined motion time systems and work sampling.
An ABC cumulated curve. Typically one curve is constructed for revenue (consumption) and another for inventory (stock).
ABC analysis is a method for analyzing inventory based on Pareto distribution, it posits that since revenue from items on inventory will be power law distributed then it makes sense to manage items differently based on their position on a revenue-inventory level matrix, 3 classes are constructed (A, B and C) from cumulative item revenues, so in a matrix each item will have a letter (A, B or C) assigned for revenue and inventory. This method posits that items away from the diagonal should be managed differently: items in the upper part are subject to risk of obsolescence, items in the lower part are subject to risk of stockout.
Throughput is a variable which quantifies the number of parts produced in the unit of time. Although estimating throughput for a single process maybe fairly simple, doing so for an entire production system involves an additional difficulty due to the presence of queues which can come from: machine breakdowns, processing time variability, scraps, setups, maintenance time, lack of orders, lack of materials, strikes, bad coordination between resources, mix variability, plus all these inefficiencies tend to compound depending on the nature of the production system. One important example of how system throughput is tied to system design are bottlenecks: in job shops bottlenecks are typically dynamic and dependent on scheduling while on transfer lines it makes sense to speak of "the bottleneck" since it can be univocally associated with a specific station on the line. This leads to the problem of how to define capacity measures, that is an estimation of the maximum output of a given production system, and capacity utilization.
Overall equipment effectiveness (OEE) is defined as the product between system availability, cycle time efficiency and quality rate. OEE is typically used as key performance indicator (KPI) in conjunction with the lean manufacturing approach.
Configuration and management
Designing the configuration of production systems involves both technological and organizational variables. Choices in production technology involve: dimensioning capacity, fractioning capacity, capacity location, outsourcing processes, process technology, automation of operations, trade-off between volume and variety (see Hayes-Wheelwright matrix). Choices in the organizational area involve: defining worker skills and responsibilities, team coordination, worker incentives and information flow.
In production planning, there is a basic distinction between the push approach and the pull approach, with the later including the singular approach of just in time. Pull means that the production system authorizes production based on inventory level; push means that production occurs based on demand (forecasted or present, that is purchase orders). An individual production system can be both push and pull; for example activities before the CODP may work under a pull system, while activities after the CODP may work under a push system.
Classic EOQ model: trade-off between ordering cost (blue) and holding cost (red). Total cost (green) admits a global optimum.
The traditional pull approach to inventory control, a number of techniques have been developed based on the work of Ford W. Harris[18] (1913), which came to be known as the economic order quantity (EOQ) model. This model marks the beginning of inventory theory, which includes the Wagner-Within procedure, the newsvendor model, base stock model and the fixed time period model. These models usually involve the calculation of cycle stocks and buffer stocks, the latter usually modeled as a function of demand variability. The economic production quantity[48] (EPQ) differs from the EOQ model only in that it assumes a constant fill rate for the part being produced, instead of the instantaneous refilling of the EOQ model.
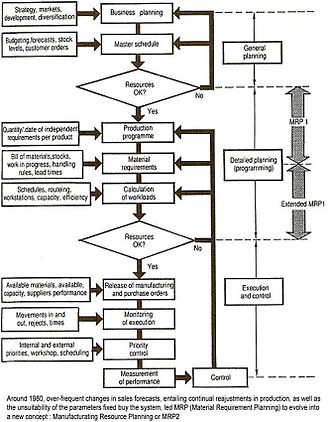
A typical MRPII construct: general planning (top) concerned with forecasts, capacity planning and inventory levels, programming (middle) concerned with calculation of workloads, rough-cut capacity planning, MPS, capacity requirements planning, traditional MRP planning, control (bottom) concerned with scheduling.
Joseph Orlickly and others at IBM developed a push approach to inventory control and production planning, now known as material requirements planning (MRP), which takes as input both the master production schedule (MPS) and the bill of materials (BOM) and gives as output a schedule for the materials (components) needed in the production process. MRP therefore is a planning tool to manage purchase orders and production orders (also called jobs).
The MPS can be seen as a kind of aggregate planning for production coming in two fundamentally opposing varieties: plans which try to chase demand and level plans which try to keep uniform capacity utilization. Many models have been proposed to solve MPS problems:
Analytical models (e.g. Magee Boodman model)
Exact optimization algorithmic models (e.g. LP and ILP)
MRP can be briefly described as a 3s procedure: sum (different orders), split (in lots), shift (in time according to item lead time). To avoid an "explosion" of data processing in MRP (number of BOMs required in input) planning bills (such as family bills or super bills) can be useful since they allow a rationalization of input data into common codes. MRP had some notorious problems such as infinite capacity and fixed lead times, which influenced successive modifications of the original software architecture in the form of MRP II, enterprise resource planning (ERP) and advanced planning and scheduling (APS).
Lean manufacturing is an approach to production which arose in Toyota between the end of World War II and the seventies. It comes mainly from the ideas of Taiichi Ohno and Sakichi Toyoda which are centered on the complementary notions of just in time and autonomation (jidoka), all aimed at reducing waste (usually applied in PDCA style). Some additional elements are also fundamental:[49] production smoothing (Heijunka), capacity buffers, setup reduction, cross-training and plant layout.
Heijunka: production smoothing presupposes a level strategy for the MPS and a final assembly schedule developed from the MPS by smoothing aggregate production requirements in smaller time buckets and sequencing final assembly to achieve repetitive manufacturing. If these conditions are met, expectedthroughput can be equaled to the inverse of takt time. Besides volume, heijunka also means attaining mixed-model production, which however may only be feasible through set-up reduction. A standard tool for achieving this is the Heijunka box.
Capacity buffers: ideally a JIT system would work with zero breakdowns, this however is very hard to achieve in practice, nonetheless Toyota favors acquiring extra capacity over extra WIP to deal with starvation.
Set-up reduction: typically necessary to achieve mixed-model production, a key distinction can be made between internal and external setup. Internal setups (e.g. removing a die) refers to tasks when the machine is not working, while external setups can be completed while the machine is running (ex:transporting dies).
Cross training: important as an element of Autonomation, Toyota cross trained their employees through rotation, this served as an element of production flexibility, holistic thinking and reducing boredom.
Layout: U-shaped lines or cells are common in the lean approach since they allow for minimum walking, greater worker efficiency and flexible capacity.
When introducing kanbans in real production systems, attaining unitary lot from the start maybe unfeasible, therefore the kanban will represent a given lot size defined by management.
A series of tools have been developed mainly with the objective of replicating Toyota success: a very common implementation involves small cards known as kanbans; these also come in some varieties: reorder kanbans, alarm kanbans, triangular kanbans, etc. In the classic kanban procedure with one card:
Parts are kept in containers with their respective kanbans
The downstream station moves the kanban to the upstream station and starts producing the part at the downstream station
The upstream operator takes the most urgent kanban from his list (compare to queue discipline from queue theory) and produces it and attach its respective kanban
The two-card kanban procedure differs a bit:
The downstream operator takes the production kanban from his list
If required parts are available he removes the move kanban and places them in another box, otherwise he chooses another production card
He produces the part and attach its respective production kanban
Periodically a mover picks up the move kanbans in upstream stations and search for the respective parts, when found he exchanges production kanbans for move kanbans and move the parts to downstream stations
Since the number of kanbans in the production system is set by managers as a constant number, the kanban procedure works as WIP controlling device, which for a given arrival rate, per Little's law, works as a lead time controlling device.
Value stream mapping, a representation of materials and information flows inside a company, mainly used in the lean manufacturing approach. The calculation of the time-line (bottom) usually involves using Little's law to derive lead time from stock levels and takt time.
In Toyota the TPS represented more of a philosophy of production than a set of specific lean tools, the latter would include:
single-point scheduling, the opposite of the traditional push approach
multi-process handling: when one operator is responsible for operating several machines or processes
poka-yoke: any mechanism in lean manufacturing that helps an equipment operator avoid (yokeru) mistakes (poka)
5S: describes how to organize a work space for efficiency and effectiveness by identifying and storing the items used, maintaining the area and items, and sustaining the new order
backflush accounting: a product costing approach in which costing is delayed until goods are finished
In heavily automated production systems production planning and information gathering may be executed via the control system, attention should be paid however to avoid problems such as deadlocks, as these can lead to productivity losses.
Project production management (PPM) applies the concepts of operations management to the execution of delivery of capital projects by viewing the sequence of activities in a project as a production system.[50][51] Operations managements principles of variability reduction and management are applied by buffering through a combination of capacity, time and inventory.
Optimization modeling
Queue networks are systems in which single queues are connected by a routing network. In this image servers are represented by circles, queues by a series of rectangles and the routing network by arrows. In the study of queue networks one typically tries to obtain the equilibrium distribution of the network.Illustration of the Simplex method, a classical approach to solving LP optimization problems and also integer programming (ex: branch and cut). This technique is mainly used in push approach but also in production system configuration. The interior and surface of the green polytope geometrically represent the feasible region, while the red line indicates the optimally chosen sequence of pivot operations used to reach the optimal solution.
When analytical models are not enough, managers may resort to using simulation. Simulation has been traditionally done through the discrete event simulation paradigm, where the simulation model possesses a state which can only change when a discrete event happens, which consists of a clock and list of events. The more recent transaction-level modeling paradigm consists of a set of resources and a set of transactions: transactions move through a network of resources (nodes) according to a code, called a process.
A control chart: process output variable is modeled by a probability density function and for each statistic of the sample an upper control line and lower control line are fixed. When the statistic moves out of bounds, an alarm is given and possible causes are investigated. In this drawing the statistic of choice is the mean and red points represent alarm points.
Since real production processes are always affected by disturbances in both inputs and outputs, many companies implement some form of quality management or quality control. The Seven Basic Tools of Quality designation provides a summary of commonly used tools:
These are used in approaches like total quality management and Six Sigma. Keeping quality under control is relevant to both increasing customer satisfaction and reducing processing waste.
Operations management textbooks usually cover demand forecasting, even though it is not strictly speaking an operations problem, because demand is related to some production systems variables. For example, a classic approach in dimensioning safety stocks requires calculating the standard deviation of forecast errors. Demand forecasting is also a critical part of push systems, since order releases have to be planned ahead of actual clients’ orders. Also, any serious discussion of capacity planning involves adjusting company outputs with market demands.
1 2 R. B. Chase, F.R. Jacobs, N. Aquilano, Operations Management: For Competitive Advantage, McGraw-Hill 2007
↑ Krajewski, L.J.; Ritzman, L. P.; Malhorta, M.J. (2013). Operations Management: Processes and Supply Chains (10thed.). Pearson. ISBN978-0-13-280739-5.
↑ Reid, R. Dan; Nada R. Sanders (2019). Operations management: an integrated approach (Seventhed.). Hoboken, NJ: Wiley. ISBN978-1-119-49733-2. OCLC1119125081.
↑ Hanna, Mark; W. Rocky Newman (2007). Integrated operations management: a supply chain perspective (2nded.). Ohio, OH: Thomson/South-Western. ISBN978-0-324-37787-3. OCLC73996956.
↑ Friedrick Klemm, A history of Western Technology, Charles Scribner's Sons 1959 in D. A. Wren and A. G. Bedeian, The Evolution of Management Thought, Wiley 2009
↑ Taylor, Frederick Winslow (1911), The Principles of Scientific Management. New York, NY, US and London, UK: Harper & Brothers. LCCN 11010339. OCLC 233134. Also available from Project Gutenberg.
↑ Frank Bunker Gilbreth, Lillian Moller Gilbreth (1921) Process Charts. American Society of Mechanical Engineers.
1 2 Shewhart, Walter Andrew, Economic control of quality of manufactured product, 1931, New York: D. Van Nostrand Company. pp. 501 ISBN0-87389-076-0 (edition 1st). LCCN 132090. OCLC 1045408. LCC TS155 .S47.
1 2 D.C. Montgomery, Statistical Quality Control: A Modern Introduction, 7th edition 2012
1 2 A. Portioli, A.Pozzetti, Progettazione dei sistemi produttivi, Hoepli 2003
↑ Note: this classification is very old but it has been subject to update as production systems have evolved over the 20th century, for a complete picture consult recent texts
↑ J.C. Wortmann, Chapter: "A classification scheme for master production schedule", in Efficiency of Manufacturing Systems, C. Berg, D. French and B. Wilson (eds) New York, Plenum Press 1983
↑ Fitzsimmons, J.; Fitzsimmons, M.; Bordoloi, S. (2014). Service Management: Operations, Strategy and Technology. New York: McGraw-Hill. ISBN978-0-07-802407-8.
↑ Heizer, Jay; Render, Barry (2011). Operations Management (10thed.). Upper Saddle River, N.J.: Prentice-Hall. ISBN978-0-13-611941-8.
↑ Johnston, Robert; Clark, Graham; Shulver, Michael (2012). Service Operations:Management: Improving Service Service Delivery (Fourthed.). London, England: Pearson. ISBN978-0-273-74048-3.
↑ T. Hill, Manufacturing Strategy-Text and Cases, 3rd ed. Mc-Graw Hill 2000
↑ Grando A., Organizzazione e Gestione della Produzione Industriale, Egea 1993
↑ Taft, E. W. "The most economical production lot." Iron Age 101.18 (1918): 1410–1412.
↑ W. Hopp, M. Spearman, Factory Physics, 3rd ed. Waveland Press, 2011
↑ "Factory Physics for Managers", E. S. Pound, J. H. Bell, and M. L. Spearman, McGraw-Hill, 2014, p 47
↑ Burnetas A.N. and M. N.Katehakis (1993).. "On Sequencing Two Types of Tasks on a Single Processor under Incomplete Information", Probability in the Engineering and Informational Sciences, 7 (1), 85–0119.
↑ Zipkin Paul H., Foundations of Inventory Management, Boston: McGraw Hill, 2000, ISBN0-256-11379-3
↑ Katehakis M.N. and C. Derman (1989). "On the maintenance of systems composed of highly reliable components", Management Science, 6 (5): 16–28.
Daniel Wren, The Evolution of Management Thought, 3rd edition, New York Wiley 1987.
W. Hopp, M. Spearman, Factory Physics, 3rd ed. Waveland Press, 2011 online (Part 1 contains both description and critical evaluation of the historical development of the field).
R. B. Chase, F. R. Jacobs, N. J.Aquilano, Operations Management for Competitive Advantage, 11th edition, McGraw-Hill, 2007.
Askin, R. G., C.R. Standridge, Modeling & Analysis Of Manufacturing Systems, John Wiley and Sons, New York 1993.
J. A. Buzacott, J. G. Shanthikumar, Stochastic models of manufacturing systems, Prentice Hall, 1993.
D. C. Montgomery, Statistical Quality Control: A Modern Introduction, 7th edition, 2012.
R. G. Poluha: The Quintessence of Supply Chain Management: What You Really Need to Know to Manage Your Processes in Procurement, Manufacturing, Warehousing and Logistics (Quintessence Series). First Edition. Springer Heidelberg New York Dordrecht London 2016. ISBN978-3662485132.
This page is based on this Wikipedia article Text is available under the CC BY-SA 4.0 license; additional terms may apply. Images, videos and audio are available under their respective licenses.


