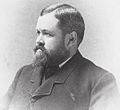
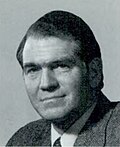
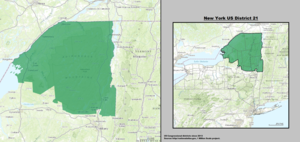
Member Party Years Cong Electoral history Counties represented Vacant March 4, 1821 – 17th Elections were held in April 1821 . It is unclear when results were announced or credentials issued. 1821–1823 Chenango and Broome counties. Elijah Spencer (Benton ) Democratic-Republican December 3, 1821 – Elected in 1821 .[ data missing ] Lot Clark (Norwich ) Democratic-Republican March 4, 1823 – 18th Elected in 1822 .[ data missing ] 1823–1833 Elias Whitmore (Windsor ) Anti-Jacksonian March 4, 1825 – 19th Elected in 1824 .[ data missing ] John C. Clark (Bainbridge ) Jacksonian March 4, 1827 – 20th Elected in 1826 .[ data missing ] Robert Monell (Greene ) Jacksonian March 4, 1829 – 21st Elected in 1828 .[ data missing ] Sixth State Circuit Court Vacant February 22, 1831 – John A. Collier (Binghamton ) Anti-Masonic March 4, 1831 – 22nd Elected in 1830 .[ data missing ] Henry Mitchell (Norwich ) Jacksonian March 4, 1833 – 23rd Elected in 1832 .[ data missing ] 1833–1843 [ data missing ] William Mason (Preston ) Jacksonian March 4, 1835 – 24th Elected in 1834 .[ data missing ] John C. Clark (Bainbridge ) Democratic March 4, 1837 – 25th 26th 27th Elected in 1836 .Re-elected in 1838 .Re-elected in 1840 .[ data missing ] Whig March 4, 1839 – Jeremiah E. Cary (Cherry Valley ) Democratic March 4, 1843 – 28th Elected in 1842 .[ data missing ] 1843–1853 [ data missing ] Charles Goodyear (Schoharie ) Democratic March 4, 1845 – 29th Elected in 1844 .[ data missing ] George A. Starkweather (Cooperstown ) Democratic March 4, 1847 – 30th Elected in 1846 .[ data missing ] Hiram Walden (Waldensville ) Democratic March 4, 1849 – 31st Elected in 1848 .[ data missing ] William W. Snow (Oneonta ) Democratic March 4, 1851 – 32nd Elected in 1850 .[ data missing ] Henry Bennett (New Berlin ) Whig March 4, 1853 – 33rd 34th 35th Redistricted from the 22nd district and re-elected in 1852 .Re-elected in 1854 .Re-elected in 1856 . 1853–1863 [ data missing ] Opposition March 4, 1855 – Republican March 4, 1857 – R. Holland Duell (Cortland ) Republican March 4, 1859 – 36th 37th Elected in 1858 .Re-elected in 1860 .[ data missing ] Francis Kernan (Utica ) Democratic March 4, 1863 – 38th Elected in 1862 .[ data missing ] 1863–1873 [ data missing ] Roscoe Conkling (Utica ) Republican March 4, 1865 – 39th Elected in 1864 .[ data missing ] Re-elected in 1866 but declined when instead elected U.S. senator . Vacant March 4, 1867 – 40th Alexander H. Bailey (Rome ) Republican November 30, 1867 – 40th 41st Elected to finish the vacant term .Re-elected in 1868 .[ data missing ] Ellis H. Roberts (Utica ) Republican March 4, 1871 – 42nd Elected in 1870 . 22nd district . Clinton L. Merriam (Locust Grove ) Republican March 4, 1873 – 43rd Redistricted from the 20th district and re-elected in 1872 .[ data missing ] 1873–1883 [ data missing ] Samuel F. Miller (Franklin ) Republican March 4, 1875 – 44th Elected in 1874 .[ data missing ] Solomon Bundy (Oxford ) Republican March 4, 1877 – 45th Elected in 1876 .[ data missing ] David Wilber (Milford ) Republican March 4, 1879 – 46th Elected in 1878 .[ data missing ] Ferris Jacobs Jr. (Delhi ) Republican March 4, 1881 – 47th Elected in 1880 .[ data missing ] George W. Ray (Chenango ) Republican March 4, 1883 – 48th Elected in 1882 .[ data missing ] 1883–1893 [ data missing ] Frederick A. Johnson (Glens Falls ) Republican March 4, 1885 – 49th Redistricted from the 18th district and re-elected in 1884 .[ data missing ] John H. Moffitt (Chateaugay Lake ) Republican March 4, 1887 – 50th 51st Elected in 1886 .Re-elected in 1888 .[ data missing ] John M. Wever (Plattsburg ) Republican March 4, 1891 – 52nd Elected in 1890 .[ data missing ] 23rd district . Simon J. Schermerhorn (Schenectady ) Democratic March 4, 1893 – 53rd Elected in 1892 .[ data missing ] 1893–1899 [ data missing ] David F. Wilber (Oneonta ) Republican March 4, 1895 – 54th 55th Elected in 1894 .Re-elected in 1896 .[ data missing ] John K. Stewart (Amsterdam ) Republican March 4, 1899 – 56th 57th Elected in 1898 .Re-elected in 1900 .[ data missing ] 1899–1903 Columbia , Dutchess , Greene and Putnam counties John H. Ketcham (Dover Plains ) Republican March 4, 1903 – 58th 59th Redistricted from the 18th district and re-elected in 1902 .Re-elected in 1904 . 1903–1913 [ data missing ] Vacant November 5, 1906 – 59th Samuel McMillan (Lake Mahopac ) Republican March 4, 1907 – 60th Elected in 1906 .[ data missing ] Hamilton Fish II (Garrison ) Republican March 4, 1909 – 61st Elected in 1908 .[ data missing ] Richard E. Connell (Poughkeepsie ) Democratic March 4, 1911 – 62nd Elected in 1910 . Vacant October 31, 1912 – Henry George Jr. (New York ) Democratic March 4, 1913 – 63rd Redistricted from the 17th district and re-elected in 1912 .[ data missing ] 1913–1963 New York G. Murray Hulbert (New York ) Democratic March 4, 1915 – 64th 65th Elected in 1914 .Re-elected in 1916 .Re-elected in 1918 .Port of New York City Vacant January 2, 1918 – 65th Jerome F. Donovan (New York ) Democratic March 5, 1918 – 65th 66th Elected to finish Hulbert's term .[ data missing ] Martin C. Ansorge (New York ) Republican March 4, 1921 – 67th Elected in 1920 .[ data missing ] Royal H. Weller (New York ) Democratic March 4, 1923 – 68th 69th 70th Elected in 1922 .Re-elected in 1924 .Re-elected in 1926 .Re-elected in 1928 . Vacant March 2, 1929 – 70th 71st Joseph A. Gavagan (New York ) Democratic November 5, 1929 – 71st 72nd 73rd 74th 75th 76th 77th 78th Elected to finish Weller's term .Re-elected in 1930 .Re-elected in 1932 .Re-elected in 1934 .Re-elected in 1936 .Re-elected in 1938 .Re-elected in 1940 .Re-elected in 1942 .New York Supreme Court . Vacant December 31, 1943 – 78th James H. Torrens (New York ) Democratic February 29, 1944 – 78th 79th Elected to finish Gavagan's term .Re-elected in 1944 .[ data missing ] Jacob K. Javits (New York ) Republican January 3, 1947 – 80th 81st 82nd 83rd Elected in 1946 .Re-elected in 1948 .Re-elected in 1950 .Re-elected in 1952 .run for N.Y. Attorney General .New York State Attorney General . Vacant December 31, 1954 – 83rd Herbert Zelenko (New York ) Democratic January 3, 1955 – 84th 85th 86th 87th Elected in 1954 .Re-elected in 1956 .Re-elected in 1958 .Re-elected in 1960 .[ data missing ] James C. Healey (New York ) Democratic January 3, 1963 – 88th Redistricted from the 22nd district and re-elected in 1962 .[ data missing ] 1963–1965 Bronx James H. Scheuer (New York ) Democratic January 3, 1965 – 89th 90th 91st 92nd Elected in 1964 .Re-elected in 1966 .Re-elected in 1968 .Re-elected in 1970 .[ data missing ] 1965–1973 Bronx , Manhattan , Queens January 3, 1971 – Herman Badillo (The Bronx ) Democratic January 3, 1973 – 93rd 94th 95th Redistricted from the 22nd district and re-elected in 1972 .Re-elected in 1974 .Re-elected in 1976 .Deputy Mayor of New York City . 1973–1983 Bronx Vacant January 1, 1978 – 95th Robert Garcia (The Bronx ) Democratic February 21, 1978 – 95th 96th 97th Elected to finish Badillo's term .Re-elected in 1978 .Re-elected in 1980 . 18th district . Hamilton Fish IV (Millbrook ) Republican January 3, 1983 – 98th 99th 100th 101st 102nd Redistricted from the 25th district and re-elected in 1982 .Re-elected in 1984 .Re-elected in 1986 .Re-elected in 1988 .Re-elected in 1990 . 19th district . 1983–1993 Putnam ; parts of Dutchess , Orange , Westchester Michael McNulty (Green Island ) Democratic January 3, 1993 – 103rd 104th 105th 106th 107th 108th 109th 110th Redistricted from the 23rd district and re-elected in 1992 .Re-elected in 1994 .Re-elected in 1996 .Re-elected in 1998 .Re-elected in 2000 .Re-elected in 2002 .Re-elected in 2004 .Re-elected in 2006 . 1993–2003 Albany , Schenectady ; parts of Montgomery , Rensselaer , Saratoga 2003–2013 Albany , Montgomery , Schenectady , Schoharie ; parts of Fulton , Rensselaer , Saratoga Paul Tonko (Amsterdam ) Democratic January 3, 2009 – 111th 112th Elected in 2008 .Re-elected in 2010 . 20th district . Bill Owens (Plattsburgh ) Democratic January 3, 2013 – 113th Redistricted from the 23rd district and re-elected in 2012 . 2013–2023 Clinton , Essex , Franklin , Fulton , Hamilton , Jefferson , Lewis , St. Lawrence , Warren , Washington ; parts of Herkimer , Saratoga Elise Stefanik (Schuylerville ) Republican January 3, 2015 – 114th 115th 116th 117th 118th 119th Elected in 2014 .Re-elected in 2016 .Re-elected in 2018 .Re-elected in 2020 .Re-elected in 2022 .Re-elected in 2024 . 2023–2025 Clinton , Essex , Franklin , Fulton , Hamilton , Herkimer , Lewis , Montgomery , Schoharie , St. Lawrence , Warren , Washington ; parts of Jefferson , Otsego , Rensselaer
2025–present Clinton , Essex , Franklin , Fulton , Hamilton , Herkimer , Lewis , Schoharie , St. Lawrence , Warren , Washington ; parts of Jefferson , Montgomery , Oneida , Saratoga 


