

The United States Centers for Disease Control and Prevention (CDC) provides data on drug overdose death rates and totals in the United States.
Contents
- 1968–2022
- Death rates by state and year
- Death counts by state over time
- Timeline by drug
- Opioid charts
- Death rates by race and ethnicity
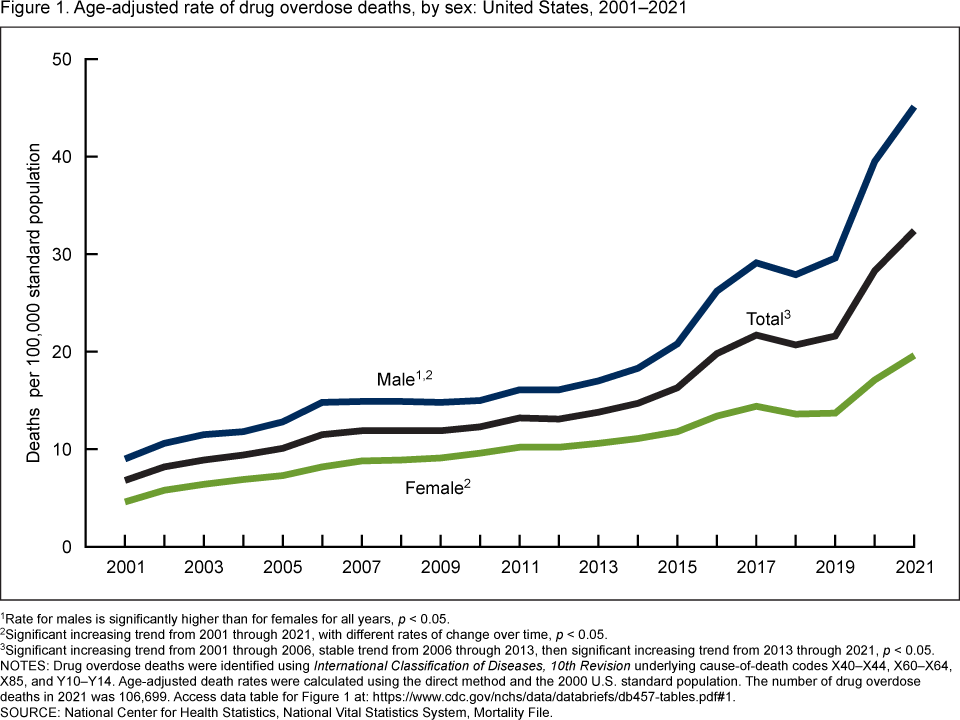
- Rate timeline by sex
- Comparisons to other countries
- Comparisons to other countries in Europe
- Rates per 100,000 adults
- Counts
- See also
- References
- Further reading
Around 76,500 people died in the 12-month period ending April 30, 2025, at a rate of 210 deaths per day. That is 22.4 deaths per 100,000 US residents, using the population at the midpoint of that period (340,843,530 on November 1, 2024). [4] [5] [6]
The peak was around 110,900 in 2022. The U.S. drug overdose death rate has gone from 2.5 per 100,000 people in 1968 to the peak rate of 33.2 per 100,000 in 2022. [7] [6]
From 1968 to 2020, approximately 1,106,900 U.S. residents died from drug overdoses, with the majority –around 932,400 –of those deaths occurring between 1999 and 2020.
| Year | Deaths | Population | Crude rate |
|---|---|---|---|
| 2024 | 81,700 | 340,110,000 | 24.0 |
| 2023 | 108,600 | 336,810,000 | 32.2 |
| 2022 | 110,900 | 334,020,000 | 33.2 |
| 2021 | 109,100 | 332,100,000 | 32.9 |
| 2020 | 93,500 | 331,580,000 | 28.2 |
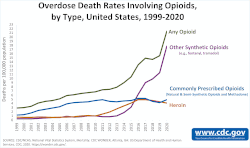
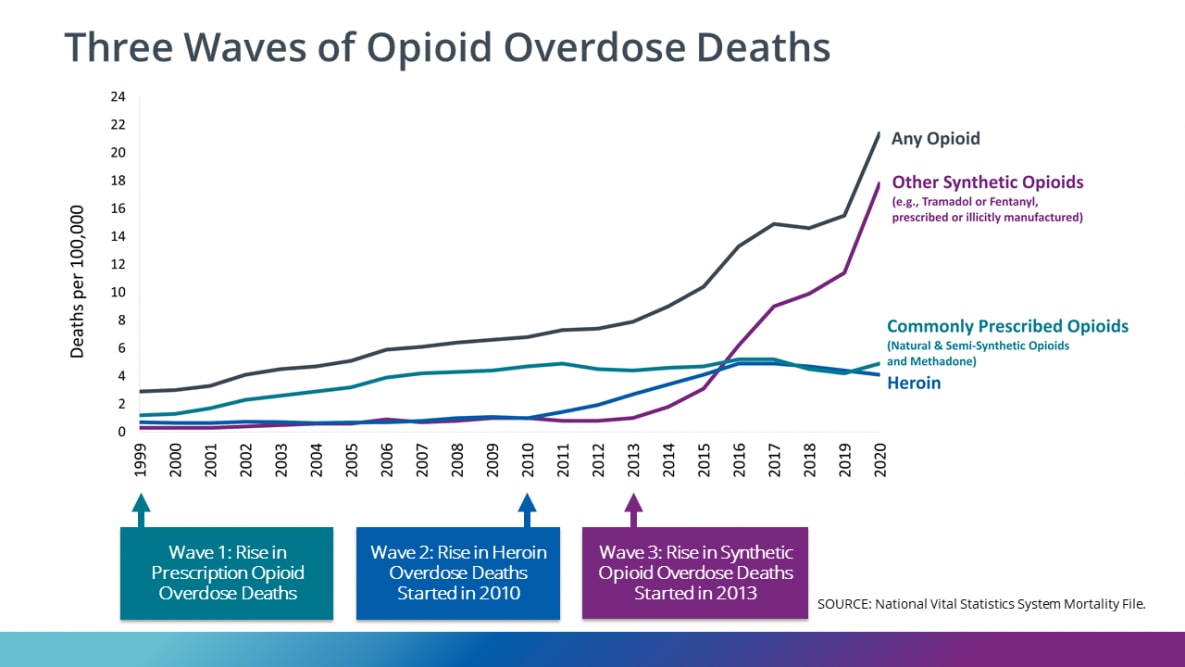
Of the roughly 110,700 drug overdose deaths in 2021 (the total at the time that these numbers were calculated), opioids were involved in about 80,400, or nearly 73%, of cases, with synthetic opioids other than methadone (primarily fentanyl) involved in around 70,600, or nearly 64%, of all deaths. [6] [4] [7] [1] [2]
The CDC's "predicted value" is used for numbers for recent years in the above intro. CDC: "Predicted provisional counts represent estimates of the number of deaths adjusted for incomplete reporting (see Technical Notes)." And the above yearly numbers are updated regularly here as they change. [6] [4]


