This article is being considered for deletion in accordance with Wikipedia's deletion policy. Please share your thoughts on the matter at this article's deletion discussion page. |
Total population | |
---|---|
3,012,375 [1] 8.7% of the total Canadian population (2016) | |
Regions with significant populations | |
Western Canada · Central Canada · Urban less prevalent in the Atlantic and North | |
Languages | |
Canadian English · Canadian French Acadian French · Spanish · Italian · Portuguese · Greek · Serbian Other Southern European Languages | |
Religion | |
Predominantly: Christianity Minorities: Irreligion • Islam • Judaism | |
Related ethnic groups | |
Southern Europeans · Southern European Americans · Southern European Australians · Southern European Britons |
Southern European Canadians are Canadians of Southern European ancestry. Southern European Canadian people can usually trace back full or partial heritage to Italy, Greece, Spain, Portugal, Southern France, Yugoslavia, and other nations in, or ethnoculturally connected with, Mediterranean Europe.
Southern European Canadians have been studied and reported on by a wide range of publications and journalistic works, describing them as a distinct ethnic group or pan-ethnic grouping. [2] This includes research into the behaviour and health of South Europeans living in Canada. [3] [4] The group can be subdivided into national subgroups, including Albanian Canadians, Greek Canadians, Italian Canadians, Maltese Canadians, Portuguese Canadians, Spanish Canadians, Cypriot Canadians, and Yugoslav Canadians (Bosnian Canadians, Croatian Canadians, Macedonian Canadians, Montenegrin Canadians, Serbian Canadians, Slovenian Canadians). [5]
In the early 1920s, the arrivals of Southern Europeans had been impeded by national policy changes to immigration, which discounted the group's ability for agricultural work based on various ethnic prejudices from the native-born population. [6] [7] [8] From 1896 to 1905, Clifford Sifton served as Minister of the Interior, under the premiership of Wilfrid Laurier. Sifton was tasked with finding European labor for the Canadian Prairies, and enacted discriminatory policies against the group, preferring immigration from Britain, and northern Europe in general. [9] [10] Despite this, large numbers of Southern Europeans arrived from Mediterranean Europe between 1903 and 1914, with many of the male arrivals working in Canada's industrial sectors, such as mining, lumbering, manufacturing and on the railways. [11] Hundreds of thousands of Southern European immigrants came through Pier 21 in Halifax, Nova Scotia in the 1900s. [12]
The 1986 Canadian census, according to political philosopher William Kymlicka, revealed how the group, alongside French Canadians, were had one of the lowest average incomes in Canada. [13] A 1994 study showed that Southern Europeans, living in Toronto and Montreal, had the least social mobility of all ethnic groups in Canada, and that "immigrants from Southeast and East Asia behave in a somewhat similar fashion, particularly in Vancouver, where their relative concentration is the largest." [14] In 2011, political commentator Darrell Bricker noted that Southern European Canadians, who had historically tended to vote for the Liberal Party, had significantly switched to voting for the Conservative Party since the 2011 Canadian federal election. [15]
Province / territory | Population (2011) [16] | Percentage | Population (2016) [1] | Percentage |
---|---|---|---|---|
Ontario | 1,671,705 | 13.2% | 1,772,160 | 13.4% |
Quebec | 515,745 | 6.7% | 549,750 | 6.9% |
British Columbia | 303,170 | 7% | 334,740 | 7.3% |
Alberta | 182,525 | 5.1% | 215,725 | 5.4% |
Manitoba | 55,800 | 4.8% | 59,915 | 4.8% |
Nova Scotia | 26,440 | 2.9% | 28,680 | 3.2% |
Saskatchewan | 21,510 | 2.1% | 27,415 | 2.6% |
New Brunswick | 12,245 | 1.7% | 13,450 | 1.8% |
Newfoundland and Labrador | 3,985 | 0.8% | 4,765 | 0.9% |
Prince Edward Island | 2,370 | 1.7% | 2,650 | 1.9% |
Yukon | 1,380 | 4.1% | 1,490 | 4.2% |
Northwest Territories | 1,135 | 2.8% | 1,215 | 3% |
Nunavut | 390 | 1.2% | 420 | 1.2% |
Canada | 2,798,395 | 8.5% | 3,012,375 | 8.7% |
Country | Population (2001) [17] | Percentage | Population (2006) [18] | Percentage | Population (2011) [16] | Percentage | Population (2016) [1] | Percentage |
---|---|---|---|---|---|---|---|---|
Italian | 1,270,370 | 4.3% | 1,445,335 | 4.6% | 1,488,425 | 4.5% | 1,587,970 | 4.6% |
Portuguese | 357,690 | 1.2% | 410,850 | 1.3% | 429,850 | 1.3% | 482,605 | 1.4% |
Spanish | 213,105 | 0.7% | 325,730 | 1% | 368,305 | 1.1% | 396,460 | 1.2% |
Greek | 215,105 | 0.7% | 242,685 | 0.8% | 252,960 | 0.8% | 271,410 | 0.8% |
Croatian | 97,050 | 0.3% | 110,880 | 0.4% | 114,880 | 0.3% | 133,970 | 0.4% |
Yugoslav (not otherwise specified) | 65,505 | 0.2% | 65,305 | 0.2% | 48,320 | 0.1% | 38,480 | 0.1% |
Serbian | 55,540 | 0.2% | 72,690 | 0.2% | 80,320 | 0.2% | 96,530 | 0.3% |
Maltese | 33,000 | 0.1% | 37,120 | 0.1% | 38,780 | 0.1% | 41,920 | 0.1% |
Macedonian | 31,265 | 0.1% | 37,055 | 0.1% | 36,985 | 0.1% | 43,110 | 0.1% |
Slovenian | 28,910 | 0.1% | 35,935 | 0.1% | 37,170 | 0.1% | 40,470 | 0.1% |
Bosnian | 15,720 | 0.1% | 21,045 | 0.1% | 22,920 | 0.1% | 26,740 | 0.1% |
Albanian | 14,935 | 0.1% | 22,395 | 0.1% | 28,270 | 0.1% | 36,185 | 0.1% |
Cypriot | 2,060 | 0% | 3,395 | 0% | 4,815 | 0% | 5,650 | 0% |
Montenegrin | 1,055 | 0% | 2,370 | 0% | 2,970 | 0% | 4,160 | 0% |
Kosovar | 1,200 | 0% | 1,530 | 0% | 2,760 | 0% | 2,865 | 0% |
Research has suggested that, with the progression of globalization, Southern European Canadians may become more, not less, involved with their ancestral country of origin, despite sometimes being from families which are multi-generation Canadian-born. [19] Published in 2003 in Canadian Studies in Population , a study revealed that Southern European young adults, living in the Vancouver area, left home at one of the latest stages of life, or remained home-stayers more often, compared with British, Chinese and Indian Canadians. [20] Related research published in the Journal of Comparative Family Studies in 2004, had similar findings for South Europeans in Canada. [5] Data from a 2004 Housing Studies journal article showed that, in statistics relating to housing, Portuguese Canadians are typical, or most representative, of Southern European Canadians in residential behavioural patterns. [21]
In 2003, University of Alberta professor Frank Trovato's study, with Dr George K. Jarvis, found that Southern European people in Canada, particularly from Catholic backgrounds such as Italian Canadians and Portuguese Canadians, tended to have lower risk of suicide when compared with citizens from Northwestern Europe, such as German Canadians or Scottish Canadians. [4] The grouping has been used, from in-depth interviewing of around 500 parents in 2014, to compare intergenerational conflict with British Canadians, Chinese Canadians and South Asian Canadians. [3]
A 2017 Journal of the Canadian Historical Association study analyzed mid-20th-century representations of Southern Europeans; how a 1969 Scouts Canada handbook emphasized the British and French origins of the country, while regionally referring to South European people (and Eastern European Canadians) as a less significant and later progression in the history of the nation. [22]
White is a racial classification and skin color specifier, generally used for people of European origin; although the definition can vary depending on context, nationality, and point of view. This term has at times been expanded to encompass persons of South Asian, West Asian, and North African descent, persons who are often considered "non-white" in other contexts in the United States. It has also been alleged that, in the United States, people of Southern European and even Irish descent have been excluded from this category, although this idea has been contested. The usage of "white people" or a "white race" for a large group of mainly or exclusively European populations, defined by their light skin, among other physical characteristics, and contrasting with "black", "red", "brown", "yellow", and other "colored" people or "persons of color", originated in the 17th century. Prior to this, Europeans also described people from East Asia as being "white". It was only during the 19th century that this vague category was transformed in a pseudo-scientific system of race and skin color relations.
European Americans are Americans of European ancestry. This term includes people who are descended from the first European settlers in America as well as people who are descended from more recent European arrivals. European Americans are the largest panethnic group in the United States, both historically and at present.
Ukrainian Canadians are Canadian citizens of Ukrainian descent or Ukrainian-born people who immigrated to Canada. In 2016, there were an estimated 1,359,655 persons of full or partial Ukrainian origin residing in Canada, making them Canada's eleventh largest ethnic group and giving Canada the world's third-largest Ukrainian population behind Ukraine itself and Russia. Self-identified Ukrainians are the plurality in several rural areas of Western Canada. According to the 2011 census, of the 1,251,170 who identified as Ukrainian, only 144,260 could speak the Ukrainian language.
The Demographics of Montreal concern population growth and structure for Montreal, Quebec, Canada. The information is analyzed by Statistics Canada and compiled every five years, with the most recent census having taken place in 2016.
"Cultural mosaic" is the mix of ethnic groups, languages, and cultures that coexist within society. The idea of a cultural mosaic is intended to suggest a form of multiculturalism, different from other systems such as the melting pot, which is often used to describe nations like the United States' assimilation.
Italian Canadians comprise Canadians who have full or partial Italian heritage and Italians who migrated from Italy or reside in Canada. According to the 2016 Census of Canada, 1,587,970 Canadians claimed full or partial Italian ancestry. The census enumerates the entire Canadian population, which consists of Canadian citizens, landed immigrants and non-permanent residents and their families living with them in Canada. Residing mainly in central urban industrial metropolitan areas, Italian Canadians are the seventh largest self-identified ethnic group in Canada behind French, English, Irish, Scottish, German and Chinese Canadians.
The demographics of Toronto, Ontario, Canada make Toronto one of the most multicultural and multiracial cities in the world. In 2016, 51.5% of the residents of the city proper belonged to a visible minority group, compared with 49.1% in 2011, and 13.6% in 1981. Toronto also has established ethnic neighbourhoods such as the multiple Chinatowns, Corso Italia, Little Italy, Little India, Greektown, Koreatown, Little Jamaica, Little Portugal and Roncesvalles, which celebrate the city's multiculturalism.
Immigration to Canada is the process by which people migrate to Canada for the purpose of residing there—and where a majority go on to become Canadian citizens. As of 2019, Canada has the eighth largest immigrant populations in the world, while foreign-born people make up about one-fifth of Canada’s population—one of the highest ratios for industrialized Western countries.
The demographics of Metro Vancouver indicate a multicultural and multiracial region. Metro Vancouver is a metropolitan area, with its major urban centre being Vancouver, British Columbia, Canada. The Vancouver census metropolitan area, as defined by Statistics Canada, encompasses roughly the same territory as the Metro Vancouver Regional District, a regional district in British Columbia. The regional district includes 23 local authorities. Figures provided here are for the Vancouver census metropolitan area and not for the City of Vancouver.
The history of immigration to Canada details the movement of people to modern-day Canada, which also belongs to a wider debate continuing among anthropologists over various possible models of Settlement of the American to the New World, as well as their pre-contact populations.
Asian Canadians are Canadians who can trace their ancestry back to the continent of Asia or Asian people. Canadians with Asian ancestry comprise the largest and fastest growing group in Canada, after European Canadians, with roughly 17.7% of the Canadian population. Most Asian Canadians are concentrated in the urban areas of Southern Ontario, Southwestern British Columbia, Central Alberta, and other large Canadian cities.
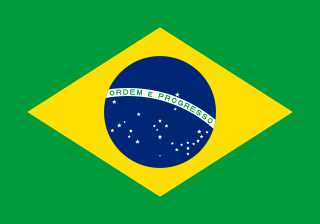
Brazilians are the citizens of Brazil. A Brazilian can also be a person born abroad to a Brazilian parent or legal guardian as well as a persons who acquired Brazilian citizenship. Brazil is a multiethnic society, which means that it is home to people of many ethnic origins. As a result, a majority of Brazilians do not identify their nationality as not being necessarily directly related to their ethnicity; in fact, the idea of ethnicity as it is understood in the anglophone world is not popular in the country.
Immigration to Europe has a long history, but increased substantially in the later 20th century. Western Europe countries, especially, saw high growth in immigration after World War II and many European nations today have sizeable immigrant populations, both of European and non-European origin. In contemporary globalization, migrations to Europe have accelerated in speed and scale. Over the last decades, there has been an increase in negative attitudes towards immigration, and many studies have emphasized marked differences in the strength of anti-immigrant attitudes among European countries.
European emigration can be defined as subsequent emigration waves from the European continent to other continents. The origins of the various European diasporas can be traced to the people who left the European nation states or stateless ethnic communities on the European continent.
Indian Canadians are Canadians with ancestry from India. The term Indo-Canadian or East Indian, is sometimes used to avoid confusion with the Indigenous Peoples of Canada. Statistics Canada specifically uses the term Asian Indian to refer to Indian Canadians. Categorically, Indian Canadians comprise a subgroup of South Asian Canadians which is a further subgroup of Asian Canadians. According to Statistics Canada, Indian Canadians are one of the fastest growing communities in Canada, making up the second largest non-European group after Chinese Canadians.
The population of Brazil is very diverse, comprising many races and ethnic groups. In general, Brazilians trace their origins from three sources: Europeans, Amerindians and Africans. Historically, Brazil has experienced large degrees of ethnic and racial admixture, assimilation of cultures and syncretism.
Canadians are people identified with the country of Canada. This connection may be residential, legal, historical or cultural. For most Canadians, many of these connections exist and are collectively the source of their being Canadian.
European Canadians, also known as Euro-Canadians, are Canadians with ancestry from Europe. They form the largest panethnic group within Canada with roughly 73 percent of the population.
Argentines are people identified with the country of Argentina. This connection may be residential, legal, historical or cultural. For most Argentines, several of these connections exist and are collectively the source of their being Argentine.
Eastern European Canadians are Canadians of Eastern European ancestry. Eastern European Canadian people can usually trace back full or partial heritage to Russia, Ukraine, Belarus, Moldova and other nations in, bordering with, or otherwise culturally connected to Eastern Europe.
Source countries differ, with more Latin American and especially Mexican migrants in the US and proportionally more Asians and Eastern and Southern Europeans in Canada; and in the US the third generation visible minority group is much larger.
Data are drawn from in-depth interviews with 490 parents (mean age of 58) with at least one young adult child aged 18 to 35 living in Metro Vancouver, British Columbia belonging to one of four ethnic groups: British, Chinese, South Asian or Southern European Canadians.
Trovato and Jarvis (1986) observed that foreigners in Canada from Southern European origins and a Catholic religious culture (such as Italians and Portuguese) tend to share low odds of suicide, whereas immigrants from predominantly Protestant and Anglo-Saxon countries share above average risks (i.e., American, German, Scottish).
In particular, young adults from Greek, Italian, Balkan, Portuguese and many Asian origins remain at home the longest ... South European-Canadians, a more mixed pattern exists: for female young adults, forming a marital union is the most important reason
Xenophonic feelings in Canada also resulted in immigration policies that limited the number of Southern Europeans in Canada and. Consequently, the Italians.
Sifton’s preferences as regards immigrant groups were explicitly in favour of northern Europeans over southern Europeans, Whites over non-Whites, and people with experience farming in prairie-like conditions.
This bias against southern Europeans had been evident in the immigration priorities established during Clifford Sifton's term as Minister of the Interior.
Clifford Sifton was minister of the interior from 1896 to 1905 under Prime Minister Wilfrid Laurier. Sifton's job was to settle the Prairies and bring in labour. He focused his campaigns on Britain and northern Europe but not southern Europeans.
Sifton excluded southern Italy from recruitment because he considered southern Europeans inadequate to the challenges of life on the prairie ... By the early 1900s, Canadian eugenicists increasingly adopted the U.S. movement's proposals to restrict eastern and southern Europeans.
From 1903 to 1914, more than one-quarter of all immigrants came from continental Europe, with a pronounced increase in the migration of Ukrainians, Poles, Italians and other eastern and southern Europeans ... a growing proportion of eastern and southern Europeans were brought in to do the rough, unskilled work in Canada's flourishing railway, mining, lumbering, and manufacturing sectors.
For example, 1986 Census statistics show that Arab-Canadians have a higher per-capita income than British-Canadians, and that South Asian-Canadians have a higher average income than either South European-Canadians or French-Canadians.
Earlier studies (Ram and Shin 1995; Ram, Shin, and Pouliot 1994) showed that southern Europeans living in Toronto and Montreal are the least mobile group, regardless of the period of immigration or the duration of residence in Canada.
Mr. Bricker said, traditionally, Southern European Canadians were a Liberal bastion, but in the last election a lot of those votes were lost to the Tories.
Rather, the transnational practices of southern-European Canadians may increase as the forces of globalization, geographical effacements, and extended identities circulate within Canada
In this exploratory study, we profile variations in home leaving, home returning, and home staying behaviour among four ethnocultural groups in Canada - British, Chinese, Indian, and South European ... third of the South European-Canadians are home stayers – 35.6% and 36.3%,. respectively, for male and female young adults.
In this respect, the Portuguese are typical of Southern Europeans in Canada. These immigrants' wish to move to a larger, modern house in the suburbs supports previous research in Canada in this area
Indeed, the 1969 Canadian Scout Handbook section on “Canada’s National Origins,” which purported to outline Canada’s contemporary ethnic and racial composition, continued to emphasize the British and French as the two founding nations, while detailing the myriad different national origins of northern, Eastern and Southern European Canadians.